POLKADOT - Do NOT Miss This 🔥🥵Polkadot is showing us clean price action and the buy zone is evident. We are currently in an ABC correction and anticipating the end of C wave shortly and the start of the next impulse.
We have the 0.88 fibonacci supporting our buy region as well as the double bottom.
Trade Idea:
- Watch for bullish pressure at around the $10 region
- Enter when there's a bullish Daily candle at buy zone
- Stops below $10
- Target recent highs as first target. -0.27 as second target. HODL the rest!
This trade should not be missed! Put your alerts on so you can stay up to date with DOT.
Goodluck!
Altsignals

XRP - Just Getting Started... (WEEKLY VIEW)XRP is approaching a key level where we may see the biggest wave (wave 3). We are currently in an ABC correction with the C wave possibly finishing at the double bottom region at 0.5.
Trade Idea:
- Watch for bounce at the end of C wave at the double bottom area (0.5)
- When bullish price action appears, enter with stops below the recent lows
- Target $1.90 as first target. Actively manage the rest. If this scenario is correct, we can see XRP soar to levels of $3 and higher!
Please see chart update for Daily Timeframe.
Please note that this is loosely based on Elliot wave theory and the extensions are not to scale. Will update this chart regularly once price action appears.
Goodluck!

DOGECOIN - Once In A Lifetime Opportunity 🌟Dogecoin has been difficult to read as of late but going to the higher timeframe, it can be seen that we had a clear impulse down and then an ABC correction and we're at the start of maybe another impulse down.
We have 3 major levels which we are looking at for a bounce.
First area: 0.17
Price bounced off this price multiple times and we are now showing some sort of rejection here
Second area: 0.8 to 0.9
It was previous a level dogecoin failed to break. This could hold some relevance if price gets back here and may act as a support for the next bounce.
Third area: 0 to 0.01 (also has -0.27 fibonacci target)
Depending on how you see it, this could either be the best case scenario or the worst case scenario.
Best case: if you're not holding any Dogecoin at the moment and want to get in and stock up. If bought near 0, any move up would mean exponential gains for your portfolio!
Worst case: If you are holding Dogecoin and your portfolio is bleeding. However, this may just be a blessing in disguise as it can be an opportunity for you to get more Dogecoin!
This may well and truly be the last chance to get into Dogecoin before we never see these low prices again. Pay close attention to this one!

CARDANO - Important Update 🚨After the recent crash in Crypto, the market has changed slightly. The corrective phase has just got bigger but we're still very much bullish.
For Cardano, we can see that the $1 level holds a lot of weight. On several occasions. price has reacted to the $1 level and successfully bounced from it. We are yet again approaching that level and we have a number of confluences supporting our bullish reversal idea.
We have:
- bearish fibonacci target of -0.618
- Corrective channel support
- Major structure level $1
Trade idea:
- Watch for price to hold the $1 level
- On the bounce, enter with stops below $1
- Target the recent highs as first target and then hold the rest and manually manage the position
This bounce may be the one that takes us to another ATH - lets not miss this!

Altcoin Market UpdateAn update for the altcoin market including (TOTAL2, and OTHERS)
As you can see, on the left, we are still in a very good spot for bullish action
Current price can be seen to be very similar to the early days of TOTAL2, providing a nice comparison
On the right, the OTHERS chart, also provides similarities to the earlier bull run, and suggests we are heading higher.
0.618 was a previous point of rejection during this massive bull run. If 1.618 is hit this will likely act as a rejection point as well.
UP!

Wrapped NCG - Short Lived Hype?WNCG saw a rise of almost 500% in 2 weeks recently, but it appears just as soon as the excitement started kicking in, things reversed drastically. WNCG has already lost 50% of its value.
To SHORT WNCG, watch for bear flags and take it down to the structure level indicated.
To LONG WNCG, watch for a bounce at the structure level. If we break the structure level, bullish reversal play will be invalidated.

RMRK - Watch For CorrectionRMRK has been in a nice uptrend and has had clear bullish corrections.
Trade Idea:
- Watch for the next clear correction
- Enter on breakout of correction
- put SL below the correction
Actively manage your trade as there's no previous price action to tell us where this may end up!

CARDANO - MOON!We are in a series of impulse and corrections and it appears the correction has maybe ended and we are at the start of an impulse.
Cardano hit the wedge support and is bouncing off nicely. We also have the 78.6 fibonacci which we bounced from.
Trade idea:
- Enter with stops below the wedge
- Target the highs as first targets, -0.27 as second target and HODL the rest
This is one trade that is not to be missed!

DOT - Multiple Fibonacci Breakout!DOT recently bounced of 2 fibonacci levels.
The bigger fib was drawn from the lowest point to the highest point (pink fibonacci).
The smaller fib was drawn from the recent higher low to the highs (blue fibonacci).
This indicates to us to that there's bullish buying pressure now. We also so a breakout of the red descending trendline indicating to us that the bearish trend has ended.
Trade Idea:
- Watch for bull flags on lower timeframe
- When entered, put SL below the fibonacci level
- Target recent highs as first target, -0.27 as second target
Goodluck!

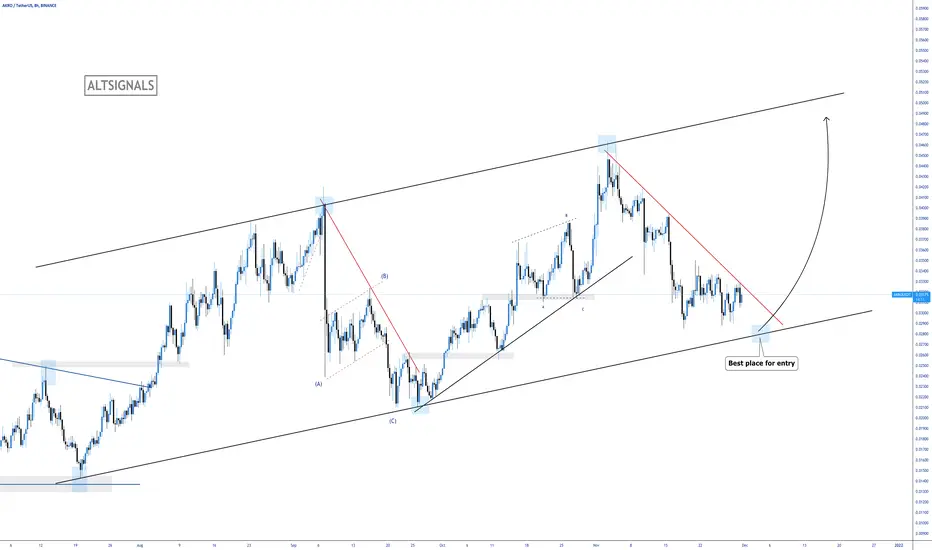
AKRO - Another Breakout 🎯AKKRO is currently within a parallel channel and approaching the channel support. The last time we saw similar price action, we broke out in excess of 100%. Anticipating a similar breakout this time round.
Trade Idea:
- the best place to enter would be at the channel support. If we dont get there, watch for a strong breakout
- Stops below the parallel channel
- Target recent highs as first TP and channel resistance as second TP
Be sure to use proper risk management on this trade as we'll require a bigger SL if we break out early. Keep that in mind. Goodluck!
POLYLASTIC - See Something Familiar? 🤔POLX is making some really interesting price action.
If you look at the price action in the grey box, they look almost identical. The last time we saw that price action, we broke out around 250%! We could be seeing another breakout like this very soon.
Trade Idea:
- Watch for a break of the descending red trendline
- Enter with stops below the major ascending black trendline
- Target highs as first TP and then manually manage your other position
Keep an eye out for bull flags on lower timeframe for additional entries!

DOGECOIN - BREAKOUTIt could be time that Dogecoin finally breaks out! We've been looking for Dogecoin to move up for some time and now it seems to be making more sense.
We had that push up late July and now we're in an ABC correction ready for the next impulse.
Trade Idea:
- Entry with stops below the lows (0.1820)
- Target the corrective resistance as first TP (0.33) and HODL the rest

SXP - Watch This Breakout!SXP is currently within a channel and anticipating another move up to the channel resistance.
We have a red descending trendline in place which we can watch for confirmation.
Trade Idea:
- Risk Entry now
- Safe entry after the break of the red descending trendline
- Stops below the channel and 78.6 Fibonacci
- Target the recent highs as first TP and -0.27 as second TP. HODL the rest
We might be at the start of another bull run so leave one position open!

XRP - Don't Miss This!In our last XRP analysis we mentioned that we had 2 reversal areas - one of which was the double bottom.
Price bounced off that structure level perfectly, completing the ABC correction which means... time for the next impulse!
Trade Idea:
- Enter with stops below the 61.8 fibonacci
- Target the highs as first TP, -0.27 as second TP and HODL the rest.

SOLANA - Watch This Moon!In our last SOL analysis we mentioned that the key area to look for trades would be the structures.
Price corrected back to the structure and we had a descending trendline which helped us identify when the correction is over and when the breakout begins. Price rejected the structure level perfectly and broke out!
We could be seeing $300 and more!
Trade Idea:
- You should already be in this from the previous analysis
- If not, watch for lower timeframe bull flags and enter with stops below the correction
- Target the highs as first TP and then HODL the rest
This could blow up loads!

ETHEREUM - New All Time Highs!In our last ETH analysis we were looking for a rejection from the structure level at 4530 as we were expecting one more move down before the next bull run.
Price rejected perfectly and came down to retest the 38.2 fibonacci and a structure level (as indicated in the chart)
Trade Idea:
- Risk entry now and stops below the 38.2
- Targetting the ATH as first targets and -0.27 as second and HODL the rest
As Ethereum and Bitcoin are already moving, we can assume that other Altcoins will be making their move soon too!

BITCOIN - The Next BULL RUN!In our last Bitcoin analysis we were looking for Bitcoin to come back to the structure and 50 fibonacci. Price tapped the 50 fibonacci perfectly and bounced up.
We could be on the verge of a breakout and the next big impulse.
Trade Idea:
- Watch for a break of the correction and enter with stops below the 50 fibonacci
- If we come back down to the 50 fibonacci, enter with stops below the ascending trendline
- Target the ATH's as first target and then HODL the rest
Big moves coming, don't miss it!

CAKE - Watch For This Reversal!CAKE is showing us some really clear price action and we are approaching a significant level where we are expecting a reversal. We've seen that we previously had a triple bottom from the structure level indicating that It holds a lot of weight.
Trade Idea:
- Watch for price to come back to the structure level ($10 level)
- Once price shows bullish pressure, enter with stops below the structure level
- Targets: 17 - 26 - 44
We may get an early breakout and if we do, enter with stops below the recent lows.

VET - Key Reversal Zones 🚨VET is approaching 2 key reversal zones which should be paid close attention to.
VET has been making higher highs and higher lows indicated that we are in an uptrend. Naturally we'd want to see another higher low to indicate that we are still in a bullish trend.
The first area is the parallel channel support. We already tested the 61.8 fib but we can hover here and spike down a little more before moving up.
The other important area is the 78.6 fibonacci where we have structure.
Watch for a clear bounce off one of these two levels and enter with stops below the rejected area.
Target the recent highs as first target and then HODL the rest.

MKR - Bullish Takeover 🔥From our last analysis on MKR, we had a really nice breakout and then created a bullish correction for a move higher.
The play here it to wait for the next bullish correction which will likely come back to the ascending trendline and then entry with stops below the trendline. However, if you want to enter now, you can look for lower timeframe pullback and then enter with stops below 61.8 fibonacci.
There's enough room for MKR to move up and we're targeting atleast 6000.

FIL - 3 Is The Magic Number ✨FIL has been failing to breakout recently. Everytime there's been a correction which looks like it will breakout and moon, it quickly lost steam and failed to move higher.
We are on our third breakout and you know what they say, 3 is the magic number.
Trade idea:
- Enter with stops below the lows
- Target the previous highs
IF we breakdown again, we'll watch for yet another breakout. Surely one of them has to be the one that takes us to the moon!

DENT - Multiple Bounces!Everytime Dent comes back to the ascending trendline, we see some sort of bullish reaction.
We are once again back at the trendline and seeing some sort of bullish price action indicating that we may once again see a push up.
Trade Idea:
- Risk entry now
- Safe entry after break of descending red trendline
- Stops below the ascending trendline (if we break that, our bullish outlook will be invalidated)
- Target recent highs as first TP
Goodluck!

OGN - Trade Within This Channel 💥OGN has been within a parallel channel and seems to be respecting it well.
We now have 2 main areas where we can look for buys. Naturally the best place to enter buys would be at the channel support as there would be a clear invalidation level. The other place to look for buys would be the recent structure base that was formed.
Trade Idea:
- Watch for a bounce off from either of these 2 areas
- Enter with stops below the rejected price
- target the parallel channel resistance as targets
