AKRO - Are We Ready To Break Out?AKRO is at a really good place to look for a trade. If we break up from here, we can easily look for bull flags to take this higher.
If we break the ascending trendline, we can short it until the previous lows. East set up!
Altsignals

BITCOIN - UPDATELast time we analysed bitcoin, we were looking at the 36K level for a bounce up. Price retested the 36 level and shot up 16%!
We are now at a very strong level where we are seeing some resistance. We can see that previously price broke the 42K level and retested it on its way down.
LONG IDEA: Wait for the 42K level to break and get in on the retest.
SHORT IDEA: Wait for the ascending correction to break and get in on a bear flag back to the 36K level as first TP.

CARDANO - Going Parabolic!Cardano recently had a triple bottom reversal. We appear to be in a parabolic trend which is setting up for a big move. For confirmation we Weill be looking for a break of the parabolic trend to the upside and a retest of a structure level.
We will be targeting the all time highs once we break.

ANKR - Are We Ready To Break Out??ANKRUSDT has been in a descending channel since late February. It appears to be respecting the channel as we've seen rejections on both extremes of the channel.
Recently we've seen a double bottom which is often a reversal pattern. This could indicate that we may be breaking out very soon. Watching this one closely to see if we can break the structure level and channel.

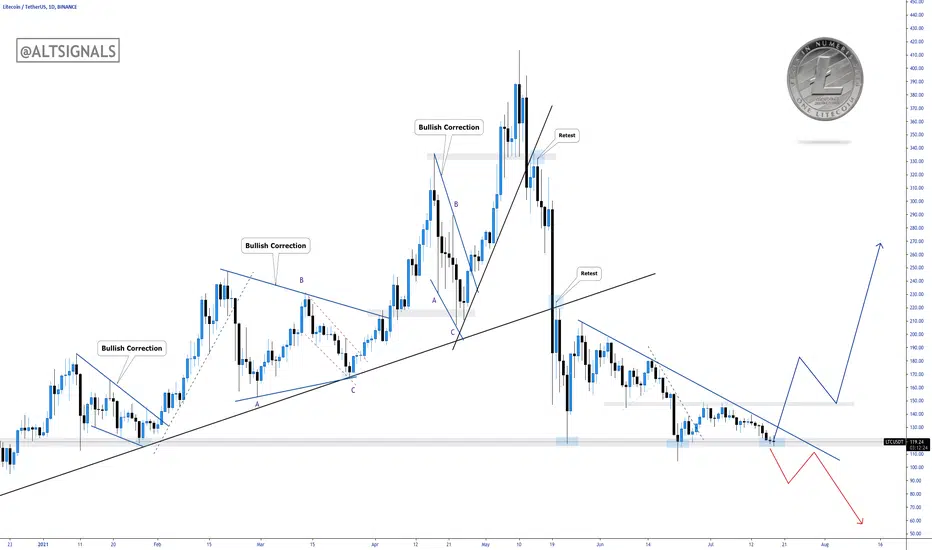
LITECOIN - Double Bottom ReversalIn our previous analysis, we were looking at the bottom for a reversal back to the upside. We have now broken the descending trendline indicating that we are now bullish, even if its only for the short term.
The next area of interest we are looking at is the 146 where we have previous structure. If we break through that level, we will be looking for a retest to take this even higher.
See our educational post on reversal patterns and how to identify them.

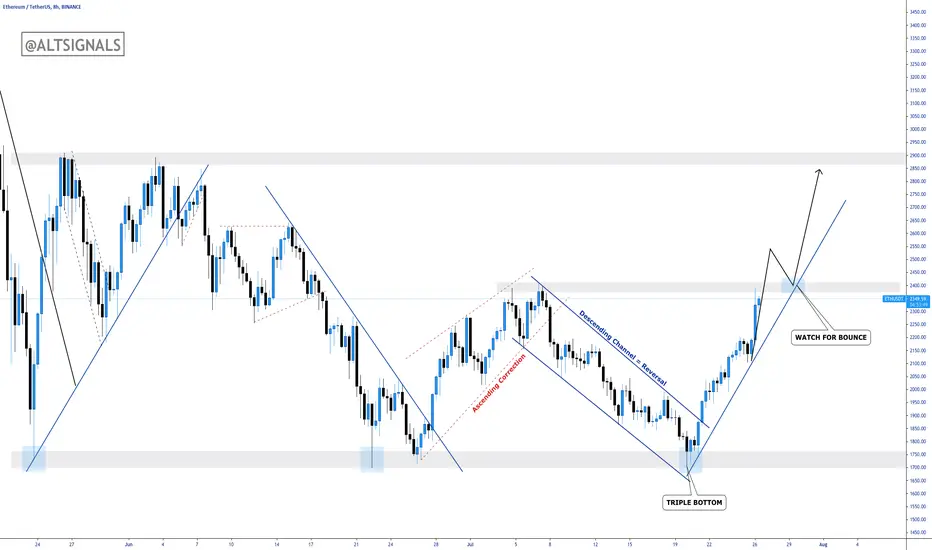
Ethereum - Triple Bottom Reversal!In our last Ethereum analysis, we were short from the break of ascending correction back to the bottom - raw gains of almost 25%!
We saw a triple bottom chart pattern which is a highly probable bearish to bullish reversal pattern. We are now approaching a very interesting level where we can look to add another buy position.
At the 2400 level, price converges with trendline and structure making it a high probability area to buy. Watch for price to clear the 2400 level and get in on the retest.
MATIC - Bullish BreakoutMatic was in a bearish correction since the massive spike in May. We have recently broken out of the descending trendline indicating that we are in bullish territory now.
Watch for price to break the 1.20 level and get in on the retest. We have previous structure and the ascending trendline converging at that point, making it a high probability area to go long.

BITCOIN - Watching 36K For Continuation!In our last Bitcoin Analysis. we were signalling that we may see a breakout soon. Since that post, we got a massive 30% breakout!
Retracement Long Scenario:
Watch for price to retrace back to the 36K level where we have previous structure. Entry on breakout of the retracement correction.
Continuation Long Scenario:
Watch for price to break the 41K level and get in on the retest of 41K with stops below the structure.
Short Scenario:
Watch for price to break the 36k level and enter on the retest with targets of 30K. Stops above the 36K structure level.

EDUCATION - TOP REVERSAL PATTERNS ⚡At the end of a trend, there is a typically a reversal pattern indicating to us that the trend is about to reverse. There are 3 main patterns that you NEED to know.
1. Double Top/Double Bottom
A double top/bottom pattern is a chart pattern that consists of 2 consecutive peaks of similar height indicating that there is not enough buying/selling pressure to surpass the extremes of the price. This leads to a reversal in trend.
Double top is a bullish to bearish trend reversal.
Double bottom is a bearish to bullish trend reversal.
For a safe entry, entry would be after the break of the neck line (the last swing point) which is a confirmation that the it is a valid double top/bottom pattern.
Double Top:
2. Rising Wedge/Falling Wedge
A rising/falling wedge is a chart pattern that occurs when price is making higher highs and higher lows (in an uptrend – rising wedge) and lower lows and lower highs (in a downtrend – falling wedge). As the pattern progresses in the wedge, the range of the price contracts and is confined between 2 lines which get closer. Price eventually breaks out of the wedge and creates a reversal.
Rising wedge is a bullish to bearish trend reversal.
Falling wedge is a bearish to bullish trend reversal.
For a safe entry, wait for a breakout of the wedge to confirm the validity of the wedge pattern.
Rising Wedge:
3. Head & Shoulders/Inverse Head & Shoulders
A head and shoulders pattern is a chart pattern that appears as a baseline with three peaks. The outside two peaks (shoulders) are close in height and the middle is highest.
A normal head and shoulders is a bullish to bearish trend reversal.
An INVERSE head and shoulders is a bearish to bullish trend reversal.
For a safe entry, it is often advised to enter on the break of the neckline as that would be confirmation of the head and shoulder pattern.
Inverse Head & Shoulders:
Do your best to find them in your analysis!

BITCOIN - Is It Time For Take Off?The last time we analysed Bitcoin, we were at the the 34K level calling shorts back down to 30K. We have almost approached 30K now where we have previous price action.
If we hold the 30K level and bounce from here, we can possibly see ourselves revisiting the 36.4K level in the coming week.
Trade Plan:
- Wait to see if 30K holds.
- Watch for descending trendline break on lower timeframe (See chart update for lower timeframe analysis)
If we break below the 30K level, we could see lows of 27K.

DOGECOIN - Are We Going To The Moon?Dogecoin is also at a very important level. We are at the triple bottom level where the next moves will dictate whether we will see Dogecoin go to the moon or flop back to the bottom.
Wait to see how price reacts. If it breaks above the descending trendline, we could see it move up. If it breaks below, we could be revisiting the lows from last year.
SHORT PLAY:
Watch for 0.16 to break and then enter on the retest.
LONG PLAY:
Wait for price to break the descending trendline and look for bull flags to take it higher.

LITECOIN - Moment Of TruthNot much has been happening with Litecoin recently. We are still under the bearish trendline and we have approached a key structure level. If we break below this level, all the gains from 2021 will have been cancelled!
Either way we can look to make money. Watch for the market to make its move first and then get in on a retest.
SHORT PLAY:
Watch for price to break below 119 and then enter on the retest of 119
LONG PLAY:
Wait for price to break above the descending trendline and enter on the retest of 149.

EDUCATION - Candlestick Cheat Sheet ⚡⚡One of the most powerful tools in your trading arsenal should be candlestick patterns. Various candlestick patterns can tell us where the market is heading.
These patterns can be found on all timeframes, however the Daily candlestick patterns appear to be the most reliable.
Once you see these patterns, you can ready yourself for the next move and use other tools to enter the market such as flag patterns, MA strategy - which we've covered before (See linked charts).
