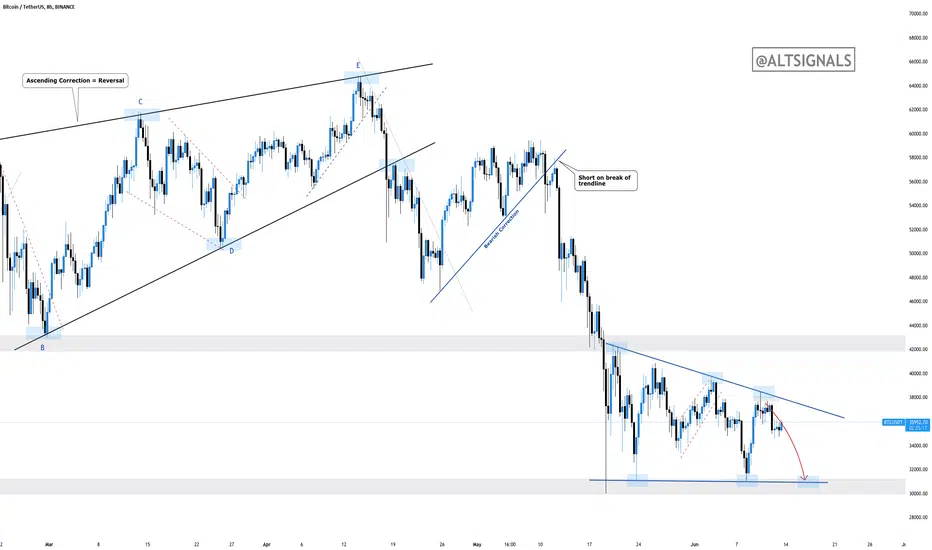
BITCOIN - 30K First Target!Following our last analysis on Bitcoin, we were expecting price to continue to drop from the 38K level. We are still very much bearish on BTC until atleast 30K where we will check to see how price reacts.
Currently looking for bear flags to take this down further!
Altsignals
BITCOIN - 30K First Target!Following our last analysis on Bitcoin , we were expecting price to continue to drop from the 38K level. We are still very much bearish on BTC until atleast 30K where we will check to see how price reacts.
Currently looking for bear flags to take this down further!

💎 ALTS: Time to Put Money Into Top 100 Alt Coins🤑🤑🤑🤑🤑Hello Dear Traders,
In chart u can see tht money is flowing again in alt coins, After Accumulation at 800billion finally we can see rise in alts market cap.
Invest in only Top 100 Altcoins and sell once u see alts market cap reaching
Target 1: 1.02 Trillion
Target 2: 1.150 Trillion

USDCHF - History Repeating ItselfUSDCHF recently bounced off a double bottom area. We are now looking for buying opportunities such as bull flags and break and retests.
In early 2021, we had the perfect price action that took us up over 600pips. We are now looking for similar price action to take us back up!
Watch lower timeframe for bull flags.
Goodluck and trade safe!

1INCH - Inches Away From Double Bottom! 1inch has been really clean in terms of technical analysis. It has given us clear patterns and structures to work with.
After breaking out of the parallel channel, price retested the structure level within an ascending correction. We are now on our way back to the bottom where we can look for signs of reversal.
Keep a close eye on the double bottom level 1.7770.

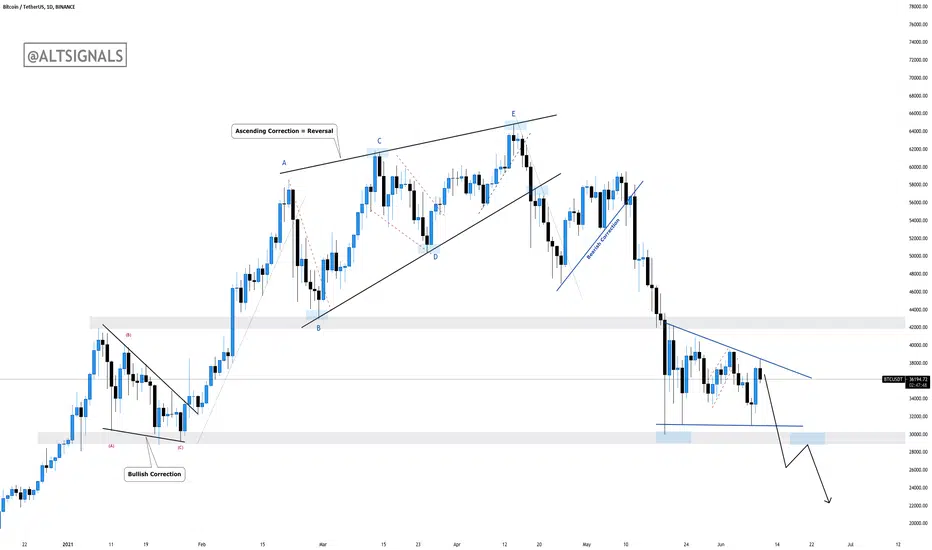
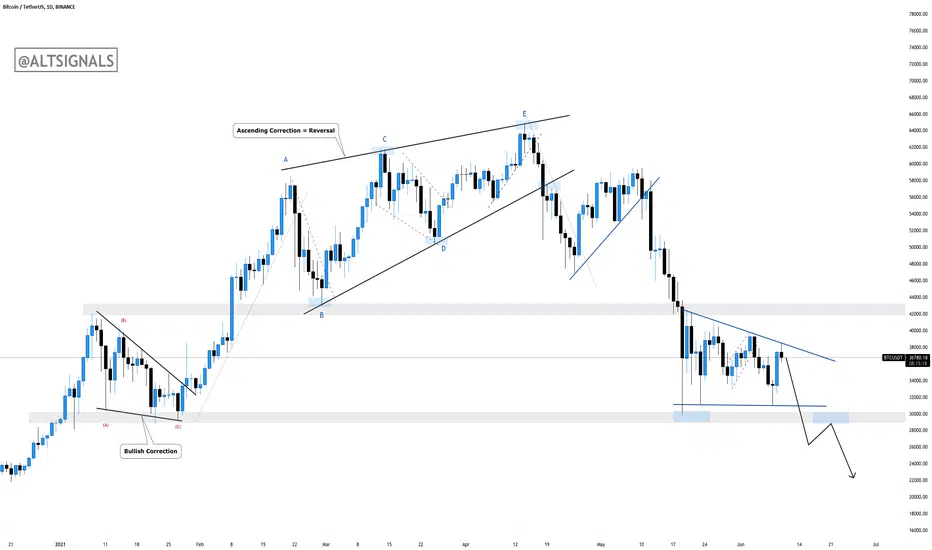
BITCOIN - MAX PAIN IDEA! Bitcoin is currently in a correction and has the chance of breaking on either side. At the moment it looks likely that it will go lower! Buyers do not seem committed at this moment so there may be another drop!
Back to 22K-26K? Possible.
BITCOIN - MAX PAIN IDEA!Bitcoin is currently in a correction and has the chance of breaking on either side. At the moment it looks likely that it will go lower! Buyers do not seem committed at this moment so there may be another drop!
Back to 22K-26K? Possible.
1INCH - Inches Away From Double Bottom!1inch has been really clean in terms of technical analysis . It has given us clear patterns and structures to work with.
After breaking out of the parallel channel , price retested the structure level within an ascending correction. We are now on our way back to the bottom where we can look for signs of reversal.
Keep a close eye on the double bottom level 1.7770.

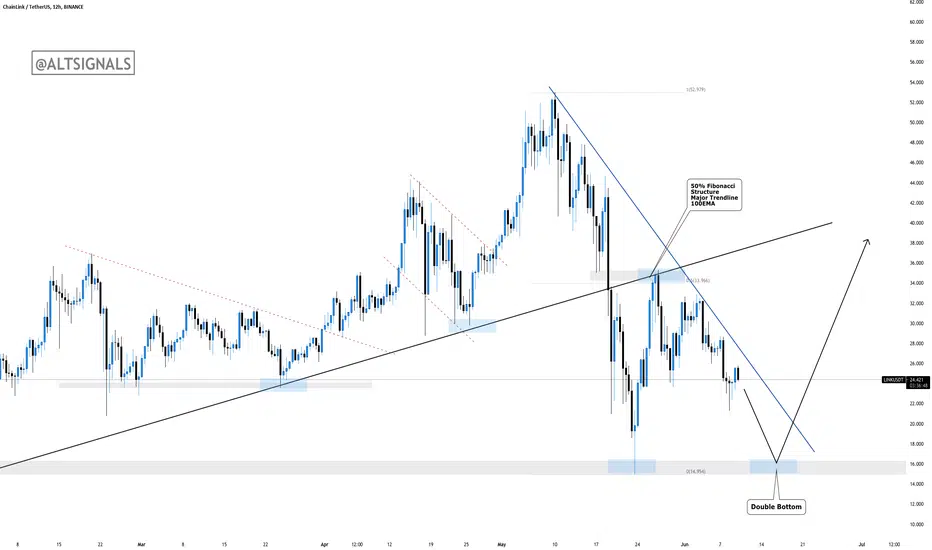
ChainLink - Whats Next?Following the break of the major trendline, we saw a retest of the major trendline, previous structure, 100EMA and the 50% fibonacci which made it a high probability short! We are now approaching a key level where price has the potential to reverse.
The key are to look at is the $15 level where we have previous structure. If price bounces continues to correct towards the double bottom area, it will be highly likely that we'll bounce from there. Also keep an eye on the descending trendline and monitor it for a break!
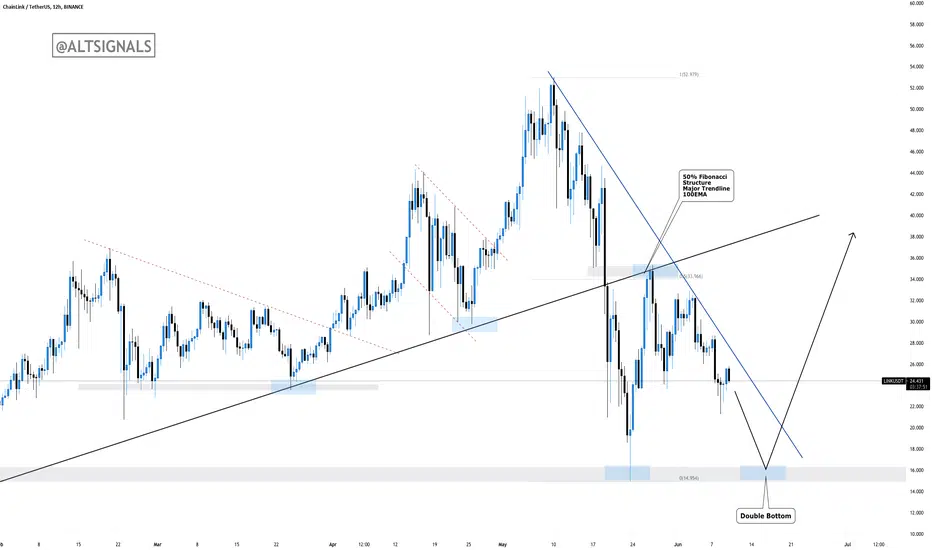
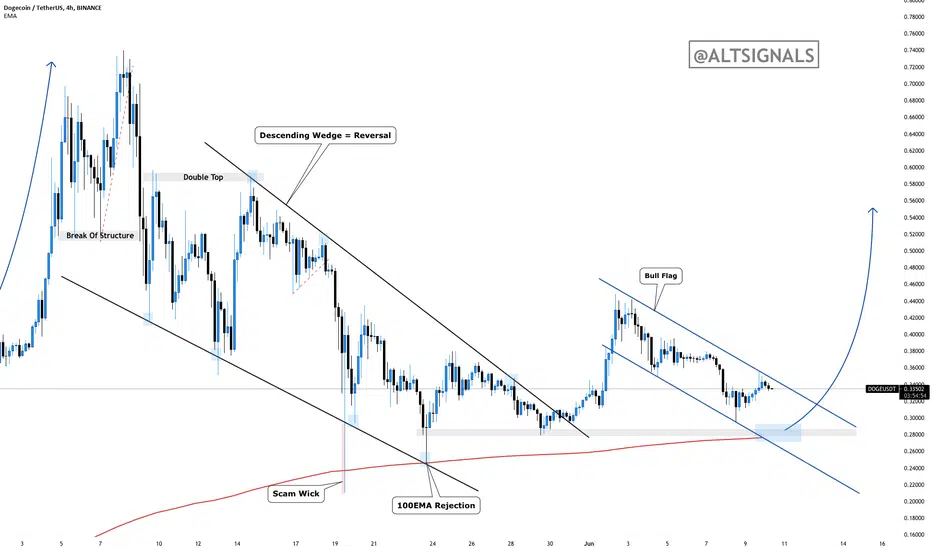
DOGECOIN - Bull Flag Anyone??Following our educational post about flag patterns, we are now seeing a bullflag for Dogecoin.
After the breakout of the descending wedge at the end of May, we had a nice impulse and now we are in a correction that looks to be a bull flag. The bull flag support lines up nicely with our previous structure and the 100EMA.
Watch for buying pressure at the 0.28 level. Alternatively, watch for a breakout of the flag!
Refer back to our educational post on how to trade flags. See linked chart below.

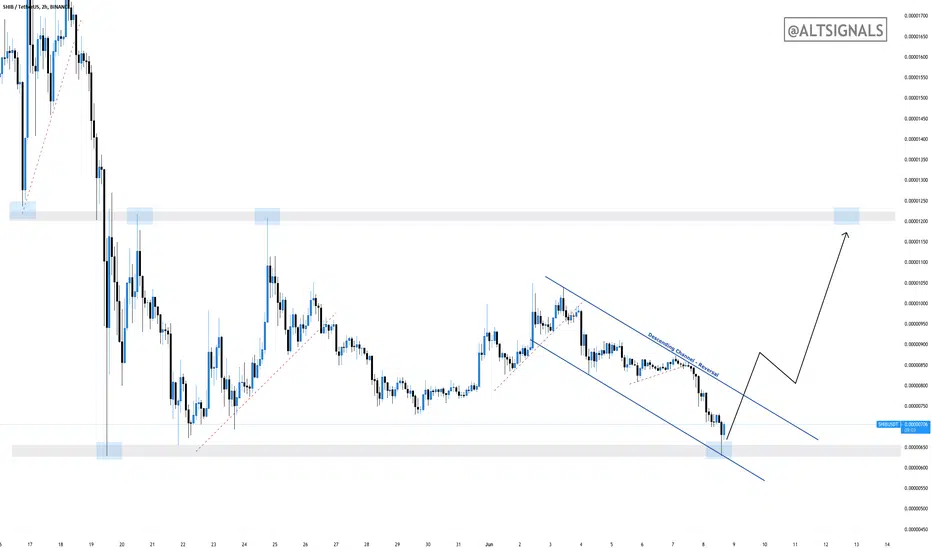
Doges Lil Bro SHIB - Whats Next?We have had Shib on our radar for the last few weeks as it has the potential to make exponential gains just like Dogecoin did recently. From the chart we can see that we've approached the bottom again within a descending channel , which is often a reversal pattern. A break upwards of the channel will be validation of our reversal signal.

Doges Lil Bro SHIB - Whats Next?We have had Shib on our radar for the last few weeks as it has the potential to make exponential gains just like Dogecoin did recently. From the chart we can see that we've approached the bottom again within a descending channel, which is often a reversal pattern. A break upwards of the channel will be validation of our reversal signal.
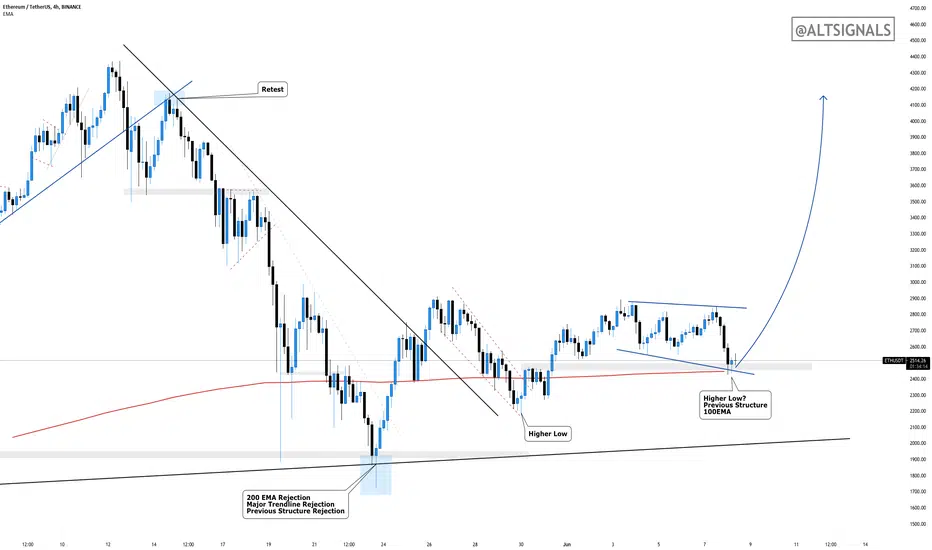
ETHEREUM - Back To All Time Highs!After Ethereum broke out of the trendline in late May, we have been seeing a series of higher lows indicating that buying pressure has been introduced. We are not at a pivotal point where we have previous structure, 100EMA and a possible higher low. All signs point to Ethereum being bullish!

ETHEREUM - Back To All Time Highs!After Ethereum broke out of the trendline in late May, we have been seeing a series of higher lows indicating that buying pressure has been introduced. We are not at a pivotal point where we have previous structure, 100EMA and a possible higher low. All signs point to Ethereum being bullish!
EDUCATION - Identifying & Trading Flag PatternsIn this post, we will be explaining what a flag patterns is and how to identify and trade them.
What is a Flag?
The flag pattern is the most common continuation patterns in technical analysis. It often occurs after a big impulsive move. The impulse move is followed by short bodied candles countertrend to the impulse move, which is called the flag. It is named because of the way it reminds the viewer of a flag on a flagpole.
Often, the breakout of the flag is the same size as the impulse leading to the flag. We can use this to create our take profit levels.
There are 2 types of ways we can trade flag patterns; Risky Entry & Safe Entry. See below for the pros and cons for both and how to enter them
_______________________________________________________________________________
Risk Entry:
The reason why it is called a risk entry is because we haven't got many confirmations apart from the bounce off the fibonacci level. Price may have the potential to go lower for a deeper correction before moving up. Whereas for the safe entry, the confirmation that it is a valid flag would be the break of the flag pattern.
How to trade using Risk Entry:
Wait for price to bounce off the fibonacci levels (0.5 or 0.618) and then enter with stops below/above the correction.
One of the advantages of doing a risk entry is that we can have small stop loss and have a great risk:reward ratio. Also, we can gain an entry at the start of the move and HODL!
Safe Entry:
Safe entry requires more than one confluence and requires confirmation. We have the rejection of the fibonacci level as well as a breakout of the flag, confirming that it is a valid flag pattern.
How to trade using Safe Entry:
For a safe entry, enter upon the break of the flag pattern with stops above/below the flag depending on whether its a bull or a bear flag. First TP would be the recent structure level and second TP would be the length of the impulse which led up to the correction.
The disadvantage to using a safe entry is that we require a bigger stop loss which makes the risk:reward ratio not as great as the risk entry. However, the probability of the trade succeeding is higher.
_______________________________________________________________________________
EXAMPLES OF RISK ENTRY
EXAMPLES OF SAFE ENTRY

EDUCATION - Identifying & Trading Flag Patterns In this post, we will be explaining what a flag patterns is and how to identify and trade them.
What is a Flag?
The flag pattern is the most common continuation patterns in technical analysis. It often occurs after a big impulsive move. The impulse move is followed by short bodied candles countertrend to the impulse move, which is called the flag. It is named because of the way it reminds the viewer of a flag on a flagpole.
Often, the breakout of the flag is the same size as the impulse leading to the flag. We can use this to create our take profit levels.
There are 2 types of ways we can trade flag patterns; Risky Entry & Safe Entry. See below for the pros and cons for both and how to enter them
_______________________________________________________________________________
Risk Entry:
The reason why it is called a risk entry is because we haven't got many confirmations apart from the bounce off the fibonacci level. Price may have the potential to go lower for a deeper correction before moving up. Whereas for the safe entry, the confirmation that it is a valid flag would be the break of the flag pattern.
How to trade using Risk Entry:
Wait for price to bounce off the fibonacci levels (0.5 or 0.618) and then enter with stops below/above the correction.
One of the advantages of doing a risk entry is that we can have small stop loss and have a great risk:reward ratio. Also, we can gain an entry at the start of the move and HODL!
Safe Entry:
Safe entry requires more than one confluence and requires confirmation. We have the rejection of the fibonacci level as well as a breakout of the flag, confirming that it is a valid flag pattern.
How to trade using Safe Entry:
For a safe entry, enter upon the break of the flag pattern with stops above/below the flag depending on whether its a bull or a bear flag. First TP would be the recent structure level and second TP would be the length of the impulse which led up to the correction.
The disadvantage to using a safe entry is that we require a bigger stop loss which makes the risk:reward ratio not as great as the risk entry. However, the probability of the trade succeeding is higher.
_______________________________________________________________________________
EXAMPLES OF RISK ENTRY
EXAMPLES OF SAFE ENTRY

DOGECOIN - Major Move Incoming!In our last Dogecoin analysis, we were waiting for price to retrace back to the levels indicated on the chart. Price has slowed down a lot and looking like the correction has almost ended.
For a safe entry, wait for a big bullish candle before entering. This could very well be the start of the next MAJOR move!

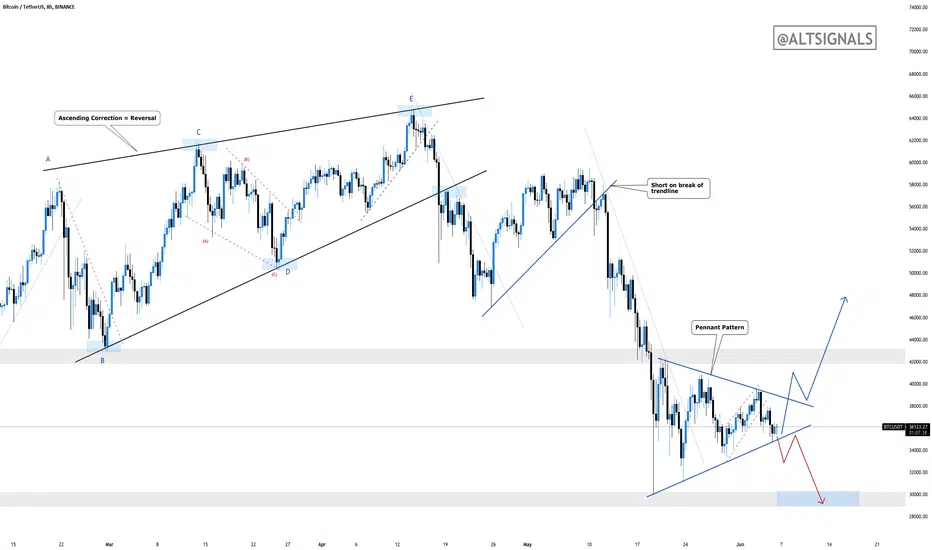
BITCOIN - All Eyes Watching!In our last couple of analysis for Bitcoin, we were waiting for some sort of pattern to develop to tell us what Bitcoin may do next. Right now we can see a pennant pattern which is good news for us. Pennant patterns usually break and retest before going in the breakout direction. Either way, we can make some good money from Bitcoin!
Wait for price to breakout in either direction and enter on the retest.
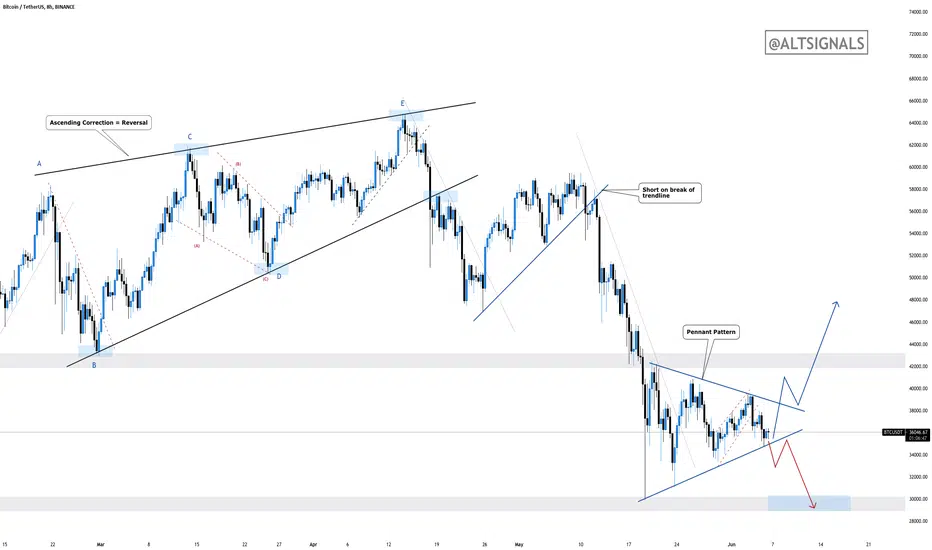
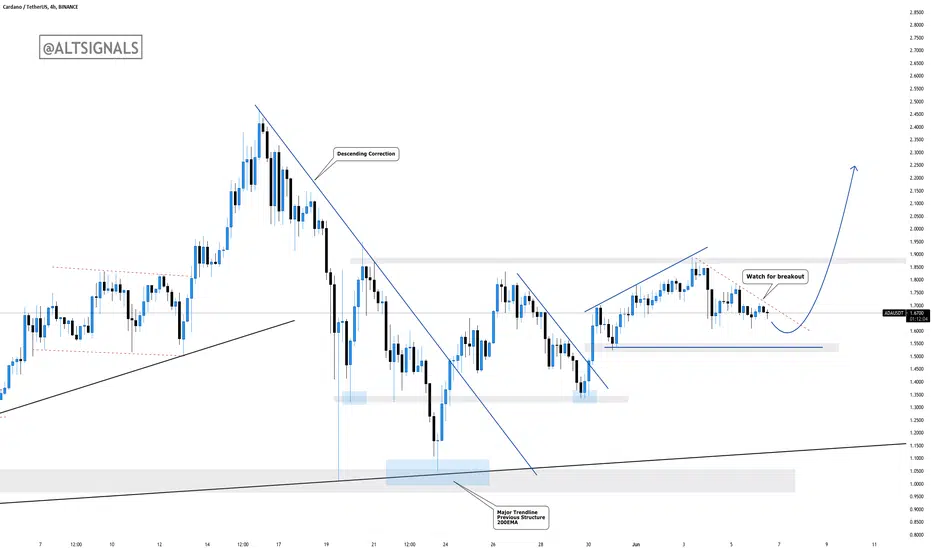
CARDANO - Watch For Breakout!In our last analysis of Cardano, we managed to push up 30% from our entry zone. We marked out the $1.90 zone as a potential area where price would face resistance. Price tested that zone and is creating what looks to be a bullish correction. Price is creating higher highs and higher lows indicating that bullish momentum is kicking in.
Watching closely for price to break out.