#Shorting #SEI #ScalpHello Padawans,
Hope you are doing well.
Planning to take quick scalps around yellow lines with proper risk management.
May the force be with you.
Cheers
Altsignals

SOLOUSDT - UP 86%🥂 Next Target 65cHi Traders, Investors and Speculators of Charts📈📉
SOLOUSDT has since gone up 86% since my last post on it, as seen here:
If you're NOT looking to accumulate and you're swing trading, now is a great time to bag in some profits so cheers to you 🥂💥👍
If you missed out on the SOLO run, here are the other top 9 Altcoins on my watchlist:
_______________________
📢Follow us here on TradingView for daily updates and trade ideas on crypto , stocks and commodities 💎Hit like & Follow 👍
We thank you for your support !
CryptoCheck
POLONIEX:SOLOUSDT CRYPTO:SOLOUSD

PAW/pawchain for now its important for paw to reclaim the old range, if we reclaim it we will propably never see these low prices again

AIDoge : Make Money from MEME's 🤖Hi Traders, Investors and Speculators of Charts📈📉
MEXC:AIDOGEUSDT BITGET:AIDOGEUSDT OKX:AIDOGEUSDT.P
Ev here. Been trading crypto since 2017 and later got into stocks. I have 3 board exams on financial markets and studied economics from a top tier university for a year 🏫
AiDoge is a new crypto project that strives to solve the need for exciting memes that drive engagement. As a result, it offers an AI platform that allows users to buy credits with the native crypto, NYSE:AI , and use them to generate memes. By typing prompts into the system, the AI behind it interprets your request and generates an appropriate meme. With this unique utility fully described in the official whitepaper, AiDoge has effectively combined two popular trends in the crypto world — memes and AI. No other coin has managed to do the same, not even ArbDoge AI, a similarly designed crypto that lacks the utility aspect of AiDoge.
AiDoge wants to create an entire community behind the project, and it aims to achieve this by rewarding both those who stake and vote. Once you buy NYSE:AI tokens, you can stake them to gain daily rewards in the form of the same token. Moreover, you can vote on memes other users have created. In turn, this yields you more tokens and rewards the best meme creators. Other similar projects have also gained popularity and increased in value, including Pepe Coin and Wojak. If you’ve missed these pumps, AiDoge might be the next big thing for you. It certainly has more promise than many other cryptos from the past.
As more people realize its potential, artificial intelligence is expanding . Now, with AiDoge, it has entered the crypto market. AiDoge was built on the Ethereum blockchain as a memecoin. The AI-driven meme creator is set to be widely adopted in advertising and marketing sectors due to its ability to create high-quality memes that are also unique. The thing that could potentially give this coin value is the fact that anyone can use their creativity to create memes and be recognized in the community for their efforts. This means that creating memes will be done in moments and will be displayed publicly. The creators who make the best memes will be rewarded for it. Furthermore, the platform is user-friendly and easy to use, which will be extremely helpful for beginners searching for a meme coin to begin their investing/speculation journey.
_______________________
📢Follow us here on TradingView for daily updates and trade ideas on crypto , stocks and commodities 💎Hit like & Follow 👍
We thank you for your support !
CryptoCheck

📈Ready for altcoins to move up?📉CRYPTOCAP:BTC.D
Hello traders, I hope you have had a profitable week.✋
First, pay attention to the previous analysis of the Bitcoin Dominance Index.👌
The Bitcoin Dominance Index is approaching the important level of 48.48. Despite the possibility of being rejected below this level, if the price of Bitcoin stays at a certain level or grows, the altcoins in the market can experience an upward movement of 20-40%.
Ethereum price targets were identified in a separate analysis.
Please share ideas and leave a comment,
let me know what's your idea.
CrazyS

GMXUSDT -BULLISH Harmonic Bat🦇 +30% TPHi Traders, Investors and Speculators of the Charts 📈📉
Harmonic Bat Patterns or Cypher Patterns are a great way to setup a trade, if you can spot them . They are generally hard to spot, but plotting one out gives you a clear entry, stop loss and three TP (take profit) levels. GMXUSDT is already past the entry and the first TP, but TP 2 and TP 3 are still possible.
Here's a little bit more info on what to look out for on a Harmonic Bat Pattern :
And if you're looking for a quick masterclass on Harmonic Patterns bullish and bearish, find it here :
_______________________
📢Follow us here on TradingView for daily updates and trade ideas on crypto , stocks and commodities 💎Hit like & Follow 👍
We thank you for your support !
CryptoCheck

XRP vs SEC: Latest Update & Price WatchHi Traders, Investors and Speculators of the Charts 📈📉
In a previous post, I discussed the fundamental impact of Harvard declaring that XRP and XLM will be the future of payments (yes, this really happened) :
The latest update in terms of the SEC case against Ripple, is potential Ripple win against the SEC after the attorney said the SEC has admitted that Ripple is a software code. Forbes columnist who’s diligently tracking the Ripple/SEC case has requested access to the Hinman speech as she believes it to be game-changing for the entire crypto industry. An XRP enthusiast noted that Ripple’s sale of XRP since 2019 has only been for ODL transactions, thus, they won’t constitute for being a security. As per the latest development, Forbes journalist Dr. Roslyn Layton has filed a motion for intervening and seeking to access the document of Hinman’s speech from the court.
Although assets like Ethereum (ETH) have stayed outside the SEC jurisdiction, Ripple is facing a billion-dollar fine. “That inconsistency has given rise to grave concerns about potential conflicts of interest, because Hinman had a financial stake in promoting Ethereum to the exclusion of competing coins like XRP,” she added. Ripple has been arguing that the former SEC chief Hinman said in 2018 that Ethereum isn’t a security. Thus, the same rules should be applicable to Ripple, argues the blockchain startup. While speaking at the WEF 2023 summit earlier this year, Ripple CEO Brad Garlinghouse said:
When those come to light, I think you’ll see more how it is possible that the SEC decided to bring a case against Ripple, given what they were saying within their own walls.
When I had to decide how I will label this post (bullish or bearish), I pulled up my favorite technical indicator: The Phoenix Ascending. This indicator contains the RSI, EMA, LSMA and momentum. From the FA, we can see that the short term buying pressure has picked up, therefore I expect more upwards price action for the short term:
Remember the saying; buy the rumor and sell the news. I believe this is what's happening now on the charts, considering the positive outcome of the last hearing. Ultimately, I remain a believer and I am still fundamentally bullish on XRP for the future.
Interested in more altcoins with good trade setups? Checkout this idea:
_______________________
📢Follow us here on TradingView for daily updates and trade ideas on crypto , stocks and commodities 💎Hit like & Follow 👍
We thank you for your support !
CryptoCheck

hathor $htr #buyspotandchill playi've risked ~3% on this one, love it fundamentally. it's risky because i think the narrative will be surrounding interchain and L2s in the alt space. if there is another wave of interest in L1 novel tech this will do numbers. nice execution of consensus based around DAG and Merge mining bitcoin. DYOR if you want to play it long on high time frame, IMO its comfy, if you think the bottom is in for btc it won't be going much near $0.04 again. if you are a lower time frame trader looking for alt's that follow bitcoin moves this is a great one to have on your watch list, always pumps with the corn.

CVXUSDT : Cup & Handle Pattern Can X4Hi Traders, Investors and Speculators of the Charts 📈📉
CVXUSDT is another altcoin with massive upside potential. Infact, after consolidating for such an extended period, a parabolic move to the upside is very possible.
In the chart, I've pointed out 3 take profit zones based on candle wicks (supply zone and demand zone) , but you can always add more TP points depending on your trading strategy and your patience. The 0.618 Fibonacci Retracement is always a very likely target during any bull market, therefore that would be my ultimate target for this season.
I'm not using any technical indicators today, as I am doing a longer term outlook on CVX. I believe there is an important balance between trend line analysis / chart analysis / chart patterns , and technical indicator analysis. I find that trend analysis ( trend lines , Fibonacci Retracement , patterns , support zone and resistance zone ) is really helpful for longer term, whilst technical indicators can be very useful for the shorter term.
Here's my bullish outlook on Bitcoin 👀
_______________________
📢Follow us here on TradingView for daily updates and trade ideas on crypto , stocks and commodities 💎Hit like & Follow 👍
We thank you for your support !
CryptoCheck

Cross-breeding of systems. BTC D for example.Experimental review.
Hi.
There is a lot of debate going on on bitcoin dominance right now and I thought I wanted to get the most out of this picture.
I came up with the idea to take the weekly Renko chart for parsing and leave almost all my usual indicators except EMA (it is not needed here).
And VFI LF is also unnecessary.
So what do we observe, besides a clearly visible very strong support around 39.8%?
We have a fresh green cube with a pin bar.
1. Funny, the Renko cube went exactly where the clouds change was last time!
2. Next, Renko's cube climbs Kijun-Sen line for the third time. Believe me, not for it to serve as resistance anymore. Only as support. All tests passed. Chikou span (light green lag line) is looking up. Also a good sign.
3. What about the exact same exit upwards? On the edge of the clouds? Hypothesis! But let's note. That perhaps BTC D is flying upwards to a certain "cloud exchange" point. That's around April 1.
4. Devil, but that looks like a bull flag on a stochastic.
5. SQZMOM is heading steadily to the bullish side I'd say a minimum of three weeks, a month max we need before the first green bar.
As this is an experimental approach, there will be neither a "long" nor a "short" mark.
Let's see together if this kind of reasoning works?
Does reliability improve by combining Renko and Ichimoku?
We'll review this chart in second half of the spring 2023.
OK? Are you interested in this?
Thank you for your attention!

ALTCOIN Market still consolidating. This shows its huge upside.The Altcoin market (total market capitalization excluding Bitcoin) is basically still consolidating. The long-term pattern is a Channel that is best described when using the Fibonacci Channel levels. Right now the price is on its bottom, with the 1W LMACD turning bullish since the August Bullish Cross.
The only times in the market's history this happened below the 0.00 mark designated the bottoms of December 2018 and May 2015. As you see on the chart, on all occasions (including today), the US10Y had already peaked and was on a downtrend. This suggests that the market has entered a strong Accumulation Phase, with long-term investors stacking ahead of the new Bull Cycle. This historically is the best time to enter the market.
-------------------------------------------------------------------------------
** Please LIKE 👍, FOLLOW ✅, SHARE 🙌 and COMMENT ✍ if you enjoy this idea! Also share your ideas and charts in the comments section below! **
-------------------------------------------------------------------------------
💸💸💸💸💸💸
👇 👇 👇 👇 👇 👇

BTCDBeen a while since I updated BTCD here on Trading View, 2020-2021 was my BTCD year where most of my analysis hit the targets.
Reviewing this monthly chart we can see the Stoch RSI is bouncing off the 1/2 way level between overbought/sold.
The diagonal has likely completed Wave 4 and W5 should hit that top expanding TL and likely overthrow , so we can assume 49-52% for now to finish the 5th.
And what this analysis means is only 2 possible scenarios:
1) BTC & BTC coins (BCH,ADA,DASH,XRP,LTC to name a few) will all get big moves up after BTC leads. Then once the final drop hits ETH and the rest of the alts will pump.
2) BTC will Nuke to my $10-$12K targets which isn't to far away from the recent ATL around $15K. But Altcoins will drop another 50-70% from these levels.
TBH I favor option 2.
ETH is still not below June 2022 levels $900 while many alts have already broken below June lows and most seem to be headed back down as we speak.

Dodge falling wedgeaccumalating doge down here
in a falling wedge pattern and if we break up could see a nice move up

AAVE looking greataccumalating aave at the levels could see a nice 5x easy
as soon as we break the downtrend and break this falling wedge could see a nice move up

1inch looking goodaccumalating 1inch at these levels
great level to accumulate
could see a big move when we break the downtrend


HT winding up for a move!huobi token is looking good here to make a move to the upside here here if we can break the down trend

Lina updatefollowing up on my last chart on lina, hopefully you got in on the bottom with me and can take profits now at our first target


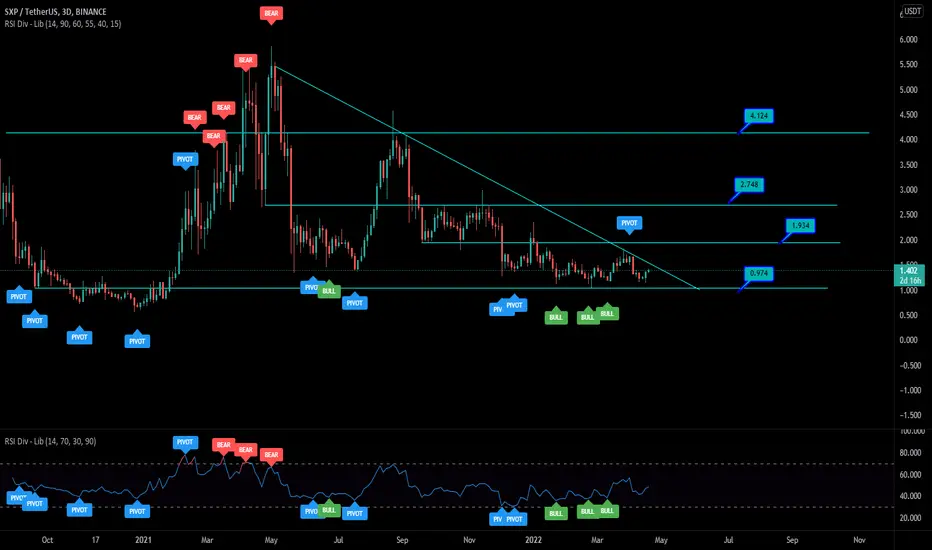
sxp looking good heresxp close to breaking the down trend here
if we break the down trend could see a nice move up
ive been accumalating at the bottom and hope u got in on my last chart and can enjoy the ride
link looking goodlink looking good to accumulate down here
if we can break the down trend we might see a nice move up

Eos 4 year accumulationeos has been in a 4 year accumulation period
could see a massive move come if we break the down trend and get out of the accumulation zone

hot looking greathot is looking good to accumulate down here
could see a big move soon if we break this down trend
