Commodities ALUMINIUM Short Trade Thirty Minutes Time Frame30MTF
Short
Indicatrors: Bollinger bands , 200EMA , RSI
Bollinger bands 20Moving average rejection
Price closed below 200EMA
RSI Below 40
Dear traders, I have identified chart levels based on my analysis, major support & resistance levels.
Information shared by me here for educational purpose only. Please don’t trust me or anyone for trading/investment
purpose as it may lead to financial losses. Focus on learning, how to fish, trust on your own trading skills and please do consult your
financial advisor before trading.
Please do review, analyse and share your comments as well. Let us work and win together. Wish you a very happy, healthy & profitable trading day ahead!
Disclaimer: I have analysed the data based on my limited knowledge.
Aluminium

Zinc and aluminium supply tightening amid energy price shockMore and more metal smelters are falling victim to the European energy crisis. Last week, Nyrstar, a large European zinc smelter, announced it would shutter production at its Dutch Budel facility from 1 September 2022 and Norsk Hydro, a significant aluminium producer in Norway, said it will close its Slovakian smelter around the same time.
Aluminium is one of the most energy intense metals to produce, leaving the metal very sensitive to soaring energy prices. Drought in parts of China is also reducing the availability of hydropower. Energy rationing in China resulting from this is likely to see a decline in aluminium production from the largest producing country.
In July, the European Union agreed that it would ration natural gas by 15% until spring 2023. That will mean the Union will have to depend on other forms of energy or cut back on economic production.
The production halts are likely to deepen recession risks in Europe. However, if demand for these metals does not fall as quickly as the supply is contracting, we may find base metals markets significantly tighten.
Inventory in decline
Supply of both zinc and aluminium is already looking tight. London Metal Exchange (LME) inventory of zinc has pared back to pre-covid levels and sits at only 6% of the level seen at the peak in 2012. You would have to go back to the 1990s to see LME inventory of aluminium as low as it is today.
Underappreciated story
While zinc prices popped higher on the day Nyrstar announced its closure, the metal's tightness appears to be an underappreciated story. Net speculative positioning in zinc futures is at the lowest it has been since 2018 and more than 1.5 standard deviations below the 4-year average. Positioning in aluminium is also below average but not as extreme.
Energy transition to boost demand for both metals
Both metals are essential for the energy transition that is required to meet global climate goals. Aluminium is needed to lighten vehicles to reduce their energy needs and is a key element in electrical infrastructure, solar panels and wind turbines. Zinc coatings protect solar panels and wind turbines and prevent rust. A 10MWh offshore wind turbine requires 4 tonnes of zinc, while a 100MWh solar panel park—enough to supply 110,000 homes—requires 240 tonnes of zinc1.
The EU is focused on energy security today as it tries to wean off Russian energy dependency. It will be pushing the energy transition harder as a result.
Zinc backwardation underscores tightness
Zinc is also one of the most backwardated base metals2. Backwardation is when front-month delivery futures prices are higher than the second or third-month delivery prices. That is also an indication of market tightness, i.e. that people are willing to pay more for immediate delivery rather than wait a couple of months, indicating they need the metal soon and it is in high demand. Investors in rolling futures strategies tend to benefit from markets in backwardation: as the futures approach spot prices as time passes, the price should rise (assuming the curve shape remains the same).
Conclusion
The energy crisis in Europe and elsewhere is driving supply challenges in the base metals market. There have been notable smelters shuttered in zinc and aluminium. Zinc stands out as a metal with low speculative length, indicating an underappreciated story.
Sources
1 Word Economic Forum
2 See Commodity Monthly Monitor, July 2022
This material is prepared by WisdomTree and its affiliates and is not intended to be relied upon as a forecast, research or investment advice, and is not a recommendation, offer or solicitation to buy or sell any securities or to adopt any investment strategy. The opinions expressed are as of the date of production and may change as subsequent conditions vary. The information and opinions contained in this material are derived from proprietary and non-proprietary sources. As such, no warranty of accuracy or reliability is given and no responsibility arising in any other way for errors and omissions (including responsibility to any person by reason of negligence) is accepted by WisdomTree, nor any affiliate, nor any of their officers, employees or agents. Reliance upon information in this material is at the sole discretion of the reader. Past performance is not a reliable indicator of future performance.

ALUMINIUM FUTURES (ALUMINIUM1!), H1 Potential for Bearish DropType : Bearish Drop
Resistance : 224.00
Pivot: 217.75
Support : 208.80
Preferred Case: On the H1, price is moving below the ichimoku cloud and along the descending trendline which supports our bearish bias that price will rise and drop from our pivot at 217.75 in line with the overlap resistance, 23.6% fibonacci retracement, 78.6% fibonacci projection and 50% fibonacci retracement to the 1st support at 208.80 in line with the -27.2% fibonacci expansion and 78.6% fibonacci projection.
Alternative scenario: Alternatively, price may break through pivot structure and rise to the 1st resistance level at 224.00 in line with the swing high resistance and 38.2% fibonacci retracement.
Fundamentals: As aluminum supply is being squeezed by soaring demand, we have a bullish view on aluminum.

$S32 Very nice breakout (aluminium / coal / nickel / zinc)S32 commodities
Alumina
Aluminium
Bauxite
Metallurgical Coal
Lead
Nickel
Manganese
Silver
Zinc

Metals Continue to Outperform MarketsThe energy crisis continues to provide a strong support, not only for crude prices, but also for industrial metals. Last week aluminium added 9.2% and copper prices gained 9.17%. The absolute leader was zinc that jumped 20.49% in price.
The price of aluminium, which is one of the most energy-intensive commodities, is at a record high. On Monday morning its price peaked at $3288.75 per metric ton, that is 17.56% above 2008 record highs. I suggest the upside movement will continue and we may soon have prices close to $3500 per ton.Copper has exceeded $10,300 per ton while spot contracts are traded with highest premium over futures.
Copper stocks on the London Metal Exchange fell to the lows of 1974 this October. Goldman Sachs analysts suggest that copper stocks may run short by the second quarter of 2022.
Copper prices this May rose above $10,746 per ton. The excitement in the commodities market may push prices towards new records. The technical picture highlights the possibility of copper prices soaring to $11,800-12,000 if it passes the May high.
The price chart of Zinc, the third most popular non-ferrous metal in the world, points to another spin of the rally as its prices rose to $3830 per ton. Belgium Nyrstar N.V., a leading manufacturer of zinc, has reduced its zinc output by up to half at its plants in Budel, the Netherlands, Balen in Belgium and Auby in France since October 13 due to a significant rise in electricity prices.
Some Chinese steelworks forcedly cut production of zinc due to a shortage of electric energy that was caused by record coal prices. No wonder zinc prices will rose to $4300-4500 per ton. Although the international Lead and Zinc Study Group (ILZSG) said that zinc will see a surplus of 217,000 tonnes in 2022.
The energy crisis did not only impact Europe, but China reversed its activity in production and joined green economy acolytes. The Chinese industrial sector is still suffering from energy shortage caused by a lack of coal and environmental requirements to steelworks. All this mean that we could hardly expect any change to the existing upward trend in the near future.

Profit From Aluminium Price Surge. Low EV/EBITDA combined with high demand for light metals (lightweight electric cars, bicycles, scooters etc.), raging inflation, and an all-time low gives this stock a good chance.
I've been in since $14 and didn't expect it to move so quickly. It's a good opportunity to put some money. Don't go all in, at the end it's a lightly sketchy Chinese stock.
But if you are into the metals industry, allocating 2-5% of your portfolio seems like a safe move for this one.

just an ideafind it interesting, this is the sum of all commodities divided by the money supply.
probably doesn't mean anything, anyway interesting.
Looking at the parabolic route of m2 and the commodities basket divided by it didn't move as expected because of it's rally the rally. lot's of money still in the markets.
give me your perspective and ideas


Industrial metals are set to witness an upcoming rally
Industrial metals are set to witness an upcoming rally after Joe Biden's $6T budget proposal, The spending plans would fund investments roads, water pipes, broadband internet, electric vehicle charging stations and advanced manufacturing research.
CENX is an industrial metal stock that's being traded within a descending channel on the 4hr time frame since March 12.
Momentum and strength indicators are supporting that the stock would move upward to hit $14.65 and $16.25 levels consequitvely on the short term.
Century Aluminum shares CENX rose 7.62% in yesterday's trading in a strong session for metals.

P.A. RESOURCES P.A. Resources Berhad, an investment holding company, is engaged in the manufacture and sale of aluminum products primarily in Malaysia. Aluminium is one of the huge demand products in future for the E.V. car.
From the chart we have found that price are making higher low and sit on SBR at 0.490 - 0.515 zone area. If break 0.560 can going further to north and again will make it all time high price above 0.600.

An Idea in Havells is to have a short term bearish gain.The price seems to move in a range bound fashion for few days and a strong reaction on a parallel channel is a possibility where this shared idea realizes

ABC Correction started for the EWT on AluminiumMCX Aluminium has started falling due to Elliott Wave's ABC correction. Expected A is at 100% or 161% retracement of wave 5.
Therefore, it can start rising from here to the level of 164.4 . The day traders can have the advantage of this impulsive ride of B .
According to ABC correction, we may see the Aluminium prices below 161.6 - 159.4 before the weekend.

MCX Aluminium Intraday Tips For TodayAccording to this chart, aluminium is moving flat under the rectangle pattern. The top of this rectangle is the resistance , and the bottom of this rectangle is the support . The trend is making frequent parallel channels between the support and resistance of this rectangle.
At present, aluminium is playing into support trendline (B) . There is a crucial support. Fakeout, volume spike, tail, massive buying pressure, and S-RSI crossover is made in that area.
So, break out of the crucial support means downfall for the levels of 143.6 - 142.6 .
...but aluminium will try to climb because of 50 & 10 MA crossover. Therefore we may see prices at 146.6 - 147.4 - 148+ soon.

HWM MA MACD Histogram just turned positiveThis is a Bullish indicator signaling HWM's price could rise from here. Traders may explore going long the stock or buying call options. I identified 47 similar cases where HWM's MACD histogram became positive, and 40 of them led to successful outcomes. Odds of Success: 85%.

AA ascending triangle + moving average crossingAA is making a short-term ascending triangle since 8 days, that should break in 2 or 3 days, combined with a crossing of the weighted moving averages of 5 and 25 days. The corresponding MACD also indicates a buy signal. Those 3 indications are a good buy for a 2 or 3 weeks planned bullish move. The move should stop at or a little bit above 23$, which is the resistance since many months. However, be careful about keeping your position or selling it before the earnings report of January 15th.

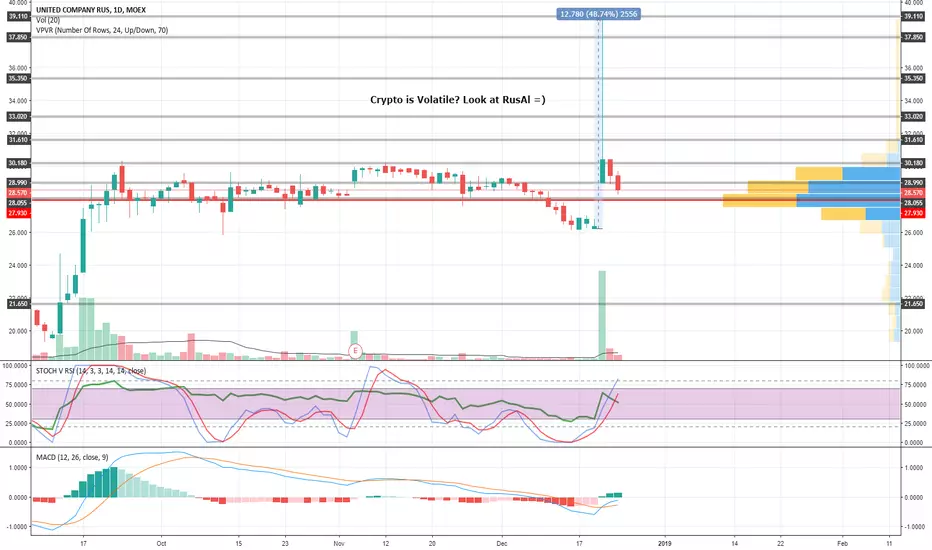
RusAL not Rus anymoreSomeone already made good profit on inside information. But there should be more. Will test support at ~28.35 once again and grow up. In couple of years I would start fixing profits around 58 and 65.
Green light to go long on copper?Copper has had a rough time over the past five or so years and is still at a pretty low price when compared to other base metals.
Lead, zinc, tin and aluminium have more or less been rallying since mid-2015, so just copper and nickel that have fallen behind.
Time for a quick burst of action upwards here- I have gone long with a small stake and fairly tight stop. First target shown at which point I will re-assess the trade.
