Amazon - Greed, Just Like Speed, KillsFirst, I understand that Amazon had an excellent earnings report, whether analyst estimates were gamed to the downside and it was easy to beat notwithstanding.
What you have to be really careful of right now is the excess greed that abounds in the markets. Greed is the thing that kills accounts the fastest, and when you blow your account, there won't be any use for TradingView anymore, and nobody will be able to have fun until you can save up to reload.
I am not saying any kind of bearish commentary on Amazon, although you should have reservations on this company because a lot of its business model is just to serve as an export faucet for stuff made in the Chinese Communist Party's land.
And you have to be careful with anyone whose business is tightly knit to communist China, because the International Rules Based Order is chattering disaster about "de-risking" from China.
Because the narrative about "Taiwan Invasion" really means that the CCP is close to falling and everyone is thinking about how to take control of that country.
But to take control of China, you need someone Chinese, which means you need a handpicked appointment from the Republic of China who will serve the globalists.
All this, and the 24th year of persecution against Falun Dafa by the CCP's Jiang Zemin faction just completed on July 20. In 1999, Jiang began a full genocide and organ harvesting campaign against 100 million spiritual believers, and it's persisted to this day despite Xi Jinping never participating.
In fact, Xi's Anti-corruption Campaign has been hitting the corrupt officials involved in the persecution ever since he took power in 2012.
Consider that the next time you see the media going off about what a Mao Zedong Xi Jinping is.
Amazon's monthly provides some clarity. The most notable thing is that the 2021-2022 distribution bars during the rest of the market's bull run indicates a proper and clear topping pattern.
And despite that, price never took out the most critical of lows, the COVID pivot at $81.30.
Instead, it spared it by 13 cents. Because numerology.
What it means is that long term, $80 becomes a target.
What's notable about price action before today's earnings report pump is that Amazon maintained the July low, albeit barely.
And this creates three weekly lows of equal "support."
Which also becomes a target.
Bear in mind, with Nonfarm Payrolls also being tomorrow morning, you may get yourself a trade setup that looks something like what happened to AMD on Wednesday:
AMD - Greed Doth Bad Habits Breed
When its ER came in hot in premarket and at open, and turned into a huge sell off and red day:
So the point with this call is to say that the August '22 $146 pivot may really hold. And if it doesn't hold, it might just get raided.
Which makes buying the top tomorrow morning something that isn't a particularly intelligent thing to do.
Worse, it means that buying the dip may be trading in the wrong direction, while selling the dump's retrace might actually be an optimal short entry.
Just keep in mind that we may have as much as another 2-3% of downside left in the SPX before we retrade towards/take out the tops:
SPX - The Sound of a Shattering Iceberg
If the markets really get blown to pieces heading into the end of Q3 in accordance with the JP Morgan collar, stuff like Amazon is going to head to a 5-handle by next year.
SPX/ES - An Analysis Of The 'JPM Collar'
You'll know the truth, in my opinion, when Amazon breaks the $125 flat bottoms, price won't come back, just like what happened with Netflix:
Netflix - I Hope You Like Catching Knives
What I really want to tell you all is that life still seems stable, it seems like all there is to worry about is making money and entertainment. But our world may very well change overnight, with no warning at all.
And what we've all done while the cards were still face down will be what determines who wins the pot and who loses their stack.
Amazon

AmazonEnjoyed the NASDAQ:AMZN ride from $107 to the current level. Now looking forward to the next move, an ideal move is a close above $144. We always root for the upside.

AMZN: Bearish Bat: Anticpating Potential PPO ConfirmationAmazon has gapped up to complete an 88.6% retrace thus completing the BAMM. Now we can see that the PPO is trading outside the upper bounds, and once the PPO comes back down below the upper bounds, it will confirm a Bearish PPO signal at the PCZ of this Bearish Bat, therefore confirming the Bearish Entry. I think it will target $81 from there on, but it could go lower if it ends up being a continuation of a much more bearish ABCD Pattern from years ago.
I think this rally was stirred on by the positive earnings release, but failed to realize how unprepared the guidance was during the actual call, as they hardly provided any guidance for Q3 all they could provide was their hopes but not much beyond that.

$AMZN Reported Positive EarningsNASDAQ:AMZN Reported Positive Earnings, forming a cup & handle on the weekly chart, if Amazon closes above 136 and consolidates in a bullish manner it will form the handle. We are bullish and we continue to see amazon stock moving higher.

CON ED 95 TAKE PROFITS AND RUN !!!Con Edison Earnings Today After the Close , Summer is Here !!!
95 TP do not be Greedy
TAKE PROFITS AND RUN
Market is very Weird these Times !!! NYSE:ED

Meta - To Long, Or To Short?I have to say that Meta is one of the hardest charts that exist to read right now, mostly because for 9 straight months, an unprecedented feat in the history of Facebook, it has gone up in a straight line, and bigly.
You only see it clearly on the monthly:
And yet the problem with the bull thesis for a new all time high is the '22 bear raid took out all the sell side all of the way back to 2016.
Although you can have, and speculators and hodlers have been fortunate enough to have had, a significant retrace afterwards, stocks taking long term lows is usually kind of like when a person turns 50 and starts urinating blood.
It means something is wrong with an organ and the time they have left to live is not so long and not so bright.
Even the weekly is insanely one-directional
This stock will have attention tomorrow as post-market earnings have produced another $20 gain, but notably, as of time of writing, have brought the price only to $319, still underneath the July high.
Geopolitical risks abound in the markets right now. Much is happening with Mainland China and the International Rules Based Order. You can consult my previous calls, which are below, for my thoughts on the situation.
But the Cliff's Notes of it is that the 24-year persecution and organ harvesting genocide of Falun Gong by the Jiang Zemin faction and the CCP may soon be made public worldwide if President Xi weaponizes those sins to protect China, its 5,000-year-old culture, and himself from the IRBO intending a Maidan Revolution-style coup to replace him with someone from Taiwan that happens to be a fine lapdog to the global regime's interests.
What is the bull thesis for Meta? Facebook is something of a panopticon data collection system and advertising network rolled into the guise of a social media platform where people voluntarily disclose their location, interests, likes, connections, and spend time interacting with friends and family.
Meta's rebrand is to force the world into something of a Nintendo 64-level version of Second Life, where you're supposed to literally sit in your cube eating the cricket crackers under a bunch of blankets with the furnace/AC off with the VR headset strapped to your face while you do data entry all day.
It's really the kind of dystopian thing the Chinese Communist Party really likes, because it means you can be submissive and agreeable slaves that don't threaten its stability and still produce work.
If mankind's future is truly to return to tradition (it is), what place does Meta have in it?
Meta has very little place in the future, and that's a fundamental problem, really, for everything that revolves around people living chained to computers and phones.
A really notable thing is that the Chinese Government, especially under Xi Jinping since he took power in 2013, has not allowed Meta/Facebook to set up shop inside Mainland China.
The world's most notorious totalitarian regime and the creator of social credit and censorship does not want Meta/Facebook's influence impacting their citizens.
Ain't that something. And yet, you're supposed to be bullish on this... because it's going up.
You just want something to go up so you can buy it and feel pleased when you see green, not sell, and then feel sad when you see red, red, red, and are liquidated.
This is modern humanity.
So here's the question with Meta: is it a short, or is it a long?
The truth is that with Meta, it's gone up in the kind of straight line that makes Apple blush for 9 straight months.
When something trades like this, you can never say "it's a short."
Instead, you can watch for when it does become a short.
And we're in the zone. Although the biggest gap has been filled, the monthly candles show that the bodies of the winning streak's candles are still respecting the range created by the February of 2022 doom candle that ended the Party.
On the daily, the last five days of price action, which correspond with a Nasdaq that may very well have topped but an SPX that does not seem to have topped yet, are the most bearish they have been during the entire bull run.
And so, if you want to get long on open, I can only encourage you to exercise caution. You may really have upside as high as $343. But you may also have upside no higher than $325.
It may also gap up on market open and then sell off, and that kind of a sell off at this kind of a time may mean you are trapped.
To confirm a bull thesis, $343 needs to be broken and maintained
To confirm a bear thesis, the first thing we need to see after the earnings manipulation is for the $288.30 double bottom to be broken.
From there, if $258.88 is broken, the trend is over and will have reversed, even though you may see further upside in the interim.
A break over $325 and then a rejection under $288 would be the most bearish. If that unfolds, it's no longer a dip to buy. Instead, long term puts while the VIX is so suppressed might really be really, really valuable.
And the problem for both bears and bulls is the $40 range that "confirms" whether there's forever uppy or forever doom.

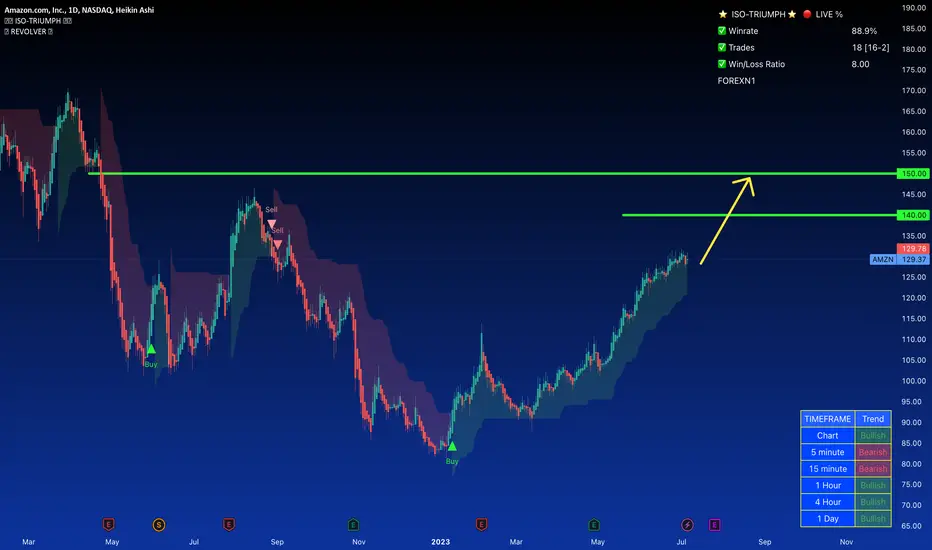
AMAZON Short-term buy signalIt's been exactly two months (May 30) since we gave the latest buy signal on Amazon (AMZN) when the price touched the 0.382 Fibonacci retracement level (see chart below):
Our target was set at 146.50, which is the High of August 16 2022 (Resistance 1) and we are updating our analysis as the recent rebound on the 1D MA50 (blue trend-line), seems to be the final bullish leg towards that target.
We may experience a strong pull-back (long-term trend still bullish though) there (also the 0.618 Fibonacci level is just above it) as the 1D RSI is trading within a Channel Down, which illustrates a Bearish Divergence.
-------------------------------------------------------------------------------
** Please LIKE 👍, FOLLOW ✅, SHARE 🙌 and COMMENT ✍ if you enjoy this idea! Also share your ideas and charts in the comments section below! **
-------------------------------------------------------------------------------
💸💸💸💸💸💸
👇 👇 👇 👇 👇 👇

AMAZONThese are levels that I'll be keeping an eye on when dealing with AMZN, and I'll revise as price action progresses.
I adapt to the change in money flow.
Fundamentals: "Monday marked the first trading day following Amazon’s (AMZN) 20-for-1 stock split that the company announced on March 9. Amazon shares were revalued to $120 per share, after trading well above $2000 per share prior to the stock split."
I'm projecting price to get around the $60 price point sometime in the near future.

Amazon (AMZN) Breaking the RED line and 100$ wall was a big short signal and now we heading to another big support level which is 80$
Wall Street equities were in the red on Monday with Nasdaq leading declines as investors worried the Federal Reserve's monetary policy tightening campaign could push the U.S. economy into a recession.
while Amazon workers will go on formal strike for the first time in the UK, The three major U.S. stock indexes were on track for the fourth straight day of declines since Wednesday, Fed Chair Jerome Powell took a more hawkish tone than expected when the central bank raised interest rates. Powell promised further increases even as weak data showed signs of a weakening economy.
The S&P 500, the Dow Industrials and the Nasdaq have sold off sharply for December, on track their biggest annual declines since the 2008 financial crisis.
Im not close my shorts till we back to 70$ level
are you READY for 2023?

Amazon Long Eearnings 52 Week High hit New 52-week highs this week, powered by the Dow which, on Friday, extended its streak of positive days to ten — something the blue chip index has not done in almost six years. The Dow has been powered by, among other things, a slew of corporate financial results, particularly from the banks, which showed not only improved profitability, but also strong guidance for the next quarter and full year.
I have explained 2 bullish scenarios,1 bearish(worse case).
Bullish:
higher highs higher lows
poc uprising
volume increasing
capital flow rising
In case the Take profits hit, and we have increased volume, I will ride the trend.
I will only take profit 10% of the amazon portfolio and let the profit run.
Exit :Stop loss or trend change signal

AMAZON Bearish Breakout! Sell!
Hello,Traders!
AMAZON was trading in an
Uptrend but now we are
Seeing a bearish breakout
From the opening wedge
Pattern which makes me
Bearish biased and I think
That we will see a move down
Sell!
Like, comment and subscribe to help us grow!
Check out other forecasts below too!

Amazon is in a long short race!Amazon is in a long short race!
This chart shows the weekly candle chart of Amazon stocks over the past two years. The top to bottom golden section of July 2021 is superimposed in the figure. As shown in the figure, the low point of Amazon stock in early January 2023 hit the 2.000 level of the golden section in the figure, and is now in the second largest wave of rebound, breaking through the 1.000 level of the golden section! The next strong pressure level for Amazon stocks is at 0.618 on the golden section in the graph!

AMAZON: Is starting the new buy wave to 144.50.Amazon is trading inside a Channel Up for the last 2 months on balanced bullish technicals on the 1D timeframe (RSI = 65.517, MACD = 3.080, ADX = 16.131). Yesterday's low and reversal into today's strong 1D candle, looks like the start of the 2nd wave of buying inside the Channel.
As long as S1 holds, we are buying with a target just under R1 (TP = 144.50). If the S1 breaks (candle closing under it), we will take a quick sell targeting the 1D MA50 (TP = 127.00).
Important observation: The 1D RSI is inside a Channel Down, hence a bearish divergence to the price's Channel Up. If it crosses above it, buying is favored. Otherwise, it should cause a bearish reversal sometime soon.
## If you like our free content follow our profile to get more daily ideas. ##
## Comments and likes are greatly appreciated. ##

Sector Review: XLV XLY XLPDiscussing a potential capital rotation trade.
We analyze Tesla, Amazon, Pfizer, Moderna, Hershey, and others to get a sense of what is going on.

Amazon in dangerous territory here. Brown trendline represents the head and shoulder neckline. Yellow neckline is the rimline of an inverted cup and handle. Both essentially have the same breakdown target. Price needs to get above these trendlines soon to avoid triggering the breakdown.

SPX/ES - An Analysis Of The 'JPM Collar'Over the last two quarters, financial social media has cared a lot about the "JPM Collar," a series of very large options trades that JP Morgan uses in one of the funds it offers its clients.
The theory for speculators is that the JPM collar will be used to constrict the market within a certain range. But as for how that plays out, it's hard for a trader to anticipate, especially amid the daily chop.
The levels are on the chart and you can reference them yourself. Below is a print of monthly bars, which is easier to see since I have to compress the TradingView chart to make the bars work:
If you're not familiar options, the general idea is this:
These options blocks expire September 29
JPM will lose a lot of money if price is over 4,665 or starts to approach 4,665, especially if it happens right away
JPM will lose a lot of money if price goes under 3,550, especially if it happens right away
JPM will lose a lot of money if price goes under 4,215, especially if it happens right away
But a nuance of being long 4,215 calls is that if price is significantly over 4,215 by September, they will make a lot of money on their calls.
Geopolitical Risks
Before we begin, I'll warn you, as I do in every post, that the geopolitical situation is tense. NATO is at war with the Russian Federation inside of Ukraine and the International Rules Based Order is always talking about "de-risking, but not decoupling" from Mainland China under President Xi Jinping.
The risk for markets is, short of a situation where a tectonic/geothermal event surprises everyone and causes the crash of crashes, is that Xi gets up one night and throws away the Chinese Communist Party.
Since Beijing business hours are New York night, you'll wake up to quite the gap down that will be hard to recover from, for the Chinese Communist Party and former Chairman Jiang Zemin and its cronies are guilty of the 24-year-long persecution and genocide against Falun Dafa's 100 million practitioners.
The Call
The most most notable thing about price action is as June closed, range equilibrium between the June high and the October low is exactly 4,000.00 points.
Something else I stumbled upon when preparing for this post is that when comparing the Dow, Nasdaq, and SPX futures monthly bars, the three have completely converged.
This is the first time since the **2022 top** that this has happened.
You can see it on the weekly as well
There used to be quite the delta, which allowed for stock picking and trading. If you ask me, what three memelines coming together all at once means is that the markets reached peak overbought, and genuine "overbought" isn't something you can see with an indicator.
The daily shows this really only manifested in June.
There are some problems with more uppy, as I explain in my calls below on the VIX, which needs to go up so that whales can go back to collecting free money selling volatility:
VIX - The 72-Handle Prelude
(But note that under the current conditions being summer and we're not that bearish right now, we may only see VIX 50)
And the fact that the Nasdaq is just so far away from its trendline that going more parabolic is hard to believe.
Nasdaq NQ - A Fundamental and Technical Warning Signal
I don't normally call exact areas, but I put a white box with a dolphin because I think price is going there, and will do so fast, like, mid-August fast.
That box means 3,778~.
This means JPM will be green on out of the money calls, red on its own calls, and red on the 3,550 puts.
But JPM doesn't lose money to begin with because they're hedged and will be compensating for the drawdown in other ways, like the alpha they'll generate from going big block long in the dumps under 4,000.
The other advantage is it will trap bears who think it's finally the apocalypse they've long been awaiting for the ponzi to go to zero, and they'll buy puts and buy puts even though the iVol is insane from VIX being over 50.
Once the craziness is done, the markets will recover, and whoever sold will probably by trapped.
So, be careful out there. Wall Street's best laid plans can be blown to pieces in an hour by Heaven, for men are no better than mice in this boundless Cosmos.

Shorting AmazonShorting here small size just cause the charts confluence is too much. My other shorts will yield much more % if I am right but cant not trade this chart. Not advise.

Daily Market Analysis - WEDNESDAY JULY 12, 2023Greetings, traders! Welcome back to our daily Market Analysis. Today, we have gathered the top news and interesting fundamental analysis for your consideration. Let's dive in and stay informed!
Key events:
New Zealand - RBNZ Interest Rate Decision
USA - Core CPI (MoM) (Jun)
USA - CPI (YoY) (Jun)
USA - CPI (MoM) (Jun)
Canada - BoC Interest Rate Decision
USA - Crude Oil Inventories
The energy and large technology sectors were the primary contributors to Tuesday's gains in the stock market, while investors awaited the forthcoming inflation reports with bated breath. The rise in value of the Dow Jones Industrial Average was 317 points, or 0.9%, while the rise in value of the S&P 500 was 0.7% and the rise in value of the Nasdaq was 0.6%.
DJI indice daily chart
SPX500 indice daily chart
As a result of an improved demand outlook, oil prices skyrocketed, which provided a boost to the energy sector. There is a growing expectation that the oil market will tighten in the second half of this year. This expectation is supported by falling crude production as well as Saudi Arabia's commitment to cutting output by one million barrels per day beginning in July. The sentiment surrounding energy stocks was further buoyed by reports of potential stimulus measures in China, which is the largest importer of energy in the world.
The stock of 3M Company (NYSE: MMM), which was upgraded by Bank of America to Neutral from Underperform, increased by almost 5% as a result of the upgrade. It is anticipated that the manufacturer of industrial and consumer products will benefit from the conclusion of legal issues, which is anticipated to enhance the performance of the company. A settlement agreement was reached between 3M and the government last month to resolve allegations that the company contaminated public water systems with PFAS, which are also known as forever chemicals.
MMM stock daily chart
After receiving an upgrade from Hold to Buy from Jefferies, JPMorgan (NYSE: JPM) led the banking sector higher just as earnings season was about to begin on Friday. As justifications for the upgrade, Jefferies pointed to the robustness of JPMorgan's balance sheet as well as the company's potential for earnings. Gains were also seen by regional banks, which have come under increased scrutiny ever since the banking crisis that began earlier this year. After Bank of America reaffirmed its recommendation to buy the company's stock, US Bancorp (NYSE: USB) saw its share price rise by more than 3.5%. US Bancorp is well-prepared to handle sector headwinds, according to Bank of America, and is expected to achieve superior earnings growth and stock performance, according to the statement.
JPM stock daily chart
Amazon (NASDAQ: AMZN), which benefited from its two-day prime day sales event, stood out as one of the few stocks in the technology sector that was trading in the positive territory. During this time, Microsoft (NASDAQ: MSFT) struggled to make gains, despite the growing optimism surrounding the impending acquisition of Activision by Microsoft for $69 billion. Activision is the company that makes the Call of Duty video game. The attempt by US regulators to temporarily block the deal due to antitrust concerns was rejected by a federal judge in a ruling earlier today.
The forthcoming publication of US CPI (Consumer Price Index) data has become the sole focal point of attention for stock futures trading in both the United States and Europe. The majority of speculators are expected to be surprised by the US inflation data, which analysts strongly anticipate will exceed their expectations.
AMAZON stock daily chart
The change in the Consumer Price Index (CPI) for the United States is expected to be 0.3% month-over-month (m/m), while the change in the CPI year-over-year (y/y), which is the most significant change, is expected to be 3.1%, compared to the previous reading of 4.0%.
If the actual number comes close to or matches the forecasted 3.1%, it will be seen as positive news for the market because the inflation target set by the Federal Reserve is 2%. On the other hand, market participants are likely to rejoice if the reading falls below 3.1% because this indicates a significant shift in the trend of inflation. Nevertheless, it is essential to pay close attention to the trajectory that the reading of inflation will take in the future. Although the data that are released today will show a significant drop, which will be driven by tighter monetary policy, an economic slowdown, and lower oil prices, these factors will have less of an influence on the inflation number going forward. As a consequence of this, the gap between the Fed's target and the actual reading might not expand by an additional factor of two from its previous magnitude.
GOLD daily chart
It is anticipated that the price of gold will be volatile throughout the course of the day. Even though the support level at $1,900 is strong, it may be put to a significant test if the inflation data continues to show no signs of easing. Gold prices would be supported by a sizeable decline in the reading of inflation, which could potentially lead to an attempt to test the $1,950 level. On the other hand, if the reading indicates that inflationary pressures will continue for some time, the price of gold may go up even further. As a result, there is a greater chance that the Federal Reserve will raise interest rates, potentially on more than one occasion.

Nasdaq - Might come down to touch the demand areaNasdaq - Might come down to touch the demand area
It has a strong Weekly RBR demand zone, it will come down to touch the demand zone.

Amazon's Resilience: Navigating Challenges and Emerging StrongerAmazon has come a long way since its inception as an online bookseller in 1994. Its stock has witnessed an astounding growth of over 130,000% since going public three years later. Today, Amazon's business spans across a wide range of products, digital services, grocery operations, space satellites, and cloud computing. With its dominance in e-commerce and the cloud industry, one might think that the ideal time to invest in Amazon has passed.
However, despite its remarkable growth, e-commerce sales only accounted for 15% of total retail sales last year, indicating that there is still untapped potential in the market. Furthermore, the increasing demand for artificial intelligence (AI) is projected to fuel revenue in the cloud sector as businesses increasingly rely on AI services. With a strong foothold in both these markets, Amazon's long-term prospects remain promising.
Hence, it is still an opportune time to consider investing in Amazon stock.
The introduction of OpenAI's ChatGPT last year left the tech industry astounded with its ability to generate human-like conversations, pushing the boundaries of AI capabilities. This breakthrough prompted numerous companies to redirect their focus towards AI development.
Cloud computing has emerged as a major beneficiary of the AI revolution, as businesses strive to leverage this technology to enhance their offerings. While Amazon may have initially seemed behind in this domain, its cloud competitor Microsoft secured exclusive licenses to utilize several of OpenAI's AI models. However, Amazon has since made significant progress in generative AI.
For years, the e-commerce giant has been using AI in its retail operations to track consumer shopping patterns, offer personalized recommendations, and optimize shipping logistics. Leveraging its expertise, Amazon has developed an AI model called Amazon Bedrock, which excels in advanced generative AI tasks like creating comprehensive social media campaigns based on product descriptions.
In April, the company announced that Amazon Bedrock would be accessible to Amazon Web Services (AWS) users, alongside a tool called Code Whisperer. This innovative service empowers developers to input their desired outcomes and receive customized code solutions tailored to their specific needs.
While Amazon may have initially lagged in AI services, its dominant market share in the cloud industry positions it advantageously. By impressing AWS users with its current AI models, the company is poised to maintain its leadership and capitalize on the rapidly expanding AI market.
Amazon faced significant challenges last year, with reduced consumer spending and substantial operating losses in its e-commerce segments. AWS also experienced a slowdown in growth due to businesses cutting back on cloud budgets. In evaluating Amazon's prospects, it becomes crucial to take a long-term perspective, considering its strong position in two pivotal markets that are likely to yield favorable results over time.
Encouragingly, the first quarter of 2023 indicates a recovery in Amazon's e-commerce business. The North American segment returned to profitability, reporting $898 million in operating income, while the international segment showed slight improvement. As inflationary pressures subside and Amazon benefits from budget adjustments, the company is expected to continue improving its e-commerce performance. With its dominant market position, Amazon is poised for consistent long-term growth.
Unfortunately, AWS experienced further deceleration in earnings growth during Q1 2023. However, Amazon is still in the early stages of its venture into AI cloud services. The extensive retail knowledge accumulated by the company can be a significant advantage in developing efficient AI models for AWS, while its leading market share continues to attract new users.
Despite a 54% year-to-date increase, Amazon's stock remains 44% below its peak in July 2021. This suggests that there is still potential for a bullish trend. With its strong positions in expanding markets and room for growth, it is not too late to capitalize on Amazon's long-term prospects and potential profitability.
AMAZON Loosely supported. Buy but careful if this level breaks.Amazon / AMZN hit yesterday and is rebounding today exactly at the bottom of the late April Channel Up.
This remains a bullish trend for as long as the Channel Up holds, so buy and target Resistance A at 136.50.
If it breaks downwards, sell and target the 1day MA50 and Rising Support at 123.50.
It is crucial to mention that the 1day RSI has already crossed under its Rising Support, issuing an initial bearish warning.
Follow us, like the idea and leave a comment below!!

Buy when Price is above 20/50/200There are always be trouble below 20ema or 50ema or 200ema or combination of all.
Your odds to make a profit in the market increased significantly if you only buy anything above the 20ema or the 50ema or 200ema or combination of these MAs.

Peeking into Super SevensIn our previous paper , we outlined how investors can use CME's Micro S&P 500 Futures to hedge beta exposure and extract pure alpha.
The paper referenced that the Super Sevens stocks (Amazon, Apple, Google, Meta, Microsoft, Nvidia, and Tesla) will continue to outperform the broader S&P 500 index. Not only do these stocks benefit from passive investing and ESG investing, these firms also have solid fundamentals to back up their gargantuan valuations.
Each of the firms in the Super Sevens offer unique value drivers. Each firm is a market leader in its space and has demonstrated resilient earnings capacity and solid growth potential. Still, each also has its own set of risks. Notably, with the Super Sevens the value drivers outweigh the potential risks.
AMAZON
VALUE DRIVERS
• Blistering profits from AWS offering with dominant market share of 33%.
• Market dominance in e-commerce and solid supply chain network.
• Successful new categories: Kindle (publishing), Alexa (voice assistant), and Prime (video streaming).
POTENTIAL RISKS
• Heavy reliance on AWS for profits. Slowing growth in AWS due to slowdown in corporate IT spending.
• Low profit margins in e-commerce business. Slowing growth due to lower consumer spending.
• Rising competition in cloud services and e-commerce.
ANALYST PRICE TARGETS
• Across 54 analysts providing a 12-month price target, 42 (77%) having a strong buy rating, 7 (13%) of them have a buy rating, 4 (7%) suggest a hold, while just 1 (2%) has a strong sell rating.
• Average 12-month price target stands at 137, with a maximum of 220 and a minimum of 85.
TECHNICAL SIGNALS
• Technical signals point to momentum deeply in favour of Amazon shares. Oscillators point to buy and Moving averages point to a strong buy.
• In aggregate, technical signals point to a buy.
APPLE
VALUE DRIVERS
• Product category definers. Dominant and still growing iPhone demand.
• Solid eco-system which is extremely hard to displace.
• Control over both software and hardware enables specialized tailored improvements.
• Sticky services such as App store, Apple Pay, and potentially Apple BNPL.
POTENTIAL RISKS
• Apple is heavily reliant on external fabricators exposing it to supply-chain bottlenecks.
• Heavily dependent on iPhone sales.
• Rising dependence on future growth in unexplored new categories.
ANALYST PRICE TARGETS
• Across 42 analysts providing a 12-month price target, 22 (52%) having a strong buy rating, 6 (14%) of them have a buy rating, 13 (31%) suggest a hold, while just 1 (2%) has a strong sell rating.
• Average 12-month price target stands at 187, with a maximum of 220 and a minimum of 140.
TECHNICAL SIGNALS
• Technical signals point to solid momentum favouring long position in Apple shares. Oscillators point to buy and Moving averages point to a strong buy.
• In aggregate, technical signals point to a strong buy despite Apple trading at near its all-time-high.
GOOGLE
VALUE DRIVERS
• Google is the dominant search engine (86% market share).
• Phenomenally successful and effective ad-targeting capabilities.
• Heavy investments in future innovation enabling leapfrog into new verticals such as Android, Waymo (FSD & Maps).
• Successful early acquisitions such as YouTube, Android, Applied Semantics & DoubleClick (AdSense), Nest (Home Automation).
POTENTIAL RISKS
• Massive reliance on ad revenues via search for profits. Slowing ad spend as firms cut back on spending.
• Non-trivial dependence on cloud revenue for growth exposes them. Slowing cloud revenue growth due to lower corporate IT spending.
• Failure to expand into new domains such as social media, wearable tech, and gaming.
ANALYST PRICE TARGETS
• Across 52 analysts providing a 12-month price target, 40 (77%) having a strong buy rating, 7 (13%) of them have a buy rating, while 5 (10%) suggest a hold. None of the analysts have a sell rating.
• Average 12-month price target stands at 131, with a maximum of 190 and a minimum of 100.
TECHNICAL SIGNALS
• Technical signals point to decent momentum favouring Google shares but prices are at tiny risk of oscillating downwards. Oscillators point to neutral while Moving averages point to a strong buy.
• In aggregate, technical signals point to a buy.
META
VALUE DRIVERS
• Market monopoly on social media with high penetration across global markets on multiple platforms.
• Flagship Facebook platform continues to see growth with 2.9 billion monthly active users (MAU).
• Successful acquisitions have provided them with a wide suite of social media platforms – WhatsApp (2 billion MAU) and Instagram (2 billion MAU).
• Successful developer tools (Graph, Hydra, React) have allowed them to build useful SDK (Software Development Kit). Potential sources of enterprise revenue from these.
POTENTIAL RISKS
• Increasing competition from TikTok.
• Privacy concerns have a direct revenue impact e.g., Apple’s new privacy policies.
• Falling market share for flagship Facebook in advanced economies.
• High reliance on ad-sales. Slowing ad sales as firms cut back on spending.
• Shaky bet on the Metaverse which is starting to fade.
ANALYST PRICE TARGETS
• Across 60 analysts providing a 12-month price target, 39 (65%) having a strong buy rating, 7 (12%) of them have a buy rating, 10 (17%) suggest a hold, 1 (2%) sell rating, and 3 (5%) has a strong sell rating.
• Average 12-month price target stands at 281, with a maximum of 350 and a minimum of 100.
TECHNICAL SIGNALS
• Technical signals point to decent momentum favouring Meta shares. Oscillators signal neutral indicating a tiny risk of shares shedding gains while Moving averages point to a strong buy.
• In aggregate, technical signals point to a buy.
MICROSOFT
VALUE DRIVERS
• Sheer dominance of Windows (74% market share) & MS Office.
• Deep roots in MS Office enables the firm to straddle across consumers & enterprise.
• Diversified software offerings - cloud (Azure), gaming (Xbox), enterprise (Windows Server and SQL), search (Bing), productivity (Office), collaboration (Teams), and AI (through Open AI's ChatGPT).
• Active M&A activity to acquire assets - LinkedIn, OpenAI, GitHub, Skype, Mojang, Nokia, Activision-Blizzard (Pending).
• Besides Windows, Microsoft controls dev frameworks such as .Net further strengthening their grasp on SW dev.
POTENTIAL RISKS
• Limited success in hardware offerings unlike Apple.
• Multiple major acquisitions have fizzled – Skype and Nokia.
• Limited adoption in enterprise software.
ANALYST PRICE TARGETS
• Across 51 analysts providing a 12-month price target, 37 (73%) having a strong buy rating, 6 (12%) of them have a buy rating, 7 (14%) suggest a hold, while just 1 (2%) has a strong sell rating.
• Average 12-month price target stands at 345, with a maximum of 450 and a minimum of 232.
TECHNICAL SIGNALS
• Technical signals point to decent momentum favouring Microsoft shares. Oscillators are at neutral while Moving averages signal a strong buy.
• In aggregate, technical signals point to a strong buy.
NVIDIA
VALUE DRIVERS
• Market dominance in discrete GPU’s (80%).
• Early mover in AI hardware which gives them a lead over the competition.
• Raytracing, DLSS, Neural Network cores.
• Nvidia’s CUDA is the primary choice for training ML models.
• Market dominance in high-growth data centre graphics hardware (95%) and super-computing hardware.
• Successful enterprise partnerships – car manufacturers using Nvidia software.
• Emerging tech such as AI and VR require more graphics intensive processing driving demand for Nvidia’s products.
POTENTIAL RISKS
• Hardware-focused business model exposes it to supply-chain risks and bottlenecks.
• Extremely high P/E of 225 dependent upon expectations of future growth in AI.
• Losing market share in discrete GPUs and enterprise GPUs to AMD and Intel.
ANALYST PRICE TARGETS
• Across 50 analysts providing a 12-month price target, 36 (72%) having a strong buy rating, 6 (12%) of them have a buy rating, 7 (14%) suggest a hold, while just 1 (2%) has a sell rating.
• Average 12-month price target stands at 444, with a maximum of 600 and a minimum of 175.
TECHNICAL SIGNALS
• Technical signals point to solid momentum favouring long position Nvidia shares. Oscillators point to buy and Moving averages point to a strong buy.
• In aggregate, technical signals point to a strong buy despite Nvidia relentless and unrivalled price ascent.
TESLA
VALUE DRIVERS
• Early mover in EV’s with dominant market share in US (62%).
• Dedicated and loyal customer base.
• Vertical integration of EV value chain allows it to reduce reliance on external suppliers.
• Early investment in large factories that will allow them to scale output more efficiently.
• Huge and monetizable supercharger network by opening it up to other EV makers.
• Subscription model for software enables revenue generation after product sale.
• Long term vision has allowed Tesla to create entirely new products such as supercharger network, battery banks, home power backup and solar roofs.
• Tesla’s planned Robotaxi and entry into car insurance can be hugely disruptive.
POTENTIAL RISKS
• Increasing competition from automobile majors as well as Chinese EV firms.
• Tesla’s brand is deeply entangled with Musk’s reputation.
• Dependence on government incentives to make Tesla affordable.
• Continued access to battery metal minerals.
• Ongoing and unresolved production scaling challenges.
ANALYST PRICE TARGETS
• Across 46 analysts providing a 12-month price target, 18 (39%) having a strong buy rating, 5 (11%) of them have a buy rating, 17 (37%) suggest a hold, 1 (2%) has a sell rating, and a 5 (11%) hold a strong sell rating.
• Average 12-month price target stands at 201, with a maximum of 335 and a minimum of 71.
TECHNICAL SIGNALS
• Technical signals point to solid momentum favouring Tesla. Oscillators point to buy and Moving averages point to a strong buy.
• In aggregate, technical signals point to a strong buy.
SUMMARY
The Super Sevens are well positioned to continue outperforming the wider market. As mentioned in our previous paper , investors can use a beta hedge to nullify the effects of the broader market (S&P 500) and extract pure alpha from the growth of the Super Sevens.
MARKET DATA
CME Real-time Market Data helps identify trading set-ups and express market views better. If you have futures in your trading portfolio, you can check out on CME Group data plans available that suit your trading needs www.tradingview.com
DISCLAIMER
This case study is for educational purposes only and does not constitute investment recommendations or advice. Nor are they used to promote any specific products, or services.
Trading or investment ideas cited here are for illustration only, as an integral part of a case study to demonstrate the fundamental concepts in risk management or trading under the market scenarios being discussed. Please read the FULL DISCLAIMER the link to which is provided in our profile description.
