NDQ - Double BottomNDQ has formed double bottom at 13,000 range, tGT 1 is 13150
With Central bank being neutral, NDQ will break the supply zone and will fly soon.
Amazon

$AMZN - bull and bear thesisNASDAQ:AMZN
Daily timeframe
* Breakout, bounce off the support trendline and 3 daily bounces off the top of the triangle I have laid out, I still think this goes to $119.98. I think my previous bear case will be wrong, adjusting based on new information
Bull: I still don't see resistance until $119.98 (the nearest breakdown candle)
Bear: If it breaks below the bear flag, I'd expect a move back to $88.40


Amazon set to BREAKOUT or FALLOUTAs we analyze the 4 hour chart of Amazon I am honestly indifferent on the stock and would not be trading or buying it right now as it seems "stuck to me" based off these channels... When we look at the "macro" blue channel it shows upside with price pointing to higher 130s... but it would be a very swingy ride there.. right now we are in the white channel which is also very swingy and large for a channel to trade but profit to be made if TIMING is right... I have fib levels listing this as a Wave 2 and looking for more downside, but will continue to watch if we are to breakout of the resistance.. until then I would stay bearish.

amazon is in last consolidated wave amazon is in last consolidated wave , wave G of diamond is moving stock under $100 once again but after that is buying opportunity to reach $140

SHORT RNDR Token, Overbought - Resistance HitCurrent Price: $2.43
Entry point 1: $2.58
Entry point 2: $2.43
Target 1: $2.25
Target 2: $1.95
Stoploss: $2.70
This is a solid asset with a large amount of potential but i believe it is currently overbought and needs some room to cool, This is why i have added two entry points to this trade. The first one is for the more conservative investor who would like to see a bit more confluence before making the jump, the second entry point is for those banking on the overall market and the asset decline in price.
The Render Network is designed to connect users looking to perform render jobs with people who have idle GPUs to process the renders. Owners would connect their GPUs to the Render Network in order to receive and complete rendering jobs using OctaneRender. Users would send RNDR to the individual performing the render work and OTOY would receive a small percentage of RNDR for facilitating the transaction and running the Render Network.
Once they’ve registered their idle GPUs on the Render Network, these GPU owners become “Node Operators” and are able to earn RNDR Tokens. They do this by accepting jobs from users in need of rendering work, known as “Creators”, who send their files to the Render Network, where they are assigned to Operators. Render receives a small percentage of the RNDR paid out in order to maintain the network and facilitate the transaction.

AMZN breaking down (30 min)As we see Amazon break through the cloud to the downside we should expect more downside to come into next week.. I would play this to the downside until, or if we break the horizontal line which is resistance to the upside. It is possible we test that line and then break down or we just see it keep breaking down from the price it is at now. The good thing is we have broken out of the cloud and should see momentum continue to the downside. Always have a stop loss and it tight.

Amazon - go longSince there is a good closing above the bollinger band in the weekly and daily as well and the above supply area is tested already.
There is a good change for the break out.

AMZN Earnings - $110 StraddleLet's pump this clown market? For real, how else can we hit 4200SPX?
Looking to see at least a 5-10% move. if it's like META then maybe we moon or inverse moon. Should be fun to watch.
Position is 5/19 HKEX:110 straddle. Going to close tomorrow regardless of outcome.
Have a beer and enjoy I'd say.

Stay Away from AMZN NowTechnical Analysis:
- AMZN is still doing a WXY medium term correction in blue
- In the short term AMZN is finishing wave ((2)) in black before going more down side
- We expect that the correction will be finished at around BMV:60 when wave ((II)) is also completed
- H1 right side is turning up
- H4 right side is turning down
Technical Information:
- Don't buy AMZN now
- We like to buy when the correction WXY is done

Amazon & Appleboth Amazon and Apple are making very bearish reversal formations which might drop drastically the price to a new low on a big TF, Daily. Remember it's a mid to long-term view; therefore, it could be invalid. However, these are well-known wave structures, and they are accurate most of the time, but certainty does not exist in charts of course.

Amazon has 30-50% upside Amazon has 30-50% upside based on the fact that all the other top tech stocks have made moves NASDAQ:NFLX $APPL NASDAQ:META just to name a few I like NASDAQ:GOOG and NASDAQ:AMZN at these levels

AMAZON ahead of recessionIn the upcoming recession, an analysis of US100 or SPX might seem more profitable but those who focus on single values in a volatile market, AMAZON opens a short opportunity ahead of the recession.

Amazon is a buy now (NEW)Amazon still in a buy area.
Buy to play the bounce towards the downsloping resistance.
After reaching the target , more downside expected.
Good luck

Amazon rejected at 200 day moving average in a market which was Amazon rejected at 200 day moving average in a market which was ok so far and in risk on mode

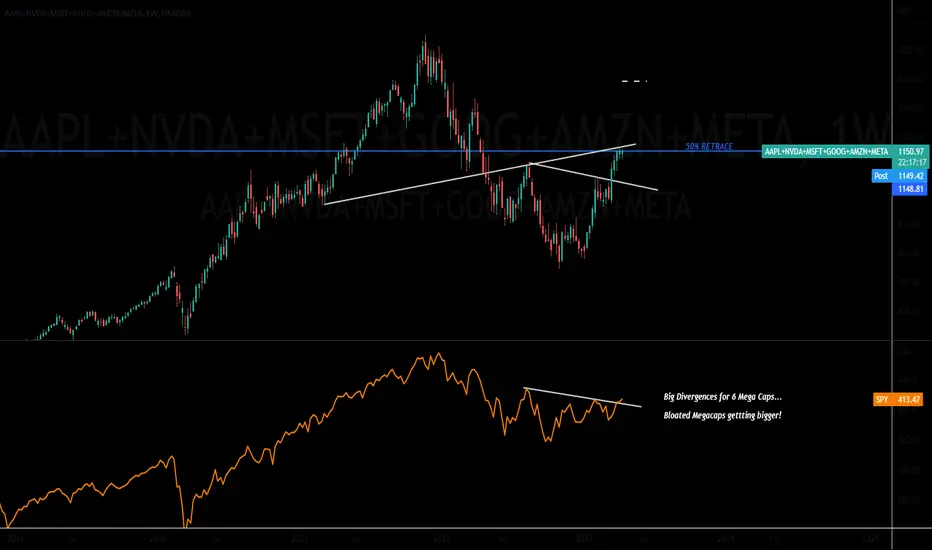
Big 6 Megacaps gaining all the money flow....Apple, Microsoft, Google, Amazon, Nvidia, Meta. these are the 6 stocks in the SPX that have been seeing all the moneyflow.
A concentration of capital in a few names does not make for a healthy stock market.
It leaves the markets vulnerable to a bigger decline if money is so concentrated in a few names.
the S&P500 is on the verge of a breakout but these massive names are at major resistance.
Without these names continuing their ascent, the SPX will likely not breakout.
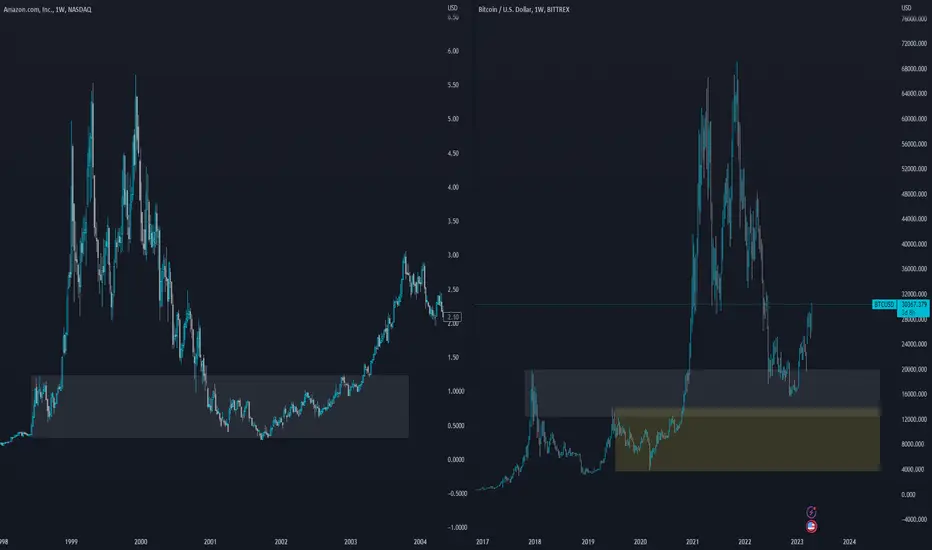
BTC Market Structure Theory 3Saw a bearish tweet comparing the two assets decided to show my perspective of why they are different. let me know your thoughts.
This one is a bit different but fundamentally the wrong area is being highlighted. its tempting to draw the box in yellow on the btc chart however, the amazon chart is highlighting an area where an ATH was formed at the time, to accurately compare this you would draw the same area on BTC using the prev ath at 19k when doing so, you can see the current btc does infect tag the area.
Amazon's Downward Spiral: Is the E-commerce Giant in Trouble?Amazon's stock has been running into the thick cloud of the Ichimoku on the monthly chart, indicating a significant resistance level that may lead to further declines. The Ichimoku is a technical analysis indicator that uses a range of moving averages to identify potential support and resistance levels. In this case, the thick cloud represents a significant resistance level that Amazon's stock has been struggling to break through. This suggests that there may be more pain ahead for the stock, as it continues to face downward pressure.
The first resistance price for Amazon's stock is around HKEX:107 , which is a critical level to watch. If the stock manages to break through this level, it may be able to gain some upward momentum. However, if it fails to break through this resistance, we could see further declines in the stock price. Given the current market conditions and the challenges that Amazon is facing, it seems likely that the stock will face more downward pressure in the coming months. As a result, investors should remain cautious and closely monitor the stock's performance in the coming weeks and months.


AMZN is Still in a WXY Correction StructureAs we can see in the chart, Amazon(AMZN) WXY correction is in blue and we expect more downside to around $60 only when the wave (Y) in blue and Wave ((II)) in black are complete.
Technical Analysis:
- H1 & H4 Right Side are Turning Down
- Technically AMZN has now 5 waves down and has a strong correlation with NASDAQ - that's why we expect that it extends lower to around $60 where smart buyers will must appear and we'll like to do an edging buy.

Do Not buy Amazon right now! Amazon.com, Inc. is an American multinational technology company focusing on e-commerce, cloud computing, online advertising, digital streaming, and artificial intelligence.

Amazon - AMZNLeft chart – daily chart / 1 year
• Resistance from the gap formed ending October 2022 at 103.96/109.77
• Support from the gap formed beginning November 2022 at 89.47/91.65
• Stock is trading between the support and resistance gaps in a sideways trend
• Decreasing volume in the last days
Right chart – weekly chart / 5 years
• Downtrend since mid-November 2022
• Downtrend supported by 50 weeks moving average
• Resistance at the 23.6% Fibonacci Retracement at 106.80
• Decreasing volume in the last weeks
Stay short as long as we don’t see a clear break of the resistance at 109.77. At that point the downtrend is broken, the Fibonacci retracement becomes a support and the gap resistance (left chart) is filled.

AMAZON : Let's go Bullish againAfter 2 years of negativity the Predictum is finally positive again.
There's not much to say about Amazon, it's a solid and valid company.
This is a very positive signal that joins the rest of my buy signals.
I have increased my positions and will continue to do so as long as the conditions are positive considering a medium/long term vision.

Amazon -> Bullish Trend ReversalHello Traders,
welcome to this free and educational multi-timeframe technical analysis .
On the weekly timeframe you can see that Amazon stock just recently retested and already rejected a quite strong previous weekly support zone at the $85 area which was turned strong support once again.
You can also see that from a weekly perspective we do have the possibility to created a double bottom and start a new bullrun from here so I am now just waiting for a break above the neckline at $105, followed by a retest and then more continuation towards the upside.
On the daily timeframe you can see that Amazon stock is already creating bullish market structure, however I am still waiting for a break above the $105 resistance and a retest before I definitely do expect more continaution towards the upside.
Thank you for watching and I will see you tomorrow!
You can also check out my previous analysis of this asset:
