Pull Back is RequiredAMZN Sell Setup - GETTEX:AMZ
Bearish Momentum on Daily Chart
Instrument: AMZN
Timeframe: Daily
Direction: Sell
Confidence: 75%
Setup Overview:
AMZN is showing bearish signals after a recent pullback. MACD has a bearish crossover, and RSI is overbought at 61.25, indicating potential for a downward move. VIX is rising, and 10-year yields are increasing, adding to market pressure. Social sentiment on X is mixed, but news sentiment leans bearish.
Trade Details:
Entry Price: $198.82
Profit Target: $182.23 (~5% downside)
Stop Loss: $205.61 (2:1 risk-reward ratio)
Position Size: 4% of portfolio
Expected Move: -5%
Key Indicators:
MACD: Bearish crossover
RSI: Overbought at 61.25
Market Context: Rising VIX, increasing 10-year yields
Follow for Best AI Signals on the market
Amazon

AMAZON I Technical Forecast Welcome back! Let me know your thoughts in the comments!
** Amazon Analysis - Listen to video!
We recommend that you keep this pair on your watchlist and enter when the entry criteria of your strategy is met.
Please support this idea with a LIKE and COMMENT if you find it useful and Click "Follow" on our profile if you'd like these trade ideas delivered straight to your email in the future.
Thanks for your continued support!Welcome back! Let me know your thoughts in the comments!

AMZN Amazon Options Ahead of EarningsIf you haven`t bought AMZN before the previous rally:
Now analyzing the options chain and the chart patterns of AMZN Amazon prior to the earnings report this week,
I would consider purchasing the 210usd strike price Calls with
an expiration date of 2025-6-20,
for a premium of approximately $3.75.
If these options prove to be profitable prior to the earnings release, I would sell at least half of them.
Disclosure: I am part of Trade Nation's Influencer program and receive a monthly fee for using their TradingView charts in my analysis.

AMAZONAmazon has a great potential to head up towards 230 level.
Disclosure: We are part of Trade Nation's Influencer program and receive a monthly fee for using their TradingView charts in our analysis.

Enphase power and Amazon comparison from 1999
The similarities are very striking from Amazon's IPO into the 1999 Dot Com speculative bubble and the bust afterwards. History could be repeating itself. This is the EV/Solar bubble. The tech revolution is already played out. Now the S curve will be solar panels on everyone's homes and commercial buildings. The big buying opportunity could be coming.

Amazon losing weekly trendline – watch these Fibo levels nextTechnical Analysis
Amazon (AMZN) has broken below its weekly ascending trendline and failed to reclaim the key 0.618 Fibonacci level (180.52). Strong bearish volume and a weakening RSI suggest downside continuation. Key support targets lie at 161.55, 151.21, and 142.58, with extended downside to 119.12.
Fundamentals
Macro pressure from high interest rates and a slowdown in consumer spending weighs on Amazon. Intense competition in AWS and e-commerce adds uncertainty. Upcoming earnings may serve as a catalyst for directional clarity.
Scenarios:
Base case – move down toward 151.21, 142.58, 119.12
Bullish case – break above 180.52 → rally toward 207.52, 241.92

AMZN Weekly Options Trade Plan 2025-04-16AMZN Weekly Analysis Summary (2025-04-16)
Below is a synthesis of all the reports and our resulting view:
──────────────────────────────────────────────
Comprehensive Summary of Each Model’s Key Points
• Grok/xAI Report – Viewed AMZN’s charts as showing a short‐term bearish bias even as some technicals (daily MACD) hint at a possible rebound. – Noted price near key supports and high put open interest. – Recommended a bearish single‐leg play: buying the $172.50 put at a premium of $0.85 (despite that premium being a bit high relative to our “ideal” range).
• Claude/Anthropic Report – Highlighted that on shorter timeframes (and with max pain at $185), some momentum and oversold conditions might create a bounce. – Emphasized bullish short‐term potential, recommending a trade on the $180 call at a premium of $0.71.
• Gemini/Google Report – Interpreted the technicals (EMAs, RSI, Bollinger Bands) as strongly bearish, with price testing a critical support level near $176. – With the options chain showing significant put volume at lower strikes, they recommended buying the $170 put (ask roughly $0.46) for its leverage and within or close to the target premium range.
• Llama/Meta Report – Also examined the multiple technical indicators and noted the mixed signals. – Although they observed bearish factors, their conclusion was cautious enough to state “NO TRADE RECOMMENDATION TODAY” if conditions aren’t optimal.
• DeepSeek Report – Concurred with the bearish outlook on both intraday and daily levels. – Recommended a trade on the $170 put (premium $0.46) with clear risk management (stop out if AMZN rallies above approximately $177.50).
────────────────────────────────────────────── 2. Areas of Agreement and Disagreement Between Models
• Agreements – Most models agree that AMZN is trading below key short‐term and longer-term EMAs, with technical momentum looking bearish. – There is a consistent theme in the options data of high put open interest and strong volume in strikes below the current price. – Several reports (Grok/xAI, Gemini/Google, DeepSeek) favor a bearish put trade based on support levels and risk/reward dynamics.
• Disagreements – The Anthropic analysis offered a moderately bullish case (with a call trade) based on oversold short‐term conditions and a max pain level high above current price. – Llama/Meta expressed enough caution so that if price action does not break expected levels, the trade might be skipped entirely. – The recommended strike/premium differs: Grok/xAI’s $172.50 put is slightly closer to the money with a higher premium, while Gemini/DeepSeek prefer the leaner $170 put (solid liquidity, premium ~ $0.46 in our target range).
────────────────────────────────────────────── 3. Clear Conclusion
Overall Market Direction Consensus: The majority of the reports lean toward a moderately bearish outlook given that AMZN’s current price is below key EMAs, near immediate support levels, and is trading in a high-volatility environment. Although there’s one bullish view (and some caution from Llama/Meta), the bearish technicals and put-side open interest weigh more heavily for a weekly option play.
Recommended Trade (if conditions are met at open): • Trade: Buy a single-leg, naked put option. • Strike: $170.00 • Expiration: April 17, 2025 • Premium: Approximately $0.46 per contract (which sits nicely near our ideal range of $0.30–$0.60) • Entry Timing: Begin at market open based on confirmed weakness below support levels • Profit Target: Approximately a 100% gain on the premium (aiming for roughly $0.90) • Stop Loss: About $0.35 (or exit if AMZN rallies decisively above roughly $177.50) • Trade Confidence: Around 65% given the technical bearish bias and clear liquidity, though mindful of the risk that a short-term bounce at support could reverse the trade.
Key Risks and Considerations: • A sudden short-term recovery (bouncing off support around $176) could trigger losses. • High volatility (indicated by the VIX) means that intraday whipsaws remain possible. • The mixed viewpoints (especially the bullish call suggestion) underscore that any entry must respect tight stop-loss discipline. • News and broader sector conditions could alter momentum unexpectedly.
────────────────────────────────────────────── 4. TRADE_DETAILS (JSON Format) { "instrument": "AMZN", "direction": "put", "strike": 170.0, "expiry": "2025-04-17", "confidence": 0.65, "profit_target": 0.90, "stop_loss": 0.35, "size": 1, "entry_price": 0.46, "entry_timing": "open" }
Disclaimer: This newsletter is not trading or investment advice but for general informational purposes only. This newsletter represents my personal opinions based on proprietary research which I am sharing publicly as my personal blog. Futures, stocks, and options trading of any kind involves a lot of risk. No guarantee of any profit whatsoever is made. In fact, you may lose everything you have. So be very careful. I guarantee no profit whatsoever, You assume the entire cost and risk of any trading or investing activities you choose to undertake. You are solely responsible for making your own investment decisions. Owners/authors of this newsletter, its representatives, its principals, its moderators, and its members, are NOT registered as securities broker-dealers or investment advisors either with the U.S. Securities and Exchange Commission, CFTC, or with any other securities/regulatory authority. Consult with a registered investment advisor, broker-dealer, and/or financial advisor. By reading and using this newsletter or any of my publications, you are agreeing to these terms. Any screenshots used here are courtesy of TradingView. I am just an end user with no affiliations with them. Information and quotes shared in this blog can be 100% wrong. Markets are risky and can go to 0 at any time. Furthermore, you will not share or copy any content in this blog as it is the authors' IP. By reading this blog, you accept these terms of conditions and acknowledge I am sharing this blog as my personal trading journal, nothing more.

AMAZON is on its 3rd historic +1000% growth Bull Cycle.Amazon (AMZN) almost has been trading within a multi-year Channel Up pattern since the Housing Bubble bottom in November 2008 and this month almost touched its 1M MA50 (blue trend-line).
With the exception of the 2008 Housing Crisis and the 2022 Inflation Crisis, which bottomed on the 1M MA100 (green trend-line), the 1M MA50 has never been broken. In fact it has been the key Support of every Bull Cycle that surprisingly has so far peaked on a +1051% rise.
As you can actually see by the 1M RSI, such corrections, like the one in the past 3 months, are quite common within the Channel Up and offer excellent long-term buy entries.
So, technically the Inflation Crisis bottom (December 2022) on the 1M MA100 has initiated Amazon's 3rd historic Bull Cycle within this pattern and based on the previous two, it may also peak after a +1051% rally inside 2028. Our projected Target on this is $900.
Would you miss out on such an opportunity in the past?
-------------------------------------------------------------------------------
** Please LIKE 👍, FOLLOW ✅, SHARE 🙌 and COMMENT ✍ if you enjoy this idea! Also share your ideas and charts in the comments section below! This is best way to keep it relevant, support us, keep the content here free and allow the idea to reach as many people as possible. **
-------------------------------------------------------------------------------
💸💸💸💸💸💸
👇 👇 👇 👇 👇 👇

Amazon I Technical & Tariff Analysis Welcome back! Let me know your thoughts in the comments!
** Amazon Analysis - Listen to video!
We recommend that you keep this pair on your watchlist and enter when the entry criteria of your strategy is met.
Please support this idea with a LIKE and COMMENT if you find it useful and Click "Follow" on our profile if you'd like these trade ideas delivered straight to your email in the future.
Thanks for your continued support!Welcome back! Let me know your thoughts in the comments!

Apparatchik Trump Says 'No.. More Pain' Ahead of Amazon EarningsPresident Trump's new tariffs have had a significant negative impact on Amazon's stock performance, revenue, and earnings, primarily due to increased costs and supply chain disruptions.
Here below is a detailed analysis of these effects.
Impact on Amazon's Stock Performance
Amazon's stock has seen substantial declines following the announcement of Trump's tariff plan. The company's shares dropped nearly 7% within two days of the announcement and are down nearly 21% year-to-date. These tariffs have exacerbated existing challenges for Amazon, which was already struggling in early 2025 with a 13% decline in stock value during the first quarter. The broader market also suffered, with technology stocks experiencing sharp declines as investors reacted to fears of higher costs and inflation.
Revenue Challenges
Amazon's reliance on Chinese suppliers for merchandise has made it particularly vulnerable to the newly imposed tariffs. Over 50% of Amazon's top third-party sellers are based in China, and many of their products are subject to hefty import taxes, including a 34% tariff on Chinese goods. These tariffs increase landed costs for a significant portion of Amazon's inventory, forcing sellers to either absorb the additional expenses or pass them on to consumers through higher prices. This could lead to reduced consumer demand, as higher prices may deter shoppers from purchasing goods on Amazon's platform.
Additionally, the elimination of duty exemptions on minor imports—previously advantageous for discount platforms such as Temu and Shein—has disrupted Amazon's competitive pricing strategy. While this change may level the playing field among e-commerce platforms, it also raises operational costs for Amazon's marketplace vendors who had relied on these exemptions.
Earnings Pressure
The tariffs are projected to slash Amazon's annual operating profits by $5 billion to $10 billion due to increased merchandise costs. Goldman Sachs estimates that these costs could rise by 15% to 20%, further straining profitability. While Amazon has historically maintained lower prices compared to competitors, absorbing these increased expenses without raising prices significantly may be unsustainable in the long term.
Moreover, fears of inflation resurgence due to Trump's trade policies could further dampen consumer purchasing power. This would likely lead to lower sales volumes and additional pressure on profit margins across Amazon's retail operations.
Potential Mitigation Strategies
To counteract these challenges, Amazon may implement several measures:
Vendor Negotiations. The company could negotiate with suppliers to share the burden of increased input costs rather than bearing them entirely.
Price Adjustments. Selective price increases on certain products may help offset rising costs without alienating customers entirely.
Supply Chain Diversification. Shifting sourcing away from heavily tariffed regions like China or focusing more on domestic suppliers could reduce exposure to trade disruptions.
Focus on Services. Amazon’s cloud division, AWS, contributes significantly to its operating income (58% in Q4 2024) and remains largely unaffected by tariffs. Increased emphasis on AWS could help mitigate losses from retail operations.
Technical challenge
The main technical graph indicates on Bearish market in development, with nearly 30% potential to further decline, down to major 10-year average support.
Conclusion
Trump’s tariffs have created substantial headwinds for Amazon by driving up costs and disrupting its supply chain. These challenges have led to stock declines, reduced revenue potential, and significant earnings pressure. While Amazon is exploring mitigation strategies such as vendor negotiations and diversification, the long-term impact will depend on how effectively the company adapts its operations amidst ongoing trade tensions.
--
Best 'Apparatchik' wishes,
PandorraResearch Team 😎

AMZN LONG/SHORT SET UP(Amazon) If $160.00 holds we can see $200
if we break below$160.00 we could see $140-$120
LONG TRADE
Entry 1 $175.00
Entry 2 $165.00
Stop loss $155.00
Take profit 1- $195.00
(Close 33%)
Take profit 2- $215.00
(Close 66%)
Take profit 3-$230.00

Thoughts on US equities. Not looking good at all. Expecting more sellside distribution on US equities. We need to go towards any discount levels

Amazon (NASDAQ: $AMZN) Drops 8% as Trump Tariffs Shake Markets. Amazon (NASDAQ: NASDAQ:AMZN ) is facing huge downward pressure following President Donald Trump's announcement of sweeping tariffs. The stock dropped 9.26% in early trading, reaching $176.92 as of 11:01 AM EDT.
These tariffs impact over 100 countries, including China, a key supplier for third-party merchants on Amazon’s platform. Rising import costs could push prices higher, affecting consumer spending and Amazon’s profit margins.
Looking at the broader market, it is also struggling from the tariffs. The Magnificent Seven stocks, including Apple, Nvidia, Meta, Tesla, Alphabet, Microsoft, and Amazon, have all seen huge drops.
Amazon’s 8% drop is among the largest, further highlighting its vulnerability to trade disruptions. If these tariffs persist, they could reignite inflation, weigh on economic growth and further impact stock prices. Amazon has faced major market shifts in the past. In 2022, its stock lost over 50% of its value within a few quarters.
The question now is, can the current decline lead to similar losses?
With Amazon trading at $242 in February, some fear it could drop below $120 if the economic outlook worsens.
Adding to concerns, geopolitical risks remain high. The ongoing war in Ukraine, coupled with uncertainty over future U.S policies, creates a volatile environment for stocks. Amazon’s reliance on global supply chains and consumer spending makes it highly sensitive to market shocks.
Technical Analysis
Looking at Amazon technically, there has been a downtrend since early February when it reached an all-time high and a 52-week high of $242. This peak came shortly after the presidential inauguration, but since then, the market conditions have not been favorable. The introduction of new tariffs has fueled bearish momentum, pushing Amazon lower toward key support levels.
Currently, the stock is testing a double support level, an ascending trendline and a horizontal support around $180. If buyers step in at this level, a rebound could occur, targeting the previous $252 all-time high. However, given the economic uncertainty, there is a strong chance the stock may break below this current support.
If the weekly candle closes strongly below the $180 level, the next critical point where the stock might find support is around $144. This area has historically provided strong buying interest and it may serve as a potential bottom if the decline continues.
Looking at momentum indicators, the weekly RSI currently sits at 33, indicating strong bearish momentum. Despite the reading approaching the oversold reading, macroeconomic data shows the downtrend remains dominant and further losses could be ahead.
What's the Outlook? Can Amazon Recover Soon?
The coming weeks will be crucial for Amazon’s stock. With earnings expected between April 28th and May 2nd, market sentiment may shift based on revenue growth and profit margins. However, ongoing trade uncertainties and rising costs remain key risks.
For now, monitor price action around the current market price of $180. A strong bullish move could confirm a short-term recovery. On the other side, a break below this double support level may signal a further drop towards $144 support level.

Buy idea on AMAZON (AMZN)Based On :
- Presidential cycle and quinquennial cycle
- quantitative data
- strong demand zone covered by weekly and 2w as well
- divergence on Poiv (open interest from Nq) and Progo
- Undervalued conditions on weekly timeframe

$AMZN Tradespoon - Long Entry $201.36Tradespoon model generated long signal for Amazon ( NASDAQ:AMZN ). Predicted range: $201.36–$207.48. Trend: +1.10%. NASDAQ:AMZN

AMZN breaks bear trendAmazon stock has gapped higher along with several other tech firms as investors rushed back into riskier assets following reports that Trump's upcoming tariffs will be more targeted than initially thought.
AMZN broke its bearish trend line after finding good support lats week at $190 key support level. If the gap now gets filled, then dip buyers might emerge near Friday's closing levels of around $195-$196. This area is now going to be significant.
Anyway, the short-term bias has flipped back to being bullish in light of today's breakout. As long as the stock now remains above the trend line, any short-term dips could be bought.
By Fawad Razaqzada, market analyst with FOREX.com

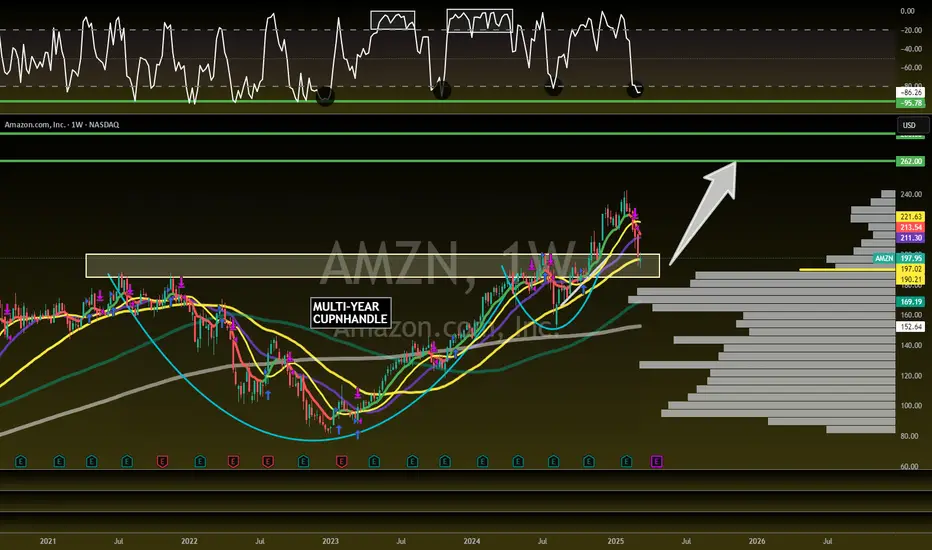
Amazon is the FULL PACKAGE! 62% UpsideNASDAQ:AMZN - H5_W Trade Setup: 🚨
Confirmed CupnHandle Retest =
🎯$262 🎯$280
📏MM: $310
- Multi-Year CupnHandle
- Massive weekly volume shelf
- Green Support Beam on Wr%
- Undervalued MOAT Company
Not financial advice

AMAZON SWING LONG FROM SUPPORT|LONG|
✅AMAZON fell again to retest the support of 190.79$
But it is a strong key level
So I think that there is a high chance
That we will see a bullish rebound and a move up
LONG🚀
✅Like and subscribe to never miss a new idea!✅
Disclosure: I am part of Trade Nation's Influencer program and receive a monthly fee for using their TradingView charts in my analysis.

Amazon is about to DELIVER! 32% UpsideNASDAQ:AMZN
Great Risk/Reward here!
Confirmation of Retest = 🎯$262
- Right at CupnHandle Retest area
- Volume Shelf Support
- 50WMA
- Wr% Green Support Beam
Not financial advice
AmazonAmazon should definitely reach 151.37 (even if it moves up again, it will start to move down again)

AMZN Trade PlanLooking to buy AMZN at market price, with additional entries at 187 and 179 for better positioning.
🎯 Profit Target: 210 - 215
Stay disciplined, manage risk, and let the trade develop! 📈📊
⚠️ Disclaimer: This is not financial advice. Always do your own research and trade responsibly! 💡

Lets Make Life Changing Money TogetherMartyBoots here , I have been trading for 17 years and sharing my thoughts on CRYPTOCAP:OTHERS .
.
CRYPTOCAP:OTHERS is looking beautiful , absolutely beautiful and a very interesting chart for more upside, it is now getting into support. Just like NASDAQ:AMZN did back in 2008.
Do not miss out on CRYPTOCAP:OTHERS as this is a great opportunity to make life changing money on ALT Coins.
Regulation is going to moon this market
Be Ready
Watch video for more details

BABA: $155 | Looks like a RESET no stabilization fund SPY DOW are dazzling while this issue seems to be abandoned by speculators
until it goes sub 100 interest should kick in
