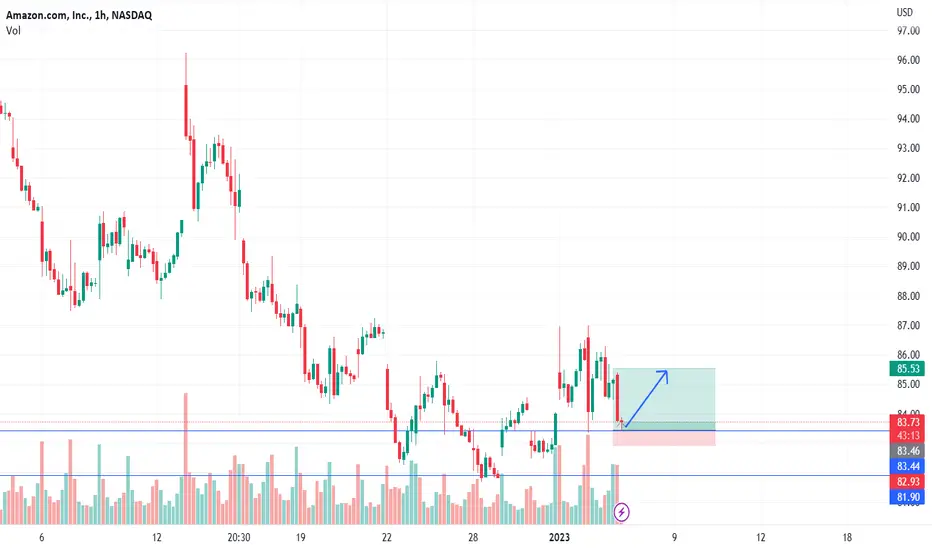
AMAZON Short From Resistance! Sell!
Hello,Traders!
AMAZON is again retesting
A strong horizontal resistance
From where a local pullback
Is likely to happen
Sell!
Like, comment and subscribe to boost your trading!
See other ideas below too!
Amazon

Amazon (AMZN) Updates ---> LONGAmazon (AMZN) Trade Updates
Amazon arrives in the volumetric accumulation zone of the last 2 years.
the price reacted in the best way both on the weekly and on the daily,
Waiting for the Earnings, which in 2022 have not been good for the first time in years, even considering the last quarter positive in cash flow, but negative in net profit margin (-20%).
Now, in the case of neutral data, I will certainly evaluate a further entry, having an average price of about $106, I expect to double the exposure.
My target is all-time highs, although volumetrically one could think of an exit at $160
Happy trading
Lazy Bull

✅AMAZON LOCAL SHORT🔥
✅AMAZON will be retesting a resistance level soon
From where I am expecting a bearish reaction
With the price going down but we need
To wait for a reversal pattern to form
Before entering the trade, so that we
Get a higher success probability of the trade
SHORT🔥
✅Like and subscribe to never miss a new idea!✅

AMAZONDay chart of AMAZON Composite of NASDAQ100 in which strong support zone is 80 and Resistance zone is 103

Bitcoin repeating Amazon Y2K Bubble Leaving this here, Amazon during this time people could see the future, people could see the potential.
Price action repeating once again this is human patterns doing the same thing about a great product.

AMZN WITH THE EXPANDING CHANNEL BREAKOUT FOR A REVERSALAMZN did a bullish breakout on the upper boundary where we have a chance of seeing a rally ahead back toward the target close to 120+ on the chart. If the price can follow up the bullish sentiment in the future we can expect a decent recovery from the following expanding channel identified.
Thanks for visiting my tradingview profile. Hope the chart update helps you out. If you like the content do hit the thumbs up and follow me for future updates. 🙌🏻😎
📌For more details regarding this chart update, please message me on tradingview chat. Thank you!

Avax potentially breaking up from a falling wedgeIf price action can flip this green trendline to solid support the price could climb to the $28 target within the next month or 2. Fundamentally, one of the reasons for this pump is that Amazon Web Services (AWS) has partnered with Ava Labs, the company building out layer-1 blockchain Avalanche, to help scale blockchain adoption across enterprises, institutions and governments.
“Looking forward, web3 and blockchain is inevitable,” Howard Wright, VP and global head of startups at AWS, said. “No one can call the time or date or quarter that it’s going to happen and it’ll be mainstream, but we’ve seen the cycles of growth before. The velocity of this one seems like it’s accelerating and we’re just excited to be a part of this.”
The partnership intends to make it easier for individuals to launch and manage nodes on Avalanche while also aiming to give the network more strength and flexibility for developers.
AWS will support Avalanche’s infrastructure and decentralized application (dApp) ecosystem, alongside one-click node deployments, through its marketplace. The affiliation will also include Ava Labs joining AWS Activate, a program that helps startups and early-stage entrepreneurs get started on its platform. All this should lead to sustaining bullish momentum for avalanche. *not financial advice*


Cloud computing: what are the big players telling us?Each earnings season, we become accustomed to certain patterns. One pattern involves the biggest tech companies reporting earnings before many other smaller and medium sized firms. In what we know is a very difficult economic backdrop, it’s important to look for signals that some of the world’s largest companies are giving us.
Additionally, since Microsoft Azure, Amazon Web Services, and Google Cloud are three of the world’s largest providers of public cloud infrastructure, it’s possible that these reports contain details about how companies are spending more broadly on technology. Combining the annual revenues of just these businesses (recognising that they are each part of larger companies) we see spending on cloud infrastructure annually in the hundreds of billions of dollars.
We believe that there is a difference between these three large public-cloud infrastructure providers and the much greater number of far smaller Software-as-a-Service (SaaS) providers. These three firms, for instance, are a major part of most market capitalisation-weighted benchmark indices. They are at a point in their life cycles where they should exhibit sensitivity to broad, global economic activity and growth expectations.
What can they tell us? The most important thing that we think the results of the big public-cloud providers can tell us regards trends in broad-based information technology spending on cloud computing. Eventually, the enterprise market will have ‘moved to the cloud’ and the growth rates of these large players should drop significantly. We are not yet there so, in this type of environment, we really want to see the resilience of cloud spending in the face of a tougher economic backdrop. There haven’t been that many economic slowdowns since the genesis of the cloud business model, and there certainly haven’t been sustained periods of inflation or central bank tightening.
What don’t they tell us? The smaller SaaS providers tend to help their customers with much more specific business initiatives. It may be accounting, compliance, cybersecurity, data analysis…the list is becoming endless. These companies are more idiosyncratic, in that their individual results do not translate to broad trends as clearly as the biggest company results would. However, we might see strong spending in cybersecurity, for example, and this may not be as clearly visible in the results of the biggest companies.
Our initial sense is that it is important to remember that, in many cases, businesses transitioning to the cloud is done to create efficiency and to accomplish more while investing either less time, less money or less of both. We think that this overall trend will continue, but it likely won’t continue at the rates seen in recent years if the global backdrop is characterised by a deteriorating economic picture. It’s also the case that many cloud-focused companies have seen their share prices drop significantly in 2022. This doesn’t mean that all the risk is ‘priced-in’ by any means, but it does tell us that the valuation risk of the space is lower relative to the much higher valuations seen towards the end of 2021.
Microsoft
Microsoft is a leader in the cloud space, and it’s important to note that the Azure infrastructure platform is one piece of the overall ‘Intelligent Cloud’ effort. Most attention goes to the year-over-year revenue growth rates, so it is instructive to first ground any discussion in some of the recent quarterly figures, which are shown in year-over-year terms for Azure specifically below1:
30 September 2021: 50%
31 December 2021: 46%
31 March 2022: 46%
30 June 2022: 40%
30 September 2022: 35%
It also helps to look at the overall revenue base to help ground any further thoughts about reasonable growth. While the quarterly results do look at more than the pure Azure revenues, broadening the picture to ‘Intelligent Cloud’, we see that Microsoft’s Intelligent Cloud revenue was $16.91 billion as of 30 September 2021, and that this figure increased to $20.33 billion as of 30 September 2022. This is a quarterly figure, and it is beginning to be quite large, so part of the growth rate deceleration that we may be seeing could be attributed to the size and scale of these figures.
Analysts are seeing Azure customers very focused on optimising their cloud workloads, which helps them to save money, and it’s also the case that there is evidence that customers are pausing on new workloads. It is reasonable to think that, in an environment of slower economic growth, consumption-based business models like public cloud infrastructure may indicate shifts in customer-behaviour toward more essential workloads2.
Amazon
Amazon Web Services (AWS) is the leading public cloud infrastructure platform based on market share, often cited as having a figure around 40% of the total. If we consider the year-over-year growth rates from recent quarters3:
30 September 2021: 39%.
31 December 2021: 40%
31 March 2022: 37%
30 June 2022: 33%
30 September 2022: 27%
Similar to the case of Microsoft, we are seeing decelerating growth rates. However, if we look to 30 September 2021, the trailing 12-month net sales for AWS was at $57.2 billion, and this same figure as of 30 September 2022 is $76.5 billion. These are getting to be quite large numbers.
Also similar to the story with Microsoft, enterprise cloud customers are looking to reduce costs within the AWS ecosystem. Analysts are continuing to note the long-term potential and how this differs from the situation within the shorter-term macroeconomic backdrop4.
Alphabet—Google Cloud in focus
Google Cloud, within Alphabet, does trail both Microsoft Azure and AWS in terms of market share, but Alphabet as a whole runs a formidable, cash-rich business, so they have been known to make large, splashy deals to gain high-profile cloud customers. If we note the year-over-year growth figures5:
30 September 2021: 45%
31 December 2021: 45%
31 March 2022: 44%
30 June 2022: 36%
30 September 2022: 38%
The growth rates are similar to what we noted with Microsoft Azure and AWS, but the dollar figures are much lower. As of 30 September 2021, the quarterly revenue from Google Cloud was reported at $4.99 billion, and then as of 30 September 2022, this figure had grown to $6.87 billion.
It is notable that, while Microsoft and Amazon saw quarter-to-quarter decelerations in growth rates, Google Cloud is cited as a bright spot of growth acceleration in Alphabet’s results. However, we note that Alphabet’s core business was certainly not immune to deteriorating economic conditions, and that the revenue figures are growing from a smaller overall base.
Conclusion: the economy matters but this is not the year 2000
The primary conclusion that we reach at this point is that economic conditions do matter for cloud computing companies. We have already seen their share price performance for 2022; it is crystal clear that market participants have re-assessed the appropriate valuation multiples for these firms considering higher inflation and higher interest rates. We will be watching closely to see how much revenue growth these companies can maintain as they continue to report earnings for the period ended 30 September 2022. The biggest companies, so far, have reported a range of 27% to 38%. It clearly isn’t the euphoric environment of 2020 any longer, but we don’t think it appropriate to say a ‘tech bubble is bursting’ either.
Sources
1 Source: Microsoft’s First Quarter Fiscal Year 2023 Results, 25 October 2022. Revenue figures presented in the generally accepted accounting principles (GAAP) format.
2 Source: Sills, Brad & Adam Bergere. “Expected Azure decel likely temporary, cyclical; model largely derisked.” Bank of America Securities. 26 October 2022.
3 Sources: Amazon’s Quarterly Earnings Conference Call Slides for the specific periods ended: 30 September 2022, 30 June 2022, 31 March 2022, 31 December 2021 and 30 September 2021. The revenue growth figure is taken as the year-over-year growth without foreign exchange adjustment.
4 Source: Post, Justin & Michael McGovern. “Expecting Less this Holiday.” Bank of America Securities. 28 October 2022.
5 Sources: Alphabet’s Quarterly Earnings Announcements which specify the revenues from different business units on a quarterly basis for the periods ended: 30 September 2022, 30 June 2022, 31 March 2022, 31 December 2021 and 30 September 2021. Percentage growth is calculated directly from the figures that Alphabet reports for Google Cloud, all in USD terms.

AMZN WEEKLYRULES:
-If price break Point 2, 4, 6, or 8 cancel the setup
-Price needs to break Point 1, 3, 5, or 7 to confirm the setup
When price reach the 100FE(BLUE BOX) it normally does a pullback/retest or reversal
The market can Truncate(fall short)

AMAZON Resistance Ahead! Sell!
Hello,Traders!
AMAZON is trading in a downtrend
But the pair has recently went up
To retest the horizontal resistance
From where a bearish
Continuation is likely
Sell!
Like, comment and subscribe to boost your trading!
See other ideas below too!

BTC ; WORSssst case scenario ; weird amazon destruction fractal BTC ; WORSssst case scenario ; weird amazon destruction fractal
pretty bloody self explanatory
thought id throw this up after seeing victor cobra touch on it in his vid. interestingly disgusting fractal. hopefully its wrong lol

ABCD Harmonic Pattern on AmazonNASDAQ:AMZN
Bullish ABCD Harmonic Pattern on Amazon in current move, implying bullish move.
2 bullish candles formed recently may extend its rally towards 106 at 38.2% fib level.

AMZN LongI am bullish on AMZN.
My trade levels:
Entry price: $95.51
Take profit: $109.31
Stop loss: $90.55
Risk/reward: 2.78

Smart and fast trade on amazonAmazon reached a support area where there will be a strong buyer
Entry is done by putting a stoploss as shown in the graph .
For further more wait for our updates .
AMAZON WITH ITS EXPANDING CHANNEL AND BULLISH BREAKOUT📈The following expending channel confirms a bullish breakout and here we can expect the price to do a bullish reversal with the confirmation spotted where we may revisit the levels close to 120 one more time.
Thanks for visiting my tradingview profile. Hope the chart update helps you out. If you like the content do hit the thumbs up and follow me for future updates. 🙌🏻😎
📌For more details regarding this chart update, please message me on tradingview chat. Thank you!

Three stocks to watch during the ‘January Effect’ January has been historically a good month for stocks as some investors reenter the market after selling some of their holdings at the end of the year. The bullishness at the start of each year is dubbed the ‘January Effect’.
On January 6, US stocks staged their first big rally of the year, with the Dow Jones Industrial Average closing 2.13%, the S&P 500 jumped 2.28% and the Nasdaq Composite gaining 2.6%.
It marked the best day for the Dow and the S&P 500 since November 30, 2022, and for the Nasdaq since December 29, 2022.
The rally could also be triggered by investors using their year-end cash bonuses to splurge into risky investments in January. With this in mind, we have rounded up three US stocks to watch in January:
Amazon.com
JP Morgan recently stated that Amazon remains its top internet pick, forecasting that the e-commerce giant will overcome macroeconomic headwinds by 2023. However, Amazon is no exception to the wave of layoffs in the tech space over the past year. The tech behemoth disclosed last week that is laying off 18,000 jobs, more than previously planned.
“Several teams are impacted; however, the majority of role eliminations are in our Amazon Stores and organizations,” Amazon CEO Andy Jassy said in a blog post on January 5.
But it is worth noting that Amazon remains the United States’ second-largest private employer next to Walmart. Amazon’s stock jumped 2.9% on Tuesday and 5.8% on Wednesday.
Tesla
Tesla recently applied to expand its Gigafactory in Texas with a $775.7 million investment, Reuters reported, citing filings with the Texas state department of licensing.
The investment plan comes despite Tesla missing delivery estimates in the fourth quarter of 2022. The company delivered 405,278 electric vehicles in the three months ended December 31, up 40% from a year earlier, but missing Elon Musk’s 50% growth target.
Tesla’s stock is also susceptible to its volatile CEO. The billionaire — who recently made it to the Guinness World Records for suffering the largest loss of personal fortune in history after shedding about $182 billion since November 2021 — has drawn attention from the federal government again after tweeting about disabling driver monitoring. The National Highway Traffic Safety Administration said the issue is now part of a wider investigation into accidents involving at least 14 Tesla vehicles while using the Autopilot driver assist system.
Tesla rose 3.7% on Wednesday after falling by 1.6% on Tuesday.
McDonald's
McDonald's Corp. (NYSE: MCD) is another stock to watch in January after the largest fast-food company in the world announced that it is planning a restructuring that would result in corporate job cuts. The company told employees in a memo that it will “evaluate roles and staffing levels… and there will be difficult discussions and decisions ahead.”
In the quarter ended September 30, 2022, McDonald’s net income fell 8% year over year to $1.98 billion, or $2.68 per share, as revenue slipped 5% to $5.87 billion.
MCD closed up 0.6% on Tuesday but closed flat on Wednesday.

Amazon Analysis 10.01.2023Hello Traders,
welcome to this free and educational analysis.
I am going to explain where I think this asset is going to go over the next few days and weeks and where I would look for trading opportunities.
If you have any questions or suggestions which asset I should analyse tomorrow, please leave a comment below.
I will personally reply to every single comment!
If you enjoyed this analysis, I would definitely appreciate it, if you smash that like button and maybe consider following my channel.
Thank you for watching and I will see you tomorrow!

amazon forecat with target with stop lossamazon inc next year .
we must take care of the stoploss indicated in the chart .

Multi-Month long idea on AmazonAmazon has been beaten down hard this year and I think its time to start scaling in long. Multiple factors are coming into play here as we approach the white line. I plan to start a 1/4th of a total long term position at the white line. As the chart develops and amazon makes its moves, I will update this post as to where I am adding to this long position (if I add).

Amazon Set Up To Target $60In this update we review the recent price action in Amazon and identify the next high probability trading opportunity and price objective to target

AAPL - Price Targets & Stop Loss📈 What’s up investors! 📉
Welcome back to another one of
💡“Mike’s Ideas”.💡
I post as I find signals… these signals are based on the personal rules I have built and follow in order to make up what I call the “SST Strategy”. Follow for more ideas in the future!!
I have 4 levels marked and colour coded on the Chart.
These levels are:
⚪ White = Entry Point
🔴 Red = Stop Loss
🟢 Green = 1.2:1 Risk Reward Ratio
🟡 Yellow = 1.5:1 Risk Reward Ratio
🔵 Blue = 2:1 Risk Reward Ratio
👀 So what are we looking at today…!!!
🚨( AAPL ) Apple Inc..🚨
Apple Inc. designs, manufactures, and markets smartphones, personal computers, tablets, wearables, and accessories worldwide. It also sells various related services. In addition, the company offers iPhone, a line of smartphones; Mac, a line of personal computers; iPad, a line of multi-purpose tablets; and wearables, home, and accessories comprising AirPods, Apple TV, Apple Watch, Beats products, and HomePod. Further, it provides AppleCare support and cloud services store services; and operates various platforms, including the App Store that allow customers to discover and download applications and digital content, such as books, music, video, games, and podcasts. Additionally, the company offers various services, such as Apple Arcade, a game subscription service; Apple Fitness+, a personalized fitness service; Apple Music, which offers users a curated listening experience with on-demand radio stations; Apple News+, a subscription news and magazine service; Apple TV+, which offers exclusive original content; Apple Card, a co-branded credit card; and Apple Pay, a cashless payment service, as well as licenses its intellectual property. The company serves consumers, and small and mid-sized businesses; and the education, enterprise, and government markets. It distributes third-party applications for its products through the App Store. The company also sells its products through its retail and online stores, and direct sales force; and third-party cellular network carriers, wholesalers, retailers, and resellers. Apple Inc. was incorporated in 1977 and is headquartered in Cupertino, California.

AMAZON - Strong Again! 📦Hello TradingView Family / Fellow Traders. This is Richard, as known as theSignalyst.
on WEEKLY: Left Chart
AMZN is sitting around a strong support in green 80.0. For the bulls to take over long-term, we need a break above the blue zone AND upper blue trendline.
Meanwhile, since we are around a support zone, we will be looking for buy setups on lower timeframes.
🏹on H4: Right Chart
For the bulls to take over, we need a break above the red channel and previous major high in red.
Meanwhile, until the buy is activated, AMZN can still trade lower inside the weekly support.
📚 Always follow your trading plan regarding entry, risk management, and trade management.
Good luck!
All Strategies Are Good; If Managed Properly!
~Rich
