AMZN AnalysisPrice is on a downtrend. Seems like a wyckoff accumulation schematic has started with a change in character. However, price has created sell-side liquidity with a bullish POI nearby. I'm expecting a short term bearish move to take the liquidity and tapping into the bullish POI before we see any uptrend.
Amazon

AMAZON Falling to 90?I see a perfect Wyckoff Distribution Pattern, testing the resistance 2 times (B and C), to immediately crossover a 2 years support. Now it seems to be stabilized but in my opinion the price will fall to 80 in the next days/weeks


AMZN Bearish pattern on 1D chartHey everybody welcome back
Today we’re looking at AMZN on the daily chart and it’s forming a very nice head and shoulders pattern.
I actually got in some puts at the top of the right shoulder and took profits already. I opened a new put position just before the bell.
You can see price was rejected at key levels same as the left shoulder. We’ll see if support will hold at the neckline.
If you look into the smaller time frames you can see the down channel of the right shoulder. Price is hitting the resistance of that down channel and has formed a triangle pattern.
My target is at the neckline and whether it holds or breaks support will determine our next position.
Thanks for tuning in.
Let me know how you feel about this and share your ideas
*This is not advice

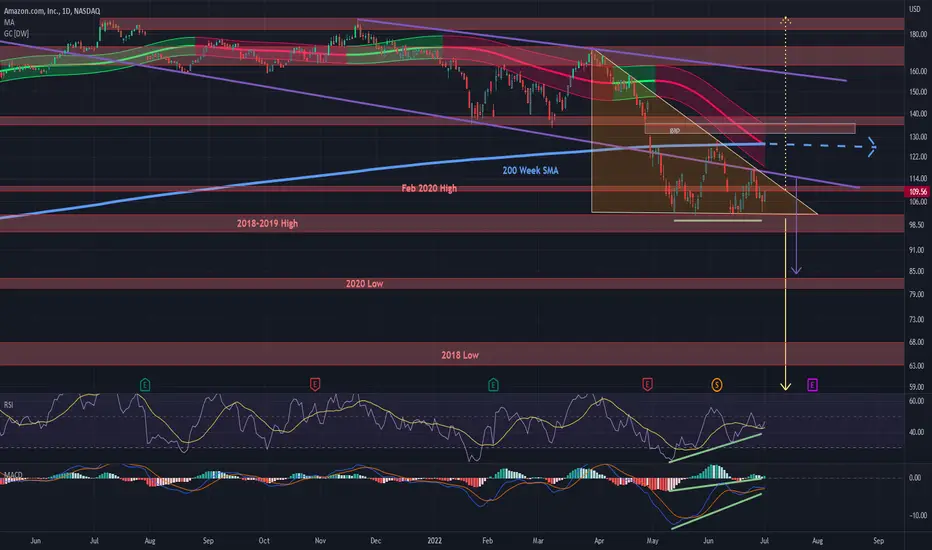
AMAZON Nearing Big MoveAmazon is giving mixed signals but the bias is toward the downside, especially with S&500 and NASDAQ looking not so good. Descending triangles are usually bearish. The descending channel's support line has been broken, and just like with the gaussian channel and 200 week SMA, flipped into resistance. Bullish divergences on the RSI and MACD suggest a pump but one of the troubles with divergences is sometimes their result is lackluster. Thus a small rally to the descending traingle resistance line might be all it means. They are also exaggerated divergences which are usually less reliable than regular ones. But it could also do enough to invalidate the triangle and form some sort of W bottom. There is also a gap overhead but it doesn't mean it will get filled soon. Targets for the descending triangle are the 2021 high or the 2018 low. We'll have to wait and see where it breaks.
Amazon | Fundamental Analysis | LONG Down 29% over the year, the Nasdaq Composite Index is in a bear market, so now is potentially a good time to bet on quality companies trading at a low price. Amazon, which just completed its long-awaited stock split, could be a good fit. Here are a few reasons why the e-commerce giant can expect long-term success.
The stock is relatively cheap
A stock split is when a company divides the number of its shares by a predetermined number without changing the market value (the value of all shares outstanding). Although a stock split does not affect fundamentals, it makes the stock cheaper and psychologically more attractive to small investors. Nevertheless, Amazon's June 6 split came at the end of a massive 35% year-over-year decline. So (at least in this case) the stock is now relatively cheaper in both price and valuation.
With a market value of $1.2 trillion, Amazon is trading at just 2.4 times its 12-month earnings. And while that figure is in line with the S&P 500 average of 2.4, it is significantly lower than that of similar Nasdaq companies, which have an average price-to-earnings ratio of 4.5. Amazon's projected price-to-earnings ratio of 55 also looks reasonable, given the potential for significant earnings growth over the long term.
Cloud computing is running at full throttle
So why does Amazon deserve a healthy bottom line? Hint: It's not about its core e-commerce business. While third-party online marketplaces and related services (such as Prime subscriptions) currently form the backbone of Amazon's revenue, its cloud computing business, Amazon Web Services (AWS), looks set to deliver revenue growth for decades to come.
Amazon's first-quarter net sales rose only 7% year over year to $116.4 billion because of weakness in its North American and international e-commerce segments. According to company executives, both geographic segments may have expanded too much during the pandemic boom and now face overstaffing and overcapacity. Amazon's cloud segment, however, is bucking that trend.
AWS revenue jumped 37% to $18.4 billion and operating income rose 57% to $6.5 billion, compared with a loss of $2.8 billion on the company's e-commerce operations. While it's unclear whether Amazon's cloud business will maintain its trajectory, analysts at research firm Redburn are extremely optimistic, predicting that AWS will eventually be worth $3 trillion just because of its advantages in scale, cost, and technology over its competitors.
Other divisions could contribute to the growth
Amazon's success has been based on its ability to move into synergistic industries to drive growth. First, it was an online bookstore, then a one-stop e-commerce marketplace, and finally a diversified technology platform that gets most of its profits from cloud computing. Other types of businesses may be on the line.
According to Business Insider, Amazon has become the third-largest digital advertising company (behind Alphabet's Google and Meta Platforms' Facebook), with $31 billion in ad revenue in 2021. Amazon is also going deeper into streaming directly to the consumer through its $8.5 billion acquisition of MGM Studios. This deal could add thousands of movie and TV series titles to Prime Video's content portfolio, allowing the company to compete with streaming competitors for unique and original content offerings.
Amazon's scale allows it to discover value in industries related to its core business, laying the groundwork for further expansion. Will the company become the next Netflix or Google? Who knows. But given its track record of success in various industries, don't bet against it.

AMAZON close to the round number 📖💡🚀Hello 🐋
Based on the chart after a long time, correction to the downside the price is close to the round number $100, major support and the channel support ✔️
if
the price doesn't break the round number and the major support to the downside we will see gain from here beside, the range market is an acceptable scenario too 📖💡🚀
otherwise
we can see more gain from the previous low ❌🧨
Please, feel free to share your point of view, write it in the comments below, thanks 🐋

AMAZONAMAZON Chart:-
Price is trading in a Support Level .
Price is taking a support of 300MA
Price just give a breakout at any side.
Price when comes to buy zone must buy it for 2-4 months
Buy 102$, 85$ ,75 $
SL:- No Need
TP:- $122 ,$139
#follow it
#keep motivated
#YouDo

$AMZN Amazon Head & Shoulder Pattern? Let's talk about the obvious head & shoulder pattern on the Amazon daily chart and why it isn't a true textbook head and shoulder pattern.
(please don't come for me, this is just my opinion lol)
1. a Head & Shoulder is made during an uptrend.
This one on $amzn was created on a downtrend.
2. the VOLUME on the left shoulder should show highest green volume bar on.
This one on $amzn does not. The head has the highest green volume bar.
3. Amazon is showing significant strength here at support and could potentially break-out of the ascending trend it is was previously rejecting.
Amazon is a leading e-commerce retailor but lets not forget about its web services and infrastructure as well.
I'd also like to point out that if you ZOOM OUT of the daily, we just completed a Wyckoff distribution top pattern and has already achieved the full measured move down.
The market cannot be trusted these days and it is still very much possible for Amazon to drop lower. I have included 2 support and resistance zones for upside and downside trading (also a GAP marked above in RED).
This is not financial advise, just some observations.
Happy Trading =)

AMAZON Will Go Down! Sell!
Hello,Traders!
AMAZON has formed a bearish triangle
And the stock is also trading in a downtrend
Thus, I am bearish biased
And IF a bearish breakout happens
Then it is safe to say
That the stock will retest lower demand levels
Sell!
Like, comment and subscribe to boost your trading!
See other ideas below too!

SELL $AMZNBearish pattern on $AMZN with 1:2 RRR supported by the 75bps fed possible hike in July as inflation surges.

Bear Markets are Tough, If in Doubt Zoom Out!Looks like there is a little more upside after todays bullish close. Then the inevitable will happen... Eventually lol! This market is very frustrating at times but when I'm in doubt, I remind myself to zoom out! Looks like we have been trading in this falling wedge since right after the end of March relief rally when we tried to reclaim the 200 SMA. My thesis is that we have not traded narrowly enough in this wedge for a real break out to occur. We had a very similar bear market rally starting at my 1st finger I have charted, 24th of May. During that rally we pushed up about 12% or 1400 points, 12% up from last Thursdays low would get us up to the top of my second lower high circled. I am waiting for a rejection around this last move up to the 13,700 range I have circled before I open up a bigger short position on QQQ, by then we should be overbought and trading around 300-310 range. If this plays out I will take profit at the bottom of this wedge and keep some protective puts in my back pocket as I attempt to catch a falling knife cost averaging in to potentially catch a BIG rally into the GOOGLE split!
Feel free to give me your feedback, I am very new at charting and appreciate constructive criticism. Good luck and safe trading to you all!
-Jake T
NASDAQ:QQQ
NASDAQ:NDX

AMZN 45 min - Daily View + Bearish Breakout and retesting same level of 100.22 can push price more downward to lower levels.
+ Bullish short term trend can be implemented if 110.77 is broken, but a retest of this level and a price action of bearish momentum in this zone can again push price lower to same previous levels as 102.86 ( Orange path )
Disclaimer .
Do NOT trade or invest based upon the analysis presented on this channel. Always do your own research and due diligence before investing or trading. I’ll never tell you what to do with your capital, trades or investments. I’ll also never recommend for you to buy, sell, long or short any asset, commodity, security, derivative or cryptocurrency related instrument as it's extremely HIGH RISK! You should always consult with a professional/licensed financial adviser before trading or investing in any cryptocurrency related product.

Bulls Beware of the Super Scary Monster appearing on the chart! Looking at the daily chart on Amazon I spotted a very Super Scary Monster starting to appear that should put all longs on alert. The shorts are packing the bus and the monster will take hold and drag price down with it. Bulls Beware and good luck to the shorts! Let's GO!!!

Time for a bounce on AmazonAmazon
Short Term
We look to Buy at 105.87 (stop at 100.99)
Preferred trade is to buy on dips. The reaction higher is positive and highlights a clear reversal. Previous support located at 100.00. Risk/reward is ample to call a buy trade.
Our profit targets will be 116.09 and 125.19
Resistance: 129.00 / 135.00 / 170.00
Support: 100.00 / 85.00 / 67.27
Disclaimer – Saxo Bank Group. Please be reminded – you alone are responsible for your trading – both gains and losses. There is a very high degree of risk involved in trading. [/b The technical analysis, like any and all indicators, strategies, columns, articles and other features accessible on/though this site (including those from Signal Centre) are for informational purposes only and should not be construed as investment advice by you. Such technical analysis are believed to be obtained from sources believed to be reliable, but not warrant their respective completeness or accuracy, or warrant any results from the use of the information. Your use of the technical analysis, as would also your use of any and all mentioned indicators, strategies, columns, articles and all other features, is entirely at your own risk and it is your sole responsibility to evaluate the accuracy, completeness and usefulness (including suitability) of the information. You should assess the risk of any trade with your financial adviser and make your own independent decision(s) regarding any tradable products which may be the subject matter of the technical analysis or any of the said indicators, strategies, columns, articles and all other features.
Please also be reminded that if despite the above, any of the said technical analysis (or any of the said indicators, strategies, columns, articles and other features accessible on/through this site) is found to be advisory or a recommendation; and not merely informational in nature, the same is in any event provided with the intention of being for general circulation and availability only. As such it is not intended to and does not form part of any offer or recommendation directed at you specifically, or have any regard to the investment objectives, financial situation or needs of yourself or any other specific person. Before committing to a trade or investment therefore, please seek advice from a financial or other professional adviser regarding the suitability of the product for you and (where available) read the relevant product offer/description documents, including the risk disclosures. If you do not wish to seek such financial advice, please still exercise your mind and consider carefully whether the product is suitable for you because you alone remain responsible for your trading – both gains and losses.

AMAZON on a boost. Won't reach the split price though.I have tested this 6 different ways and included my new "Mass EFX moving averages" indicator.
All I'm seeing is that $amazon is on a rise rightnow since June 17th @ 11:30 pm Central ime.
It will continue to rise to $109.00 and maybe a spike to $112 00
Current price 8s $106.xx
Stoploss = 104.03
Entry 106.16
According to my rsi formula:
Exit = $110.37 (after move momentum expires)
Safe exit is $109.99
Business banks trade in whole numbers, let's move to the closest whole dollar (110.00)
This is a 3.5% move

am I drinking too much hopium?! lol AMZN nice little set up hereNASDAQ:AMZN
Amazon is sitting right near support/resistance level that goes way back.
since the split that level is now right around 101
as you can see we have just recently bounced off this level and came back down and tested it again
taking longs in this market is risky period but i believe you can set your stop tight enough if think we could see a bullish short term reversal
if we break the 101 level we have a lot of downside so in reality you could potentially play it both way if you just keep this ticker on your watchlist!
good luck and happy trading !
side note...this ticker is showing both bearish and a bullish divergence. i noted the bullish divergence because it has yet to be played out.

AMAZON Risky Long! Buy!
Hello,Traders!
AMAZON fell down sharply
And is trading at -45% from the all-time-high
Which means that the stock has made a good correction
And is trading at the price reflecting its fair value
So as the price is retesting a weekly horizontal support
I am locally bullish and IF there are no more bad news
I will be expecting at least a local rebound from the level
Buy!
Like, comment and subscribe to boost your trading!
See other ideas below too!

Amazon: Triple Bottom!!Amazon
Short Term - We look to Buy a break of 106.50 (stop at 99.65)
We are trading at oversold extremes. 100.00 continues to hold back the bears. This is positive for sentiment and the uptrend has potential to return. Posted a Triple Bottom formation. Further upside is expected.
Our profit targets will be 124.82 and 130.00
Resistance: 125.00 / 138.00 / 170.00
Support: 100.00 / 90.00 / 66.50
Please be advised that the information presented on TradingView is provided to Vantage (‘Vantage Global Limited’, ‘we’) by a third-party provider (‘Signal Centre’) . Please be reminded that you are solely responsible for the trading decisions on your account. There is a very high degree of risk involved in trading. Any information and/or content is intended entirely for research, educational and informational purposes only and does not constitute investment or consultation advice or investment strategy. The information is not tailored to the investment needs of any specific person and therefore does not involve a consideration of any of the investment objectives, financial situation or needs of any viewer that may receive it. Kindly also note that past performance is not a reliable indicator of future results. Actual results may differ materially from those anticipated in forward-looking or past performance statements. We assume no liability as to the accuracy or completeness of any of the information and/or content provided herein and the Company cannot be held responsible for any omission, mistake nor for any loss or damage including without limitation to any loss of profit which may arise from reliance on any information supplied by Signal Centre.


AMAZON SHORT 20 TIMESHi Everyone,
After the split, short 20 Times.
Entre 121,00
Stop= 151, 00
TP1= 100,00
TP2= 85,00
Many "profesionals" looking for long side.
Good Bye & Good Trading!!!


