11/15-11/19 watchlist #3 $SHOP $1650, $1620 BOUNCE
Price targets: $1675, $1700
Technical Analysis: All-time high breakout & momentum bounce
News Catalyst: "In a week of whipsaw or negative action in many highflying stocks, Shopify stock made a powerful move Friday, clearing a trend line break in huge volume, offering an early entry in the morning and ultimately clearing the 1,650 Buy point" - Investor's Business Daily
Amazon

Investment grade Buy see chart. Buy the fear sell the hype. This asset is well below its 5 year average price, is a great company in a market in its infancy. Buy some for your grand kids.
AMAZON failed to break the resistanceAMAZON failed to break the key level of a long range which may lead to huge dip with all new investors that came last year.
Old investors were distributing their stocks to new ones for a very good price.
The short position is possible.
The best buy opportunity is at or around trend line.


Important Trend Line!Money Makers!
Rivian has finally been launched on the NYSE. This trend line shown will be very important over the next few days, especially when we're able to use options. If it breaks below, that will be one of the first bearish signs and I'm sure there's a lot of bears waiting to take advantage. This project is currently backed by Amazon & Ford. With that being said with the pettiness between Elon and Jeff. I wouldn't be surprised if this project keep moving higher. Tesla is currently 10x Rivians price and I'm sure Jeff wants to catch up but that's just my opinion.
Love it or hate it, hit that thumbs up and share your thoughts!
It's all about Market structure, Area of value, and Entry Trigger.
Don't trade with what you're not willing to lose. Safe Trading Calculate Your Risk/Reward & Collect!
This is not financial advice.


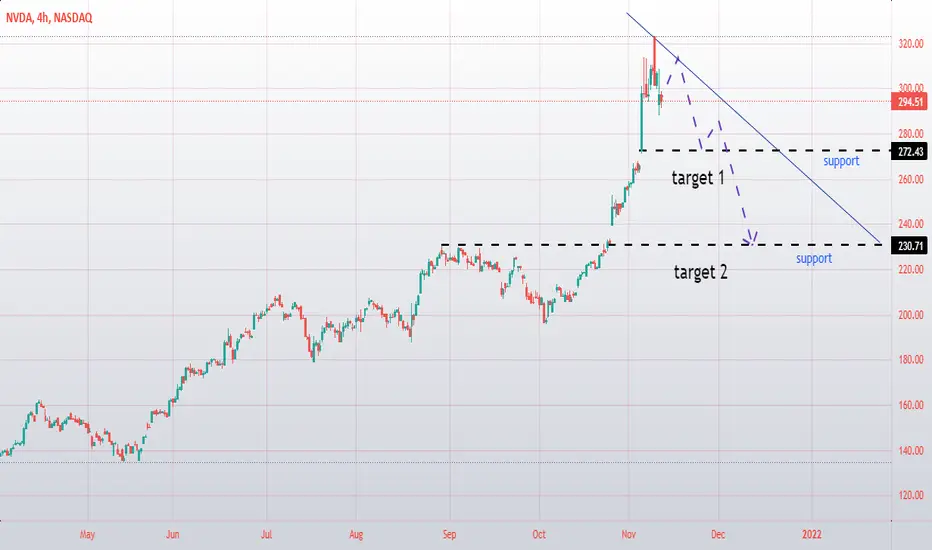
NVIDIA targets 1 and 2the price went up for too long. I expect a strong correction to targets 1 and 2. reaching target 2 will be more difficult.
Apple*s necka double top has formed on the chart. waiting for the fall to the line of the neck(support)

Rivian IPO Ponzied - Story Telling FOMO - Show Me Revenues!!Rising rates kill crypto & stonks dreamers. Small cap gems win. For next decade. US10Y on the up. #cannabisreform. Volatility SPIKE - large caps to small cap Quality VALUE gems. Revenue GROWTH matters!! #valuation
Jobs & Justice
$KERN has the DATA!

third wave!the price has formed the first wave and now the formation of the second wave is over - a five-wave correction. Now the price is ready to fall down (third wave). goal 130 $


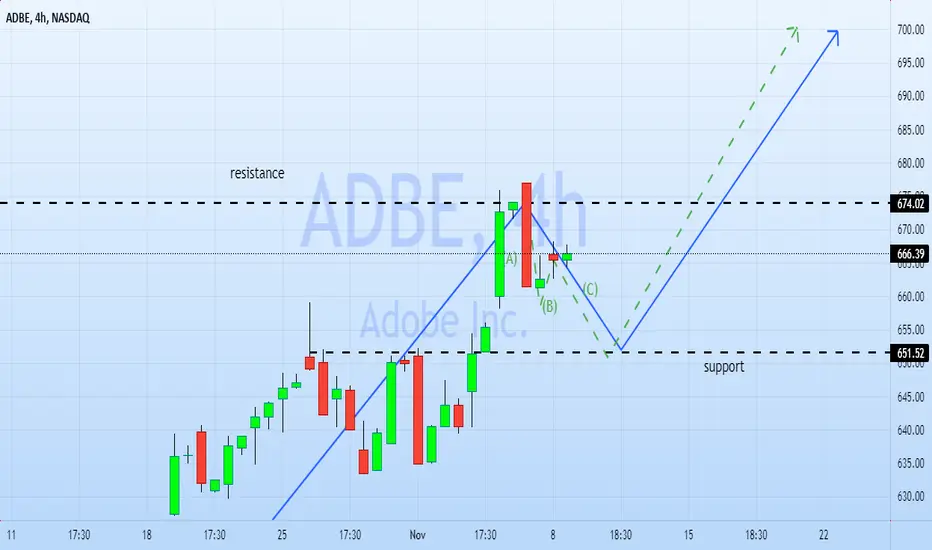
target is still around $700the price reached support and bounced off it. target is still around $700

waiting for a correctionAMD went up for a long time, forming new highs. Now the price needs to gain strength for a new rise, so I am waiting for a correction and a rebound from the level..

correction A-B-Cthe price draws a correction A-B-C, which will only add strength to the subsequent rise. The goal is the same, only you need to wait for a rebound from support
✅AMAZON WILL FALL|SHORT🔥
✅AMAZON is retesting a strong daily resistance level
And despite the market going up, the bulls were quite weak in this stock lately
Which indicated an underlying weakness
So as the price is at the resistance level
A local bearish reaction seems likely
With the retest of the local rising support
SHORT🔥
✅Like and subscribe to never miss a new idea!✅

AMZN 1D Cheat sheet
A quick visual reference for all you day traders out there. This is personally one of my favourite sets of indicators as together they provide strong signals to possible future price action.
Enjoy, and happy trading.
