Amazon I Strong Bullish Outlook Welcome back! Let me know your thoughts in the comments!
** Amazon Analysis - Listen to video!
We recommend that you keep this pair on your watchlist and enter when the entry criteria of your strategy is met.
Please support this idea with a LIKE and COMMENT if you find it useful and Click "Follow" on our profile if you'd like these trade ideas delivered straight to your email in the future.
Thanks for your continued support!Welcome back! Let me know your thoughts in the comments!
Amazonlong

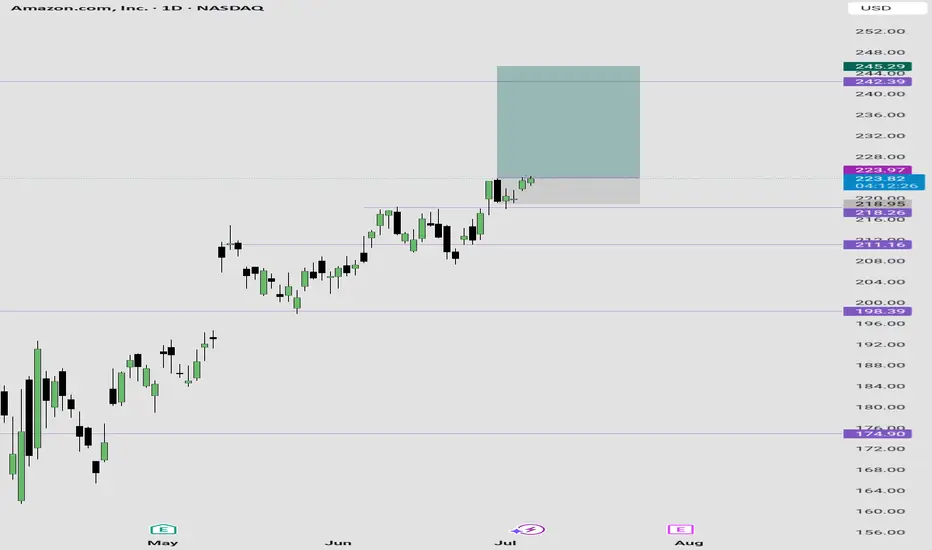
Amazon Long IdeaBuying Amazon shares here...
Reason:
Bouncing off support with good bullish price action candles.
I expect the price to reach $245 per shares between now and next week Friday....
My stop loss price is on the chart.
AMAZONAMZN is getting ready for another push towards 230 level.
Disclosure: We are part of Trade Nation's Influencer program and receive a monthly fee for using their TradingView charts in our analysis.

WHAT A LOVELY BULLISSH GAP ON AMAZON: A 4RR PROFIT TRADE CLOSEDI just closed this beautiful 4RR trade on Amazon.
The trade was entered last week, this new week market open Gap pushed the price high to my 4RR target.
Trade Idea;
The monthly is extremely bullish.
The weekly is also bullish.
Daily is bullish as well, so i entered on the daily time frame pull back swing low.
Result?
A beautiful 4RR profits trade.
Next Action?
I will wait till the daily frame correct and form a swing low before entering for a bullish trend continuation buy.

AMAZON I Technical Forecast Welcome back! Let me know your thoughts in the comments!
** Amazon Analysis - Listen to video!
We recommend that you keep this pair on your watchlist and enter when the entry criteria of your strategy is met.
Please support this idea with a LIKE and COMMENT if you find it useful and Click "Follow" on our profile if you'd like these trade ideas delivered straight to your email in the future.
Thanks for your continued support!Welcome back! Let me know your thoughts in the comments!

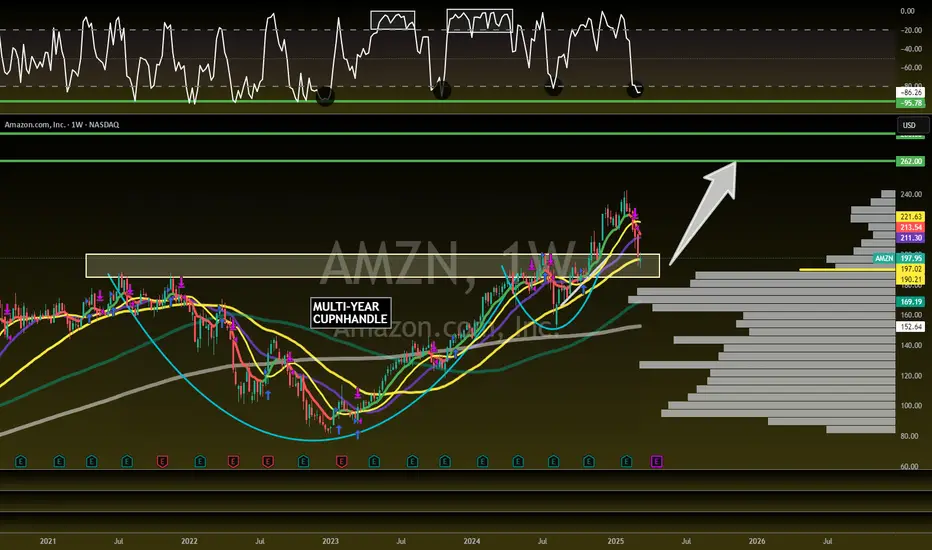
Amazon is about to DELIVER! 32% UpsideNASDAQ:AMZN
Great Risk/Reward here!
Confirmation of Retest = 🎯$262
- Right at CupnHandle Retest area
- Volume Shelf Support
- 50WMA
- Wr% Green Support Beam
Not financial advice
Amazon (AMZN) Stock Analysis & ForecastAmazon (AMZN) Stock Analysis & Forecast
The U.S. stock market has experienced a notable downturn recently, and Amazon (NASDAQ: AMZN) is no exception. Currently trading at $228, I am closely monitoring the stock for a potential pullback to $220, where I plan to enter.
Entry Strategy
My entry point of $220 is based on a confluence of key technical levels:
An ascending trendline indicating ongoing bullish momentum.
A horizontal support level, reinforcing this area as a strong demand zone.
Target & Exit Strategy
If fundamental catalysts align in my favor, my price target (TP) will be the all-time high (ATH) zone around $240, with the potential to extend beyond.
As always, risk management remains a priority—trade cautiously and adapt to market conditions.

amazon stock in the next dayswhere to get amazon stock with the best prices ???
will amazon stock go up in the next days?\
amazon is a great stock that we must have
you can get this stock and see the stop we must have and get in our stock

Amazon I Detailed analysis and trading plan Welcome back! Let me know your thoughts in the comments!
** Amazon Analysis - Listen to video!
We recommend that you keep this pair on your watchlist and enter when the entry criteria of your strategy is met.
Please support this idea with a LIKE and COMMENT if you find it useful and Click "Follow" on our profile if you'd like these trade ideas delivered straight to your email in the future.
Thanks for your continued support!Welcome back! Let me know your thoughts in the comments!

Amazon (NASDAQ:$AMZN) Slides 4% Amidst Cloud Growth SlowdownAmazon (NASDAQ: AMZN) shares slid nearly 4% in pre-market trading on Friday, as investors reacted to a slowdown in the company's cloud growth and a subdued sales forecast for the current quarter. The dip comes despite strong performance in Amazon's retail segment and a broader technical breakout that suggests the stock may be poised for a significant upward move in the coming months. Let’s dive into the technical and fundamental factors driving Amazon’s current market dynamics and why this dip could be a buying opportunity for long-term investors.
Cloud Growth Slowdown Weighs on Sentiment
Amazon Web Services (AWS), the company’s cloud computing division and a key profit driver, reported a 19% year-over-year revenue increase to $28.79 billion for the quarter. While this growth is impressive, it fell slightly short of analyst expectations of $28.87 billion, according to LSEG data. This miss has raised concerns about the competitive pressures AWS faces from rivals like Microsoft Azure and Google Cloud, as well as emerging low-cost competitors such as China’s DeepSeek.
Technical Outlook
From a technical perspective, Amazon’s stock chart tells an intriguing story. As of Friday’s pre-market trading, AMZN was down 2.78%, but the stock recently broke out of a falling trend channel, signaling a potential reversal of its previous downtrend. While the stock has yet to capitalize on this breakout, the current dip could be interpreted as a "shakeout" before a significant upward move.
Key technical indicators support this bullish thesis:
- Relative Strength Index (RSI): The RSI remains strong at 60, indicating that the stock is neither overbought nor oversold and has room to climb.
- Moving Averages: AMZN is trading well above its 50-day, 100-day, and 200-day moving averages, a sign of strong underlying momentum and bullish sentiment.
This technical setup suggests that the pre-market dip may be a temporary pullback rather than the start of a sustained downtrend. For traders and investors, this could present an attractive entry point.
Strong Revenue and Earnings Growth
Amazon’s financial performance in 2024 has been impressive, with revenue reaching $637.96 billion, a 10.99% increase compared to the previous year’s $574.79 billion. Earnings surged by 94.73% to $59.25 billion, reflecting the company’s ability to scale profitability even as it invests heavily in growth areas like AI and cloud infrastructure.
The company’s 12-month forward price-to-earnings (P/E) ratio of 37.3 is higher than peers like Alphabet (22.7) and Microsoft (30.1), but this premium is justified given Amazon’s diversified business model, dominant market position, and long-term growth potential.
Analyst Sentiment: Strong Buy Rating
Wall Street remains overwhelmingly bullish on Amazon. According to 43 analysts, the average rating for AMZN stock is a "Strong Buy," with a 12-month price target of $254.3, representing a 6.48% upside from the latest price. At least seven brokerages raised their price targets following the earnings report, bringing the median target to $260.
Analysts are optimistic about Amazon’s ability to navigate near-term challenges and capitalize on long-term growth opportunities in AI, cloud computing, and e-commerce. The company’s heavy investments in AI infrastructure, while weighing on margins in the short term, are expected to pay off handsomely in the coming years.

AMAZON - preparation for the Christmas Rally?Hi , dear traders we are watching how Amazon has formulated a very strong assending channel, currently their financials have been doing amazing and we are approaching the Christmas Rally and the finalization of the Q4 earnings. Their recent announcment that they would do heavy investing in AI would be extremely beneficial for the company and sould conclude the continuation of their bullrun.
Entry at 201$
Target 235$

Amazon Reaches New All-Time High: Should You Buy Now...?AMAZON has successfully surpassed its previous all-time high and has maintained a position above this critical level. This upward momentum presents an opportunity for traders to consider entering a long position on a pullback. A strategic entry point for this trade could be set at $235.50, where we can potentially capitalize on a rebound as the stock stabilizes. It's essential to monitor volume and market sentiment during this pullback to ensure a favorable risk-to-reward ratio for the trade.

Nancy Pelosi bought Amazon Calls! 📈 Bullish Opportunity: Amazon (AMZN)
1️⃣ Bullish Flag Pattern with Premarket Breakout:
Amazon has formed a classic bullish flag pattern, which is a reliable continuation signal in an uptrend. The price has already broken out of the flag channel in the premarket session, signaling strong bullish momentum and potential for significant upside.
2️⃣ Amazon’s Cloud Leadership is Poised to Strengthen:
AWS (Amazon Web Services) continues to lead the cloud infrastructure market, controlling 33% of the market—more than Azure and Google Cloud combined, according to Canalys.
CEO Andy Jassy noted four consecutive quarters of reaccelerating AWS growth, with an annualized revenue run rate of $110 billion.
3️⃣ AI Advancements Reasserting Dominance:
While Microsoft is seen as the leader in the AI revolution, Amazon is catching up fast. Over the past 18 months, AWS released nearly twice as many machine learning and generative AI features as competitors combined.
These advancements are expected to make Amazon a leader in AI throughout 2025, further enhancing its cloud and technology business.
4️⃣ E-commerce Profitability Soaring:
CEO Andy Jassy’s focus on cost-cutting and logistics efficiency is delivering results:
Operating income in Amazon’s North American e-commerce segment grew by 87% in the first nine months of 2024.
Automation advancements, like robotics in fulfillment centers, have reduced processing times and improved cost efficiency by 25% during peak times.
These measures are driving higher profitability in its flagship e-commerce business, helping Amazon increase margins and drive long-term growth.
5️⃣ Undervalued and Strong Growth Potential:
Simply Wall Street estimates Amazon is trading at 40.5% below fair value, offering an attractive entry point for investors.
6️⃣ Smart Money Confidence:
Nancy Pelosi recently purchased Amazon calls 3 days ago!
7️⃣ Analyst Ratings:
Consensus: Strong Buy from top analysts.
Average Price Target: $245 (near-term expectations).
High Price Target: $280 (bullish scenario).
🎯 Strategy:
Enter now : $225.94 - $228.50
First Target : $240 (First resistance after breakout).
Second Target : $260 (Measured move from the flagpole).
Third Target : $280 (High-end analyst expectations).
Stop Loss: Based on the risk management.

AMAZON - Next day delivery of GAINS!NASDAQ:AMZN 📦
🔹Green H5 Indicator
🔹9ema Bullish Cross
🔹Bull Flag
🔹Bullish Wr%
🔹Volume Shelf Launch
🎯$233🎯$243 before March! ⏲️
Not financial advice

Amazon - The +150% All Time High Breakout!Amazon ( NASDAQ:AMZN ) is hugging the previous all time high:
Click chart above to see the detailed analysis👆🏻
Amazon has been moving sideways for almost four years, consolidating between support and the previous all time high. After retesting the resistance over and over again, it is just a matter of time until Amazon will break the previous all time high and start its next major bullish cycle.
Levels to watch: $190, $500
Keep your long term vision,
Philip (BasicTrading)

Amazon - This Could Be The Breakout Rally!Amazon ( NASDAQ:AMZN ) is creating a major breakout:
Click chart above to see the detailed analysis👆🏻
With this monthly candle, Amazon is finally breaking above the previous all time highs and could therefore start the next major bullish cycle. After a 5 year consolidation, a confirmed breakout will lead to an unbelievable short squeeze, which could bring us all the way up to the top of the channel.
Levels to watch: $200, $500
Keep your long term vision,
Philip (BasicTrading)

Amazon- Bullish in my opinion📊 Technical Analysis:
Amazon's stock continues to show impressive strength, breaking past the $200 and currently trading at $217.94. This surge aligns with the typical year-end "Santa Claus rally," where stocks often benefit from increased retail activity and market optimism. With consumer spending on the rise and seasonal trends providing a tailwind, Amazon could see continued upside as we move deeper into the holidays.
📰 Fundamentals:
🟢 Amazon sees a boost from rising e-commerce demand and growing Prime memberships.
🟢 Despite earlier challenges, AWS remains a key revenue driver in the cloud sector.
🟢 Operational streamlining and profit focus have increased investor confidence.
💡 My personal near-term target is around $240-$250, supported by seasonal trends and potential macroeconomic recovery.
*This is not financial advice.

$AMZN IS ABOUT TO EXPLODE! BUY NOW OR FOMO LATERNASDAQ:AMZN
💥 NASDAQ:AMZN IS ABOUT TO EXPLODE! 💥
I first called out NASDAQ:AMZN on October 21st as it was setting up for a huge move and CupnHandle breakout. Here's 3 reasons to not miss this investing or trading opportunity. Price targets at the end.
1.) HIGH FIVE SETUP (Check the numbers below and you will see. 1-Breaking out of cupnhandle & symmetrical triangle pattern. 2-Volume profile gap from a volume shelf. 3-Uptrending MACD. 4-Higher Highs on RSI. 5-Uptrending Stoch. (trend).
2.) #Amazon margins and FCF are growing rapidly and will continue this uptrend heading into the holiday season with a RESILIENT AMERICAN CONSUMER.
3.) It's a BUY according to the fundamentals especially when valuing this company according to it's Discounted Cash Flow (DCF).
Intrinsic Value: $250
🎯PT1: $231 (Symmetrical triangle measured move)
🎯PT2: $310 (Multi-year CupnHandle Measure Move)
Are you a shareholder? or Are you trading this name?
I'm done for the day! Going to be with my wife on her birthday and go trick or treating with my boys. Thanks for all the support, much love!
LIKE l FOLLOW l SHARE
HAPPY HALLOWEEN!
#Earnings
NFA

$AMZN, Bullish Towards $195Hey ya'll,
The chart above highlights Amazon ( NASDAQ:AMZN ) on the daily timeframe.
I've added #thestrat indicator, MACD, and RSI indicators.
I've marked the Fibonacci price points from low (Aug 28) to high (Sep 24).
Normally, I would've gotten in at the 0.618 fib retracement ($179.02) or the 0.5 fib ($182.15) but I would still take a 3+ week out options contract.
If price goes above Fri, Oct 7th high of day (HOD) @ $187.60, but 1 strike out of the money.
If price opens below Fri, Oct 7th's HOD, wait for it to either reversal at the previous low of day (LOD) or at whatever point.
Entry: $187.61 (above prev daily high)
Target: $190.86 (Fri, Sep 27 open price)
SL: $185.13 (tight under 0.382 fib)
R:R = 1:1.32
MACD = curling up
RSI = curling up, low 50s
Potential Contracts:
$190c 11/15 @ $8.00 (ITM)
$185c 11/15 @ $10.55 (1 OTM)

Amazon - Buying Pullbacks & Cyclical High Expected SoonHere is what I am watching on Amazon.
-We need to be aware that there is bearish divergence setting up on the quarterly, monthly & weekly charts. HOWEVER, this divergence is not yet confirmed, and is therefore not actionable trade intel at the present moment. We need to monitor these divergences, because if they confirm, they imply significant price moves in Amazon share price.
-MAC strategy for the Quarterly, Monthly & Weekly charts remain bullish. Any pullbacks into the bottom of the MAC are BUY opportunities. I do not blindly buy the bottom of the channels, but utilize lower timeframe entry techniques at these levels to trigger into a position. We are still BULLISH Amazon.
-Cycles suggest that Amazon could put in a cyclical high any time between now and October 10th, before putting in a major cyclical low at the end of October. I would like to see this play out to provide us with nice buy opportunities at the bottom of the MAC's.

AMAZON LONG Trade Setup 15m TF - Sep 2, 2024AMAZON LONG Trade Setup
Amazon price crosses over the Risological dotted line at175.4 giving us a clear long trade entry.
Long entry: 175.4
Stoploss: 172.2
Targets for this short trade been marked on the chart for your reference and analysis.
Consider following me for more analysis and trade setups.

Amazon - Give me another -10%...NASDAQ:AMZN did not create a sustainable all time high yet and might head lower short term.
Click image above to see detailed analysis
Short term counter-trend moves are always very welcome because they allow you to enter trading opportunities within a major higher timeframe trend. After Amazon actually broke above the previous all time high but immediately closed back below, we knew that this was a false breakout. If we get a short term move lower, we might get another textbook trading opportunity.
Levels to watch: $140
Keep your long term vision,
Philip - BasicTrading

AMZN ( Amazon.com, Inc. ) BUY TF H1 TP = 180.18On the H1 chart the trend started on Aug. 06 (linear regression channel).
There is a high probability of profit taking. Possible take profit level is 180.18
Using a trailing stop is also a good idea!
Please leave your feedback, your opinion. I am very interested in it. Thank you!
Good luck!
Regards, WeBelievelnTrading
