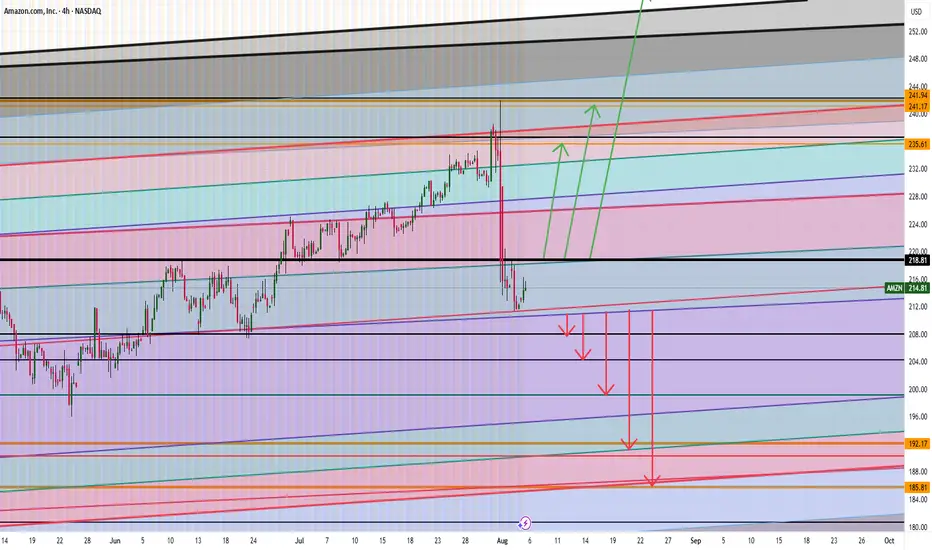
AMAZON ARE WE HEADING TO $258 ? HERE IS THE FULL ANALYSIS Hi Trading fam
So we have Amazon and based on what we are seeing we see two scenarios playing out:
Bullish:
If we can break and hold above 219 then we can see levels of : 235,241,and 258 being hit
Bearish:
If break the low of 210 then we hit 207,204, 199, 190 and then 185
Trade Smarter Live Better
Kris
Amazontrade
Amazon (AMZN) Shares Rise Ahead of Earnings ReportAmazon (AMZN) Shares Rise Ahead of Earnings Report
Today, 31 July, Amazon is set to release its quarterly earnings after the close of the regular trading session. Available data show that Amazon (AMZN) shares are exhibiting bullish momentum, reflecting positive market expectations:
→ In July, AMZN shares have outperformed the S&P 500 index (US SPX 500 mini on FXOpen);
→ Yesterday, following the end of the regular session, AMZN shares surged by approximately 3% in after-hours trading.
The rise in AMZN comes amid strong earnings reports from other tech giants, such as Microsoft (MSFT) and Meta Platforms (META). For example, MSFT shares rose by more than 8% in post-market trading. Their success has likely fuelled optimism that Amazon’s upcoming report will also impress.
All of this has brought noticeable changes to the technical outlook for the AMZN stock price.
Technical Analysis of the Amazon (AMZN) Chart
Following the release of the previous earnings report, price movements have formed an upward channel, as indicated by the Regression Trend tool. However, in recent days, a series of bearish signals emerged:
→ On Thursday, AMZN broke above the $230 level (marked by an upward arrow), but the session closed well below the highs – a sign of selling pressure;
→ Friday and Monday’s sessions produced candles with small bodies, indicating market indecision;
→ On Tuesday, bears took the lead (marked by a downward arrow), with a relatively long candle closing near the session low.
Thus, the chart gave reason to assume that optimistic sentiments were waning. However, today’s session is likely to open near the $237.30 level, effectively negating the bearish interpretation of the previous five candles and shifting momentum back in favour of the bulls.
In this context:
→ Support could be provided by the $230 level as well as the median of the Regression Trend channel;
→ Key resistance could be found at the previous high of $242.23 and the psychological level of $250.
Whether AMZN can surge to a new all-time high will largely depend on the company’s performance in AI – a theme that remains highly relevant in 2025.
This article represents the opinion of the Companies operating under the FXOpen brand only. It is not to be construed as an offer, solicitation, or recommendation with respect to products and services provided by the Companies operating under the FXOpen brand, nor is it to be considered financial advice.
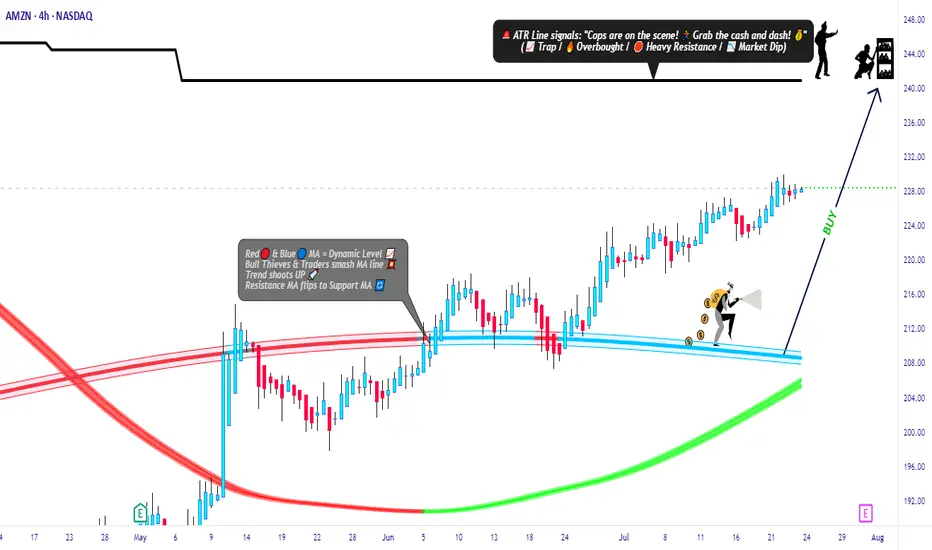
Amazon Market Robbery Blueprint – Swing/Scalp Long Setup🟨💣 “AMZN Market Heist Blueprint – Bullish Robbery in Progress 🚨💼💸” 💣🟨
By Thief Trader – Rob the Market with Precision
🌍 Hello World! Hi, Hola, Ola, Bonjour, Hallo, Marhaba!
🤑💰 Calling all Money Makers & Market Robbers – get ready to execute the next bullish heist on AMAZON.COM, INC (NASDAQ: AMZN), powered by our signature Thief Trading Style™ – where technical precision meets psychological warfare.
🔥 Plan Summary:
Based on our fundamental & technical intel, we’re eyeing a long entry into AMZN. The target? 💥The High-Risk ATR Police Barricade Zone – a zone flooded with liquidity, overbought conditions, fakeouts, and bear traps. It's where most traders get caught – but we walk in with a blueprint.
🟩 Entry Zone – “The Vault Is Wide Open!” 💼📈
🕰 Entry timeframe: 15min / 30min (preferably after confirmation or rejection wick)
💵 Buy Limit Orders: Place multiple layered entries (DCA-style) near recent swing lows/highs. Wait for breakout confirmation; no blind orders before breakout!
Thief Note: This isn’t spray-and-pray – this is sniper-mode. Scope, place, execute.🎯
🛑 Stop Loss – “SL is the Escape Route!”
📍 SL below recent 4H candle wick swing low (around 219.00 – adjust based on your risk/margin size).
Important: Only place SL after breakout; not before. Risk per order must match your lot strategy.
🎯 Target – “Grab the Bag or Escape Before the Alarms!”
💸 Target Zone: 240.00
🧠 Smart robbers know when to bail early – use a trailing SL to lock gains. Exit before reversal or heavy volume shift.
👀 Scalper Alert – “Only One Way – LONG!”
If you’re a quick thief with a fat bag, hit-and-run with a Long scalp. If you’re running lean, swing with the crew. Watch the PA and news timing. Trailing SL = insurance policy.
📊 Why Bullish? Here’s the Background:
🔍 Macro Drivers
💼 COT Report
🌍 Geo-political Influences
🧠 Sentiment Score
📈 Index Correlation
🔮 Intermarket Signals
💹 Institutional Positioning
All lights flashing green for short-to-midterm bullishness, but keep checking real-time updates.
⚠️ Risk Alert – News Triggers Can Blow Your Cover 🚨
🗞 Avoid trading near major news releases – they cause volatility spikes.
🧲 Always protect gains with trailing stops and don’t over-leverage your ammo.
💖 Support the Robbery – Hit BOOST 🔥
Smash that 💥BOOST💥 button if you ride with the Thief Trading Crew!
Let’s build this into the #1 robbery squad on TradingView.
Make money. Protect profits. Trade like a bandit – with a plan. 💼📈🏆
🔔 Stay Tuned for the Next Robbery Mission 🔔
Another heist plan dropping soon. Until then, rob smart, rob safe, and rob rich.
– Thief Trader™ | Rob The Market. Not Your Wallet.
Amazon I Strong Bullish Outlook Welcome back! Let me know your thoughts in the comments!
** Amazon Analysis - Listen to video!
We recommend that you keep this pair on your watchlist and enter when the entry criteria of your strategy is met.
Please support this idea with a LIKE and COMMENT if you find it useful and Click "Follow" on our profile if you'd like these trade ideas delivered straight to your email in the future.
Thanks for your continued support!Welcome back! Let me know your thoughts in the comments!

AMAZONAMZN needs some more upside before a pullback.
Disclosure: We are part of Trade Nation's Influencer program and receive a monthly fee for using their TradingView charts in our analysis.

AMAZONAMZN is getting ready for another push towards 230 level.
Disclosure: We are part of Trade Nation's Influencer program and receive a monthly fee for using their TradingView charts in our analysis.

Amazon (AMZN) shares jump more than 7%Amazon (AMZN) shares jump more than 7%
As shown in the Amazon (AMZN) share chart, the price surged by over 7% yesterday, breaking above the key psychological level of $200 and closing at its highest point since early March.
The sharp rise in demand was driven by reports of a trade truce between the US and China following talks in Geneva. According to Reuters, the US has decided to lower the “de minimis” threshold on goods from China. This move could help de-escalate a potentially damaging trade war between the world’s two largest economies. For AMZN stock, this is a bullish signal, as Amazon sells a wide range of low-cost Chinese goods.
Technical analysis of Amazon (AMZN) shares
From a bearish perspective, the AMZN price has recovered to the 0.618 Fibonacci retracement level after falling from an all-time high to the early April low. In this context, selling pressure may re-emerge with the intention of resuming the downtrend—especially as most oscillators on the chart are signalling strong overbought conditions.
From a bullish perspective:
→ The pattern of higher highs and higher lows in late April and early May may have outlined the median of an ascending channel;
→ Yesterday’s price surge in AMZN shares may point to the channel’s upper boundary.
Given these conditions, it is reasonable to expect a minor pullback before the Amazon’s stock price resumes its upward trajectory within the blue channel.
This article represents the opinion of the Companies operating under the FXOpen brand only. It is not to be construed as an offer, solicitation, or recommendation with respect to products and services provided by the Companies operating under the FXOpen brand, nor is it to be considered financial advice.

Amazon I Technical & Tariff Analysis Welcome back! Let me know your thoughts in the comments!
** Amazon Analysis - Listen to video!
We recommend that you keep this pair on your watchlist and enter when the entry criteria of your strategy is met.
Please support this idea with a LIKE and COMMENT if you find it useful and Click "Follow" on our profile if you'd like these trade ideas delivered straight to your email in the future.
Thanks for your continued support!Welcome back! Let me know your thoughts in the comments!

Amazon I Detailed analysis and trading plan Welcome back! Let me know your thoughts in the comments!
** Amazon Analysis - Listen to video!
We recommend that you keep this pair on your watchlist and enter when the entry criteria of your strategy is met.
Please support this idea with a LIKE and COMMENT if you find it useful and Click "Follow" on our profile if you'd like these trade ideas delivered straight to your email in the future.
Thanks for your continued support!Welcome back! Let me know your thoughts in the comments!

Amazon I Strong Growth Projections - Next Long Opportunity Welcome back! Let me know your thoughts in the comments!
** Amazon Analysis - Listen to video!
We recommend that you keep this pair on your watchlist and enter when the entry criteria of your strategy is met.
Please support this idea with a LIKE and COMMENT if you find it useful and Click "Follow" on our profile if you'd like these trade ideas delivered straight to your email in the future.
Thanks for your continued support!Welcome back! Let me know your thoughts in the comments!

AMZN: Are We Heading to $247 or Taking a Quick Dip First? Hey Mindbloome Family, here’s my take on Amazon (AMZN) right now:
1️⃣ If we break above $233, I think we’ll see a strong move up to $246–$247.
2️⃣ If we don’t break just yet, we could see a pullback to one of these levels first:
$225
$221
$215
From there, I’m still looking for a bounce back up to $246.
3️⃣ If we break below $215, that’s when we’ll need to pause and reassess the plan.
Wellness Tip: Don’t underestimate a good night’s sleep. Trading with a clear, rested mind makes all the difference—you’ll see the charts more clearly and make better decisions.
What’s your take—do we break through to $247, or are we dipping first? Let me know! If you want to chat more or dive deeper into this setup, check out my profile or send me a DM.
KRIS/MINDBLOOME EXCHANGE
TRADE WHAT YOU SEE

From Prime to Subprime: Why December Could See AMZN Fall
As always, we like to keep it clean and simple, with technicals and analysis that's easy to see and understand. Let's get into it:
AMZN could see a modest correction this December. It's at an all time high, and well into two Wave 5 sequences on the 4h. It's also overbought on an least two oscillators.
We see a 5%+ correction to the $215 price range in the coming 3-4 days .
SUPPORTING OBSERVATIONS:
Recent Rapid Stock Appreciation:
AMZN has seen a significant rise, gaining 14.1% since November 29, 2024. Such swift increases can lead to overvaluation, prompting investors to take profits, supporting the reversal to $215.
Seasonal Competitive Pressures:
Ho ho ho. The holiday season intensifies competition, often leading to increased discounting and promotional activities. This can compress profit margins, potentially impacting Amazon's financial performance and investor sentiment.
Investment in New Ventures:
Amazon's substantial investment in initiatives like Project Kuiper, its satellite internet project, involves significant capital expenditure. While promising long-term, these ventures may pressure short-term profitability, causing some investors to reassess their positions.
Be alert.
Trade green.

Amazon’s Next BIG Move: Can It Bounce to $207 from Key Support?If Amazon holds strong at $194.31, it could be setting up for a run to $207.30. This level is both a potential target and a great take-profit zone if the bounce holds. Let’s break down what to watch for as this setup unfolds!"
Trade Setup Details:
Support Level at $194.31
Right now, $194.31 is acting as a solid foundation. If Amazon finds buyer interest here, it could kick off a new upward move.
Target Zone: $207.30
If the support holds, $207.30 is the next target. This level is likely to see some selling pressure, making it an ideal area for profit-taking on a successful bounce.
Beginner Tip
Keep an eye on how Amazon reacts around $194.31. Look for strong buying signals (like a bullish candle) before entering, and consider setting your take-profit level around $207.30 to capture gains if the bounce holds.
Happy Trading
Kris/ Mindbloome Trading
Mindbloome Exchange

AMAZON LONG Trade Setup 15m TF - Sep 2, 2024AMAZON LONG Trade Setup
Amazon price crosses over the Risological dotted line at175.4 giving us a clear long trade entry.
Long entry: 175.4
Stoploss: 172.2
Targets for this short trade been marked on the chart for your reference and analysis.
Consider following me for more analysis and trade setups.

AMZN - Weekly Bearish SignsNASDAQ:AMZN ’s recent price action suggests that the stock may be poised for a further decline. After reaching the top of the long-term channel, Amazon’s price has pulled back and is now facing renewed selling pressure. This technical setup aligns with broader market concerns, particularly in light of recent economic data.
The rise in unemployment claims and disappointing PMI data signal growing economic uncertainty, which could weigh on consumer spending and, by extension, Amazon’s revenue. As the market digests this data, the technical weakness in Amazon’s chart could be a precursor to a more significant downturn, especially if economic conditions continue to deteriorate.

AMAZON Pair : AMZN - AMAZON
Description :
Rising Wedge as an Corrective Pattern in Long Time Frame and Short Time Frame
Break of Structure
RSI - Divergence
Completed " 12345 " Impulsive Waves
Resistance Level

amazon stock on buy postionwe can enter amazon boy but we must keep the stop under the support shown in the graph

AMZNPair : AMAZON
Description :
Completed " 12345 " Impulsive Waves
Break of Structure
RSI - Divergence
Double Top in Short Time Frame
Fibonacci Level - 261.8%

Amazon Pair : Amazon AMZN
Description :
Bullish Channel as an Corrective Pattern in Short Time Frame
RSI - Divergence
Break of Structure
Rising Wedge in Long Time Frame
CHoCH

AMAZONPair : Amazon AMZN
Description :
Bullish Channel as an Corrective Pattern in Long Time Frame
RSI - Divergence
Break of Structure
Bearish Channel in Short Time Frame and Rejection from Lower Trend Line
Completed " 123 " Impulsive Waves

AMAZON 24/01Pair : Amazon Index
Description :
Rising Wedge as an Corrective Pattern in Long Time Frame with the Rejection from Lower Trend Line and Rejecting from Lower Trend Line of the Corrective Pattern " Bullish Channel " in Short Time Frame. Completed Impulse and " ABC " Corrective Waves

Amazon - Massive Resistance AheadHello Traders, welcome to today's analysis of Amazon.
--------
Explanation of my video analysis:
With the quite obvious and expected channel breakout in 2016, we saw a rally of more than 500% towards the upside on Amazon. This pump was followed by a retracement back to a previous support level before we saw another bullish reversal. If Amazon breaks back above the structure mentioned in the analysis, market behaviour is bullish and I will be looking for longs.
--------
I will only take a trade if all the rules of my strategy are satisfied.
Let me know in the comment section below if you have any questions.
Keep your long term vision.

Amazon -> Continuation TradeMy name is Philip, I am a German swing-trader with 4+ years of trading experience and I only focus on price action and market structure 🖥️
I am trading the higher timeframes because this allows me to massively capitalize on the major market swings and cycles without getting caught up in the short term noise.
This is how you build real long term wealth!
In today's anaylsis I want to take a look at the bigger picture on Amazon.
After the recent rejection away from the lower support trendline of the rising channel I do now expect a short term correction back to the $105 level. Then we could see an inverted head and shoulders pattern which indicates more upside potential and eventually new all time highs.
- - - - - - - - - - - - - - - - - - - -
When the market moves where, and how, and if - these are all unknown.
The only thing which you can control is your risk.
- Philip Basic Trading -
Keep the long term vision🫡
