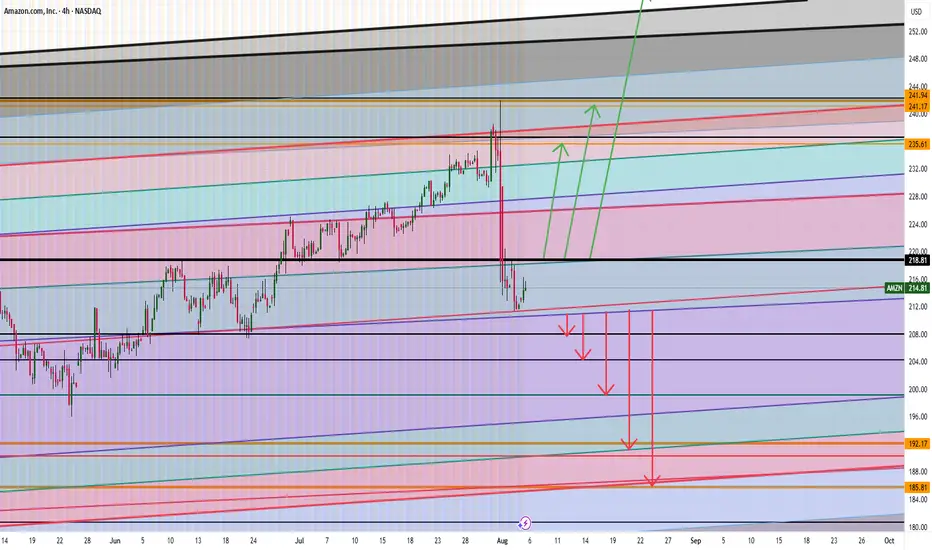
AMAZON ARE WE HEADING TO $258 ? HERE IS THE FULL ANALYSIS Hi Trading fam
So we have Amazon and based on what we are seeing we see two scenarios playing out:
Bullish:
If we can break and hold above 219 then we can see levels of : 235,241,and 258 being hit
Bearish:
If break the low of 210 then we hit 207,204, 199, 190 and then 185
Trade Smarter Live Better
Kris
Amazontradingsetup
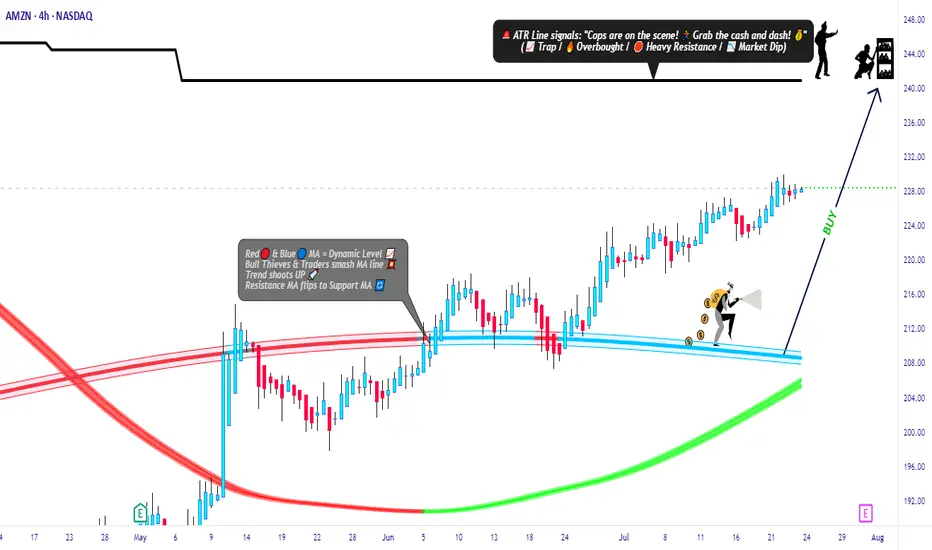
Amazon Market Robbery Blueprint – Swing/Scalp Long Setup🟨💣 “AMZN Market Heist Blueprint – Bullish Robbery in Progress 🚨💼💸” 💣🟨
By Thief Trader – Rob the Market with Precision
🌍 Hello World! Hi, Hola, Ola, Bonjour, Hallo, Marhaba!
🤑💰 Calling all Money Makers & Market Robbers – get ready to execute the next bullish heist on AMAZON.COM, INC (NASDAQ: AMZN), powered by our signature Thief Trading Style™ – where technical precision meets psychological warfare.
🔥 Plan Summary:
Based on our fundamental & technical intel, we’re eyeing a long entry into AMZN. The target? 💥The High-Risk ATR Police Barricade Zone – a zone flooded with liquidity, overbought conditions, fakeouts, and bear traps. It's where most traders get caught – but we walk in with a blueprint.
🟩 Entry Zone – “The Vault Is Wide Open!” 💼📈
🕰 Entry timeframe: 15min / 30min (preferably after confirmation or rejection wick)
💵 Buy Limit Orders: Place multiple layered entries (DCA-style) near recent swing lows/highs. Wait for breakout confirmation; no blind orders before breakout!
Thief Note: This isn’t spray-and-pray – this is sniper-mode. Scope, place, execute.🎯
🛑 Stop Loss – “SL is the Escape Route!”
📍 SL below recent 4H candle wick swing low (around 219.00 – adjust based on your risk/margin size).
Important: Only place SL after breakout; not before. Risk per order must match your lot strategy.
🎯 Target – “Grab the Bag or Escape Before the Alarms!”
💸 Target Zone: 240.00
🧠 Smart robbers know when to bail early – use a trailing SL to lock gains. Exit before reversal or heavy volume shift.
👀 Scalper Alert – “Only One Way – LONG!”
If you’re a quick thief with a fat bag, hit-and-run with a Long scalp. If you’re running lean, swing with the crew. Watch the PA and news timing. Trailing SL = insurance policy.
📊 Why Bullish? Here’s the Background:
🔍 Macro Drivers
💼 COT Report
🌍 Geo-political Influences
🧠 Sentiment Score
📈 Index Correlation
🔮 Intermarket Signals
💹 Institutional Positioning
All lights flashing green for short-to-midterm bullishness, but keep checking real-time updates.
⚠️ Risk Alert – News Triggers Can Blow Your Cover 🚨
🗞 Avoid trading near major news releases – they cause volatility spikes.
🧲 Always protect gains with trailing stops and don’t over-leverage your ammo.
💖 Support the Robbery – Hit BOOST 🔥
Smash that 💥BOOST💥 button if you ride with the Thief Trading Crew!
Let’s build this into the #1 robbery squad on TradingView.
Make money. Protect profits. Trade like a bandit – with a plan. 💼📈🏆
🔔 Stay Tuned for the Next Robbery Mission 🔔
Another heist plan dropping soon. Until then, rob smart, rob safe, and rob rich.
– Thief Trader™ | Rob The Market. Not Your Wallet.
Amazon I Strong Bullish Outlook Welcome back! Let me know your thoughts in the comments!
** Amazon Analysis - Listen to video!
We recommend that you keep this pair on your watchlist and enter when the entry criteria of your strategy is met.
Please support this idea with a LIKE and COMMENT if you find it useful and Click "Follow" on our profile if you'd like these trade ideas delivered straight to your email in the future.
Thanks for your continued support!Welcome back! Let me know your thoughts in the comments!

Amazon Long IdeaBuying Amazon shares here...
Reason:
Bouncing off support with good bullish price action candles.
I expect the price to reach $245 per shares between now and next week Friday....
My stop loss price is on the chart.
Profit Raiders’ Guide to Conquering AMAZON Stock!Hello, Wealth Warriors! 🌟
Stock market adventurers, let’s embark on a thrilling quest to dominate AMAZON stock with our cunning Raider Trading Strategy! 🗡️📈 Fueled by razor-sharp technical analysis and robust fundamental insights, this plan targets high-reward zones while dodging market traps. Follow the long-entry map, aim for the golden profit zone, and stay vigilant for overbought signals, consolidation, or bearish ambushes that could shift the trend. 🐻🔍 Secure your gains and celebrate your victory! 🎉
Entry 📈
The treasure chest is wide open! 🏰 Seize the bullish momentum at the current price of $206.02—your adventure begins! For precision, set Buy Limit orders on a 15 or 30-minute chart for pullback entries, targeting a retest of recent highs ($206.69) or lows ($202.19).
Stop Loss 🛑
📍 Place your Raider Stop Loss at the recent swing low ($196.00) on a 4-hour chart for day trades. Adjust based on your risk tolerance, position size, and number of trades to stay in control. 🛡️
Target 🎯
Set your sights on $217.00 or exit early to lock in your profits! 💸 Refer to the finance card above for price trends.
Scalpers, Stay Sharp! 👀
Focus on quick long-side trades. Large accounts? Strike now! Smaller portfolios? Join swing traders for the raid. Use a trailing stop to safeguard your gains as the stock moves. 🧲💰
AMAZON Stock Market Insights 📊
AMAZON is charging bullish, driven by strong fundamentals. 📈 Dive into earnings reports, macroeconomic trends, geopolitical events, market sentiment, sector correlations, and future price projections for a complete view. As of May 28, 2025, at 12:04 AM EST (UTC-5), the stock’s momentum is supported by a market cap of $2.17 trillion and a year-to-date high of $242.52. Stay informed! 🔗
⚠️ Trading Alert: News & Risk Management 📰
Market-moving news can strike fast! Protect your gains:
Avoid opening trades during major news events.
Use trailing stops to secure profits and minimize losses. 🚫
Join the Raid! 💥
Support our battle plan—smash the Boost Button! 🚀 Let’s conquer the market with the Raider Trading Strategy and stack profits like true stock market legends. 💪🤝 Prepare for the next adventure, raiders! 🤑⚔️🎉

AMAZONAMZN needs some more upside before a pullback.
Disclosure: We are part of Trade Nation's Influencer program and receive a monthly fee for using their TradingView charts in our analysis.

Amazon (AMZN) shares jump more than 7%Amazon (AMZN) shares jump more than 7%
As shown in the Amazon (AMZN) share chart, the price surged by over 7% yesterday, breaking above the key psychological level of $200 and closing at its highest point since early March.
The sharp rise in demand was driven by reports of a trade truce between the US and China following talks in Geneva. According to Reuters, the US has decided to lower the “de minimis” threshold on goods from China. This move could help de-escalate a potentially damaging trade war between the world’s two largest economies. For AMZN stock, this is a bullish signal, as Amazon sells a wide range of low-cost Chinese goods.
Technical analysis of Amazon (AMZN) shares
From a bearish perspective, the AMZN price has recovered to the 0.618 Fibonacci retracement level after falling from an all-time high to the early April low. In this context, selling pressure may re-emerge with the intention of resuming the downtrend—especially as most oscillators on the chart are signalling strong overbought conditions.
From a bullish perspective:
→ The pattern of higher highs and higher lows in late April and early May may have outlined the median of an ascending channel;
→ Yesterday’s price surge in AMZN shares may point to the channel’s upper boundary.
Given these conditions, it is reasonable to expect a minor pullback before the Amazon’s stock price resumes its upward trajectory within the blue channel.
This article represents the opinion of the Companies operating under the FXOpen brand only. It is not to be construed as an offer, solicitation, or recommendation with respect to products and services provided by the Companies operating under the FXOpen brand, nor is it to be considered financial advice.

AMAZONAmazon has a great potential to head up towards 230 level.
Disclosure: We are part of Trade Nation's Influencer program and receive a monthly fee for using their TradingView charts in our analysis.

Abbott and Amazon: Two Bright Spots in a Sea of Red◉ Abbott Laboratories NYSE:ABT
● The stock previously faced strong resistance near the $134 level, leading to an extended consolidation phase.
● During this period, a Rounding Bottom pattern emerged, signalling a potential continuation of the upward trend.
● Following a recent breakout, the stock has surged to its all-time high and is expected to maintain its upward momentum in the coming days.
◉ Amazon NASDAQ:AMZN
● Since August 2020, Amazon's stock has been consolidating, forming a clear Inverted Head & Shoulders pattern.
● After breaking above the neckline, the stock rallied sharply and reached an all-time high near $242.
● Following this, the price pulled back to retest the breakout level and with a successful retest, the stock is now well-positioned to resume its upward trend.

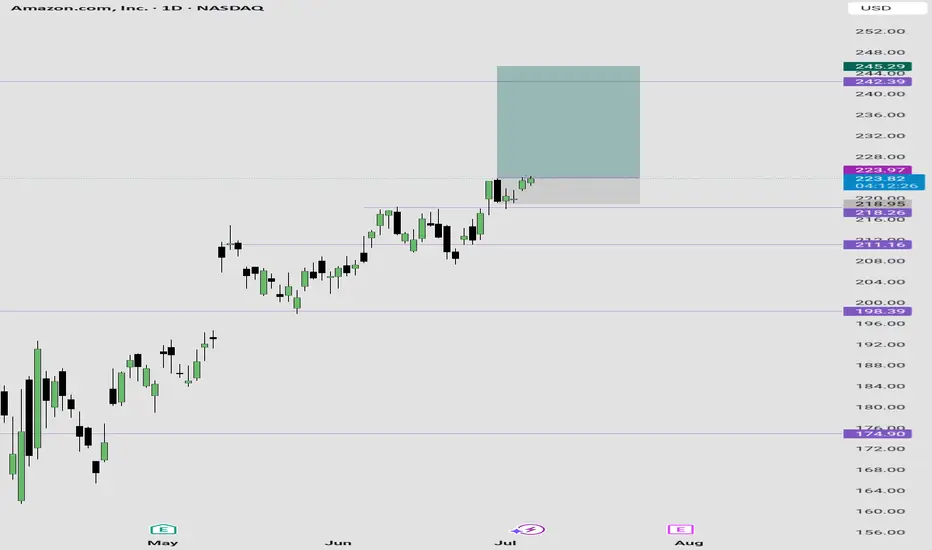
Amazon (AMZN) Stock Analysis & ForecastAmazon (AMZN) Stock Analysis & Forecast
The U.S. stock market has experienced a notable downturn recently, and Amazon (NASDAQ: AMZN) is no exception. Currently trading at $228, I am closely monitoring the stock for a potential pullback to $220, where I plan to enter.
Entry Strategy
My entry point of $220 is based on a confluence of key technical levels:
An ascending trendline indicating ongoing bullish momentum.
A horizontal support level, reinforcing this area as a strong demand zone.
Target & Exit Strategy
If fundamental catalysts align in my favor, my price target (TP) will be the all-time high (ATH) zone around $240, with the potential to extend beyond.
As always, risk management remains a priority—trade cautiously and adapt to market conditions.

amazon ideawe can see amazon in the next few days coming to more price up
we can put the stop in these points

Amazon Reaches New All-Time High: Should You Buy Now...?AMAZON has successfully surpassed its previous all-time high and has maintained a position above this critical level. This upward momentum presents an opportunity for traders to consider entering a long position on a pullback. A strategic entry point for this trade could be set at $235.50, where we can potentially capitalize on a rebound as the stock stabilizes. It's essential to monitor volume and market sentiment during this pullback to ensure a favorable risk-to-reward ratio for the trade.

Nancy Pelosi bought Amazon Calls! 📈 Bullish Opportunity: Amazon (AMZN)
1️⃣ Bullish Flag Pattern with Premarket Breakout:
Amazon has formed a classic bullish flag pattern, which is a reliable continuation signal in an uptrend. The price has already broken out of the flag channel in the premarket session, signaling strong bullish momentum and potential for significant upside.
2️⃣ Amazon’s Cloud Leadership is Poised to Strengthen:
AWS (Amazon Web Services) continues to lead the cloud infrastructure market, controlling 33% of the market—more than Azure and Google Cloud combined, according to Canalys.
CEO Andy Jassy noted four consecutive quarters of reaccelerating AWS growth, with an annualized revenue run rate of $110 billion.
3️⃣ AI Advancements Reasserting Dominance:
While Microsoft is seen as the leader in the AI revolution, Amazon is catching up fast. Over the past 18 months, AWS released nearly twice as many machine learning and generative AI features as competitors combined.
These advancements are expected to make Amazon a leader in AI throughout 2025, further enhancing its cloud and technology business.
4️⃣ E-commerce Profitability Soaring:
CEO Andy Jassy’s focus on cost-cutting and logistics efficiency is delivering results:
Operating income in Amazon’s North American e-commerce segment grew by 87% in the first nine months of 2024.
Automation advancements, like robotics in fulfillment centers, have reduced processing times and improved cost efficiency by 25% during peak times.
These measures are driving higher profitability in its flagship e-commerce business, helping Amazon increase margins and drive long-term growth.
5️⃣ Undervalued and Strong Growth Potential:
Simply Wall Street estimates Amazon is trading at 40.5% below fair value, offering an attractive entry point for investors.
6️⃣ Smart Money Confidence:
Nancy Pelosi recently purchased Amazon calls 3 days ago!
7️⃣ Analyst Ratings:
Consensus: Strong Buy from top analysts.
Average Price Target: $245 (near-term expectations).
High Price Target: $280 (bullish scenario).
🎯 Strategy:
Enter now : $225.94 - $228.50
First Target : $240 (First resistance after breakout).
Second Target : $260 (Measured move from the flagpole).
Third Target : $280 (High-end analyst expectations).
Stop Loss: Based on the risk management.

Amazon I Strong Growth Projections - Next Long Opportunity Welcome back! Let me know your thoughts in the comments!
** Amazon Analysis - Listen to video!
We recommend that you keep this pair on your watchlist and enter when the entry criteria of your strategy is met.
Please support this idea with a LIKE and COMMENT if you find it useful and Click "Follow" on our profile if you'd like these trade ideas delivered straight to your email in the future.
Thanks for your continued support!Welcome back! Let me know your thoughts in the comments!

AMZN: Are We Heading to $247 or Taking a Quick Dip First? Hey Mindbloome Family, here’s my take on Amazon (AMZN) right now:
1️⃣ If we break above $233, I think we’ll see a strong move up to $246–$247.
2️⃣ If we don’t break just yet, we could see a pullback to one of these levels first:
$225
$221
$215
From there, I’m still looking for a bounce back up to $246.
3️⃣ If we break below $215, that’s when we’ll need to pause and reassess the plan.
Wellness Tip: Don’t underestimate a good night’s sleep. Trading with a clear, rested mind makes all the difference—you’ll see the charts more clearly and make better decisions.
What’s your take—do we break through to $247, or are we dipping first? Let me know! If you want to chat more or dive deeper into this setup, check out my profile or send me a DM.
KRIS/MINDBLOOME EXCHANGE
TRADE WHAT YOU SEE

From Prime to Subprime: Why December Could See AMZN Fall
As always, we like to keep it clean and simple, with technicals and analysis that's easy to see and understand. Let's get into it:
AMZN could see a modest correction this December. It's at an all time high, and well into two Wave 5 sequences on the 4h. It's also overbought on an least two oscillators.
We see a 5%+ correction to the $215 price range in the coming 3-4 days .
SUPPORTING OBSERVATIONS:
Recent Rapid Stock Appreciation:
AMZN has seen a significant rise, gaining 14.1% since November 29, 2024. Such swift increases can lead to overvaluation, prompting investors to take profits, supporting the reversal to $215.
Seasonal Competitive Pressures:
Ho ho ho. The holiday season intensifies competition, often leading to increased discounting and promotional activities. This can compress profit margins, potentially impacting Amazon's financial performance and investor sentiment.
Investment in New Ventures:
Amazon's substantial investment in initiatives like Project Kuiper, its satellite internet project, involves significant capital expenditure. While promising long-term, these ventures may pressure short-term profitability, causing some investors to reassess their positions.
Be alert.
Trade green.

Amazon- Bullish in my opinion📊 Technical Analysis:
Amazon's stock continues to show impressive strength, breaking past the $200 and currently trading at $217.94. This surge aligns with the typical year-end "Santa Claus rally," where stocks often benefit from increased retail activity and market optimism. With consumer spending on the rise and seasonal trends providing a tailwind, Amazon could see continued upside as we move deeper into the holidays.
📰 Fundamentals:
🟢 Amazon sees a boost from rising e-commerce demand and growing Prime memberships.
🟢 Despite earlier challenges, AWS remains a key revenue driver in the cloud sector.
🟢 Operational streamlining and profit focus have increased investor confidence.
💡 My personal near-term target is around $240-$250, supported by seasonal trends and potential macroeconomic recovery.
*This is not financial advice.

Amazon Ignites: 150% Blaze Ahead?The stock has been in consolidation since August 2020, forming an Inverted Head & Shoulder pattern. Recently, it broke out above the neckline and is attempting to sustain above the 200 level.
Currently trading at 210, the stock has the potential to surge to 500 levels in the next few years. However, the breakout lacks strong confirmation, as a significant bullish candle with volume expansion is absent.
A crucial factor to watch is a monthly close above 200. This will help determine the stock's future trajectory and guide our trading and investment decisions.

BEZOS AND EX-BEZOS ARE GIVING YOU A EARLY GIFT ON AMAZON!BEZOS AND EX-BEZOS ARE GIVING YOU A EARLY GIFT ON AMAZON! NASDAQ:AMZN
- HIGHFIVESETUP still intact
- Creating Support on Wr%
- Retesting Ascending triangle and CupnHandle breakout
- Measure move on both is to $300+
- Cheap on a DFCF model
Have you been buying more Amazon?
NFA

Amazon’s Next BIG Move: Can It Bounce to $207 from Key Support?If Amazon holds strong at $194.31, it could be setting up for a run to $207.30. This level is both a potential target and a great take-profit zone if the bounce holds. Let’s break down what to watch for as this setup unfolds!"
Trade Setup Details:
Support Level at $194.31
Right now, $194.31 is acting as a solid foundation. If Amazon finds buyer interest here, it could kick off a new upward move.
Target Zone: $207.30
If the support holds, $207.30 is the next target. This level is likely to see some selling pressure, making it an ideal area for profit-taking on a successful bounce.
Beginner Tip
Keep an eye on how Amazon reacts around $194.31. Look for strong buying signals (like a bullish candle) before entering, and consider setting your take-profit level around $207.30 to capture gains if the bounce holds.
Happy Trading
Kris/ Mindbloome Trading
Mindbloome Exchange

AMAZON LONG Trade Setup 15m TF - Sep 2, 2024AMAZON LONG Trade Setup
Amazon price crosses over the Risological dotted line at175.4 giving us a clear long trade entry.
Long entry: 175.4
Stoploss: 172.2
Targets for this short trade been marked on the chart for your reference and analysis.
Consider following me for more analysis and trade setups.

Amazon - Breakdown of the breakout!NASDAQ:AMZN is definitely ready for a major bullish (triangle) breakout.
Here we have a textbook example of a bullish stock. Amazon's stock chart is simply moving from bottom left to top right. Of course there are minor corrections here and there, but the trend is clearly higher. For the past four months, Amazon has been hugging a horizontal resistance level and is preparing a bullish breakout. This will certainly become a decent break and retest setup.
Levels to watch: $185
Keep your long term vision,
Philip - BasicTrading

AMAZON Pair : AMZN - AMAZON
Description :
Rising Wedge as an Corrective Pattern in Long Time Frame and Short Time Frame
Break of Structure
RSI - Divergence
Completed " 12345 " Impulsive Waves
Resistance Level
