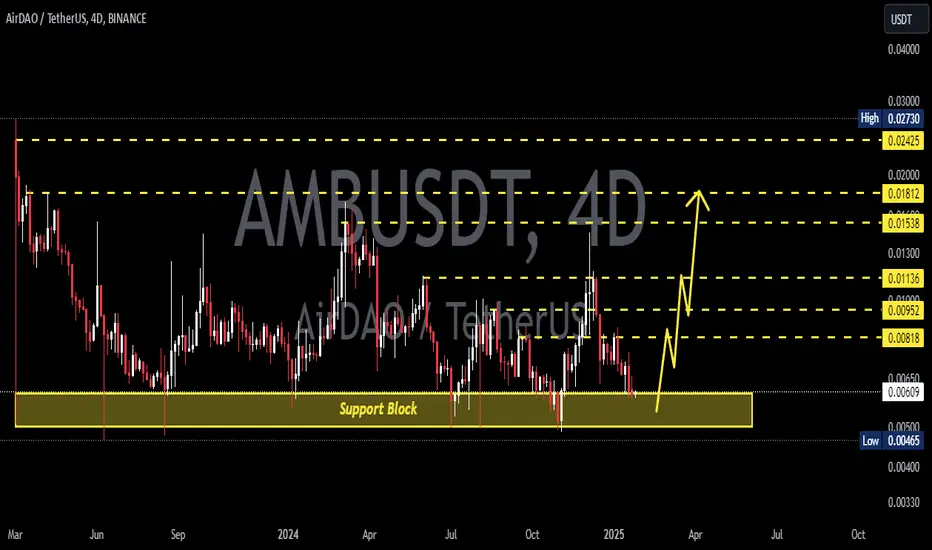
AMBUSDT 4DAMB ~ 4D Analysis
#AMB Time frime 4D continues to maintain this support block. This is the right time to start buying back with a minimum target of 20%+
Ambusdtperp
#AMB/USDT#AMB
The price is moving in a downward channel on the 4-hour frame upwards and is expected to continue
We have a trend to stabilize above the moving average 100 again
We have a downward trend on the RSI indicator that supports the rise by breaking it upwards
We have a support area at the lower limit of the channel at a price of 0.00545
Entry price 0.00600
First target 0.00666
Second target 0.00716
Third target 0.00772

#AMB/USDT#AMB
The price is moving within a bearish channel pattern on the 4-hour frame, which is a strong retracement pattern
We have a bounce from a major support area in green at 0.00620
We have a tendency to stabilize above the Moving Average 100
We have an upward trend on the RSI indicator that supports the rise and gives greater momentum, upon which the price depends
Entry price is 0.00650
The first target is 0.00734
The second goal is 0.00790
The third goal is 0.00854

AMBUSDTAMB ~ 1W ✅
#AMB So far this Key Support continues to maintain price.
✅ If you are interested in this coin, this support Block would be an excellent purchase. at least for 20%++ profit

AMB/Usdt Plan AMB/USDT Plan
The price is currently trading in a triangle pattern, and I expect a breakout soon. The market structure is bullish, so keep a close eye on it. Remember, this is not financial advice—always do your own research.

AMBUSDT: Low Market Cap GemAMBUSDT Technical analysis update
One of the lowest market cap coins listed on Binance currently has a market cap of $25M. It could potentially reach $250M during this bull run.
The price is currently forming a triangle pattern. Once the price breaks out, we can expect a strong bullish move in AMB, with a target of 500% to 1000%.

AMBUSDT 1000% Potential!AMBUSDT technical analysis update
AMB has been trading within a range for the last 525 days, and it is now bouncing from its major support level with high volume. We can expect a strong bullish move from the current level.
AMB is one of the lowest market cap coins listed on Binance, with a current market cap of $25 million. It could potentially reach $250 million by the end of 2025.
Regards
hexa

#AMB\USDT#AMB
The price is moving in the direction of forming a head and shoulders pattern on a 1-hour frame. The price is moving within it and adhering to it to a large extent.
We have a support area in green and
bounced from it at the level of 0.00700.
We have a trend to hold above moving average 100.
We have a downtrend on the RSI indicator that supports the rise and is about to break higher
Entry price is 0.00820
The first target is 0.00936
The second goal is 0.01103
The third goal is 0.01290

AMB/USDT IDEA AMB/USDT is currently exhibiting a symmetrical triangle pattern, indicating a potential breakout in the near future. If the breakout is successful, a strong bullish rally could be anticipated. Please note that this is not financial advice, and it is always recommended to wait for confirmation and conduct your own research (DYOR) before making any trading decisions.

AMBUSDT 200% PotentialAMBUSDT Technical analysis update
AMB price breaks above resistance after a 350-day consolidation period.
Buy zone : Below $0.0148
Stop loss : $0.0110
Regards
Hexa

AMB / AMBUSDTGood Luck >>
• Warning •
Any deal I share does not mean that I am forcing you to enter into it, you enter in with your full risk, because I'll not gain any profits with you in the end.
The risk management of the position must comply with the stop loss.
(I am not sharing financial or investment advice, you should do your own research for your money.)

BUY-ZONE : BY LOW CH & BREAKEVENIn the areas where we can give more importance to buying, the price can be 0.009 dollars, which can climb up to the price ceiling of 0.0145 dollars.
