AMC Faces Uphill Battle Amidst Dwindling Box Office & Debt Woes
As the curtain falls on another tumultuous year for AMC Entertainment Holdings Inc (NYSE: NYSE:AMC ), investors brace themselves for what could be a defining moment in the company's trajectory. With AMC (NYSE: NYSE:AMC ) stock plummeting to new lows and a bleak outlook for the cinema industry, CEO Adam Aron finds himself navigating treacherous waters filled with debt obligations and shifting consumer preferences.
The recent plunge in AMC's stock price, hitting a new 52-week low of $3.63 per share, reflects the harsh reality facing the cinema giant. Despite the optimism surrounding the industry's recovery post-pandemic, AMC's (NYSE: NYSE:AMC ) struggles persist, exacerbated by external factors such as the lingering effects of the 2023 Writers Guild of America strike.
The impact of the strike on the 2024 box office cannot be understated. With projections suggesting a staggering decline of at least $1 billion in domestic box office revenue, AMC (NYSE: NYSE:AMC ) and its peers face an uphill battle to reignite consumer interest in traditional moviegoing experiences. The rise of streaming platforms continues to pose a formidable challenge, forcing AMC (NYSE: NYSE:AMC ) to reimagine its business model and adapt to an evolving landscape.
One of the key concerns weighing on AMC's (NYSE: NYSE:AMC ) performance is its ballooning debt. The company's aggressive measures to pay down debt, including dilution through share offerings, have left investors wary. AMC's (NYSE: NYSE:AMC ) outstanding shares surged by 29.52% in 2023 alone, reflecting a pattern of dilution that threatens to erode shareholder value over time.
The recent $350 million at-the-market offering, coupled with additional share issuances to service debt obligations, underscores the urgency of AMC's (NYSE: NYSE:AMC ) financial predicament. As the company strives to strike a delicate balance between debt reduction and shareholder interests, the path forward remains fraught with uncertainty.
Against this backdrop, AMC's upcoming earnings report for the fourth quarter and full year ended December 31, 2023, assumes critical importance. Investors eagerly await insights into the company's performance and strategic initiatives to navigate the challenges ahead.
The earnings webcast scheduled for February 28, 2024, offers a platform for stakeholders to gauge AMC's prospects and pose pertinent questions to company executives. Amidst mounting concerns, CEO Adam Aron faces the daunting task of restoring investor confidence and charting a course towards sustainable growth.
However, amidst the gloom, there are glimmers of hope for AMC (NYSE: NYSE:AMC ). The company's relentless pursuit of innovation, including initiatives like AMC Theatres Distribution and partnerships with leading artists, demonstrates a commitment to diversifying revenue streams and enhancing the cinema experience.
As AMC endeavors to weather the storm, it remains to be seen whether the company can emerge stronger from its current challenges. With the global cinema landscape undergoing seismic shifts, AMC's fate hangs in the balance, with stakeholders eagerly awaiting the next chapter in this unfolding saga.
AMC

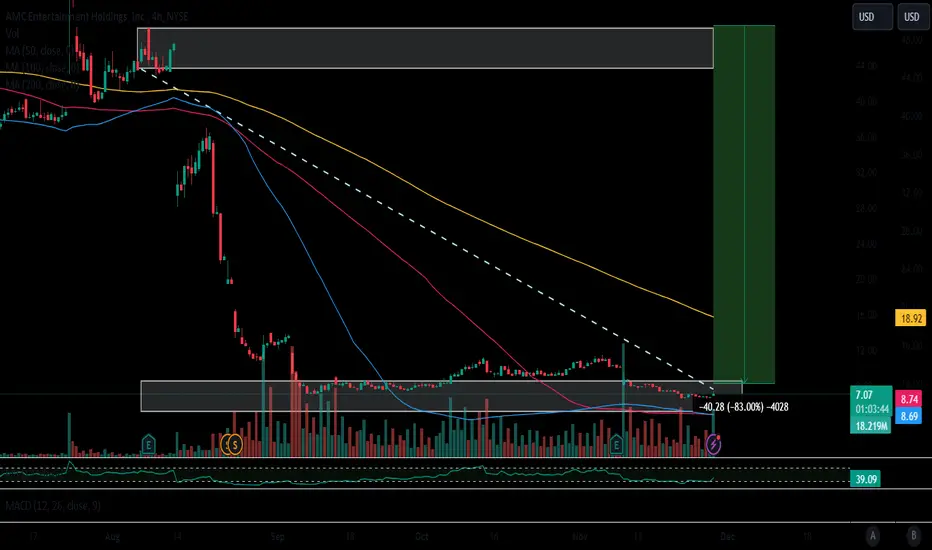
AMC reversal time?While everyone has been running away from AMC I've been running towards. I think yesterday we may have seen the last squeeze on AMC price.
Today AMC showing a strong revesal patern on the 4hr hr chart. Could AMC be making its turn. Earnings coming up in FEb so i guess we will know more than but for now let's just see if the investors feel the same as i do about AMC To the moon! LET'S MAKE AMC GREAT AGAIN lol

Can AMC continue after a good trading day ? LONGAMC on a 30-minute chart is putting in a double bottom. In mid-December, a symmetrical
head and shoulders is formed. The right shoulder being higher than the left makes for a
diagonal neckline which yields a target in the area of 5 confluent with the level of a high
pivot on January 10th. A standard Fibonacci retracement of the Janaury trend down would
put a target at about 4.55. The AI predictive tool looking back for similar patterns has printed
a buy signal. On this instrument at this time frame, the indicator has a 98% accuracy
for win rate. The ADX indicator shows a line cross and a "green" bull trend beginning.
Overall, I find AMC to be set for a long trade targeting 4.5 and 4.95 for one-third each with
the remaining to run in case a short squeeze gets underway.

Aditya AMC quarterly result tradeAditya Birla Sun Life AMC Ltd the company of the old and prestigious Birla group has posted its best ever quarterly result with highest sales and net profit. The quarterly has profit has increased to 209 crore and its growth is supported by the accelerated growth of whole mutual fund industry. The target price is 700 for about 47% potential gain
It is a high potential company because of the following factors-
Return on capital employed >30
Debt to equity <0.1
Net profit preceding 12months >500
Net Profit latest quarter >100
Please do your own analysis before investing or trading.
Thank you and do like and follow if you like my analysis.

Did AMC Bottom? I know #AMC has been nothing to look at, but sometimes you gotta stick with your gut. The four hour chart looking like a db but the bigger picture is if you zoom out to the daily or the weekly. Price has been sitting on the 4.00 level unable to break lower. Bigger picture price seems to have resest and is siittin on a previous order block. It may be wishful thinking but I think at this price it cant hurt. Long on AMC
please comment or boost this idea if you agree

CALL ME CRAZY but $AMC is about to cycle #bullish $5-7.50 test I have noticed a trend in the recent price action of $AMC.
** We closed 2023 at $6.18**
Upon hitting the $4 (4.08) region AMC shows signs of bullish outbreak.
When testing 4.08 on 1/17/24 it implused up to test 4.80 almost $5 test in the next 5 trading days following.
DON'T LET THE MEDIA FOOL YOU!
"MeMe StOcKs ArE dOnE"
Waiting on Cramer to diss NYSE:AMC again as another leg on confluence
Testing TWICE can possibly confirm a double bottom which is another confluence for a bullish outbreak as bottom has formed.
NYSE:AMC has not adhered to typical technical analysis in the past as it is heavily manipulated.
This week has some large earning reports in tech sector which can possibly provide EXTRA volume to push NYSE:AMC back above $5.
I am entering a 7.55C 2/23 exp at market price of $4.15
#bullish #AMC #breakout #memestock
This is simply a thesis and not Financial advice. Please use your own risk management and judgement.

It's allll good (perhaps)Above you can see AMC's 4h chart.
As you can see, we have broken above the heavy macro resistance , which dates back to April '22. We even retested it and found support today.
No dates, no price targets. Just showing you the TA I'm seeing here.
RSI is also oversold on the 4h and volume is picking back up.

AMC Entertainment (NYSE: AMC) Stock: Buy or Sell? AMC shares are currently trading near their all-time low, despite the fact that the company's fundamentals are at their strongest since the onset of the pandemic.
AMC Is Trading at an All-Time Low
AMC Entertainment (AMC) - would be classified as a penny stock right now if it weren't for the 1-for-10 reverse stock split that the company implemented at the end of August. In fact, if it hadn't been for the reverse split, AMC — which trades for around $6 — would be worth 69 cents per share today.
AMC reached an all-time high of $551 per share in 2021 (adjusted for the reverse stock split). However, the stock has experienced a significant decline in value since August. This decline can be attributed to the substantial dilution that resulted from the conversion of preferred shares into common stock.
This downward trend contrasts with the sustained high share price levels that AMC enjoyed over the past two years, supported by its loyal retail shareholders, affectionately referred to as the "Apes."
The technical indicators reveal significant selling pressure on AMC shares in recent months. The 14-day Relative Strength Index (RSI) reads 29, indicating oversold conditions. In such a situation, a reversal becomes more likely if a catalyst emerges to alleviate the selling pressure and propel the shares into a bullish trend.
AMC's Business Is in the Best Shape Since the Pandemic
Paradoxically, at the same time that AMC shares have sharply declined, the company has begun reporting its best financial results since 2019 — before the COVID pandemic.
For the third quarter, AMC disclosed record-breaking revenue and EBITDA (earnings before interest, taxes, depreciation, and amortization), surpassing even pre-pandemic numbers. This success was attributed to the release of international blockbusters such as Barbie and Oppenheimer.
Despite a recorded 16% decrease in theater attendance compared to 2019, a remarkable 30% increase in per-patron spending significantly contributed to AMC's robust revenue results.
However, AMC still grapples with a substantial debt burden. The company's long-term debt stands at $4.75 billion, and its current ratio (total assets divided by total liabilities) is 0.46, raising some concerns.
The company's decision to raise equity to address this issue has been well-received. With the recent sale of $350 million worth of shares, AMC is poised to raise approximately $700 million this year. This infusion of capital will help strengthen its liquidity position, facilitate debt write-offs, and alleviate any short-term survival concerns.
Price Momentum
AMC is trading near the bottom of its 52-week range and below its 200-day simple moving average.
What does this mean?
Investors have been pushing the share price lower, and the stock still appears to have downward momentum. This is a neutral sign for the stock's future value.
ETH/AMC chart to follow MOASS/ SqueezeNotice when ETH/ AMC correlation corrects, AMC runs. Currently, RSI, Macd, and price is double topping on Eth/AMC. Again, this is ETH compared to AMC price. not prices overlapping two charts. A run for AMC is due on the charts, but only until we break patter/ trend line will a massive squeeze start.

Long Trade Setups: AMC CVNA PIXY UPST Some high risk high reward stocks in watching.
Small caps could get squeezy in the near term.

$AMC straddle strategy 👁🗨️*This is not financial advice, so trade at your own risks*
*My team digs deep and finds stocks that are expected to perform well based off multiple confluences*
*Experienced traders understand the uphill battle in timing the market, so instead my team focuses mainly on risk management
Whether the market likes NYSE:AMC earnings after the bell today my team expects big price movements. According to the charts we can see that bulls need a lot more than the bears to set this thing off to $14.50.
My team is using a The Straddle options strategy leaning towards puts since bears have it easy this round. We're 25% into calls and 75% into puts. Good luck to you all!
!! This chart analysis is for reference purposes only !!
If you want to see more, please like and follow us @SimplyShowMeTheMoney

AMC Entertainment Holdings Options Ahead of EarningsIf you haven`t bought AMC before the Gamma Squeeze:
or sold before the approved combining AMC shares & APE units:
Then analyzing the options chain and the chart patterns of AMC Entertainment Holdings prior to the earnings report this week,
I would consider purchasing the 10usd strike price in the money Calls with
an expiration date of 2023-11-10,
for a premium of approximately $1.17.
If these options prove to be profitable prior to the earnings release, I would sell at least half of them. I`m still bearish for the long run. Might end up in bankruptcy after all.
Looking forward to read your opinion about it.

$AMC textbook play 👁🗨️*This is not financial advice, so trade at your own risks*
*My team digs deep and finds stocks that are expected to perform well based off multiple confluences*
*Experienced traders understand the uphill battle in timing the market, so instead my team focuses mainly on risk management
!! This chart analysis is for reference purposes only !!
If you want to see more, please like and follow us @SimplyShowMeTheMoney

AMC Already up +30% since our buy call. Still hold?AMC Entertainment Holdings (AMC) went up yesterday +30% since our buy signal 2 weeks ago (September 26) as it rose from $8.14 to $10.52 (see chart below):
Our long-term target remains $25.00, which is under the long-term Resistance of the 1W MA50 but what to do on the shorter term? The 1D RSI just turned neutral at 46.37 while the 1D MACD is on a Bullish Cross but still under the 0.0 mark. Those two indicate that there is still more upside left to this 2-week rally, which was to be expected considering the previously oversold condition of the time-frame.
As a result, the short-term target is $14.00, which is exactly on the Resistance 1 level and where the 1D MA50 (blue trend-line) is headed to. Complimentary to that, the 1D RSI has a clear Resistance Zone for selling purposes. If it enters it before the price hits 14.00, we may consider taking the profit earlier.
-------------------------------------------------------------------------------
** Please LIKE 👍, FOLLOW ✅, SHARE 🙌 and COMMENT ✍ if you enjoy this idea! Also share your ideas and charts in the comments section below! This is best way to keep it relevant, support us, keep the content here free and allow the idea to reach as many people as possible. **
-------------------------------------------------------------------------------
💸💸💸💸💸💸
👇 👇 👇 👇 👇 👇

AMC Forming a bottom. Huge investment opportunity?AMC Entertainment Holdings (AMC) has been trading sideways for the past 2 weeks following this month's bottom after the August price drop. The 1D RSI turning flat in oversold territory while the 1D MACD just formed a Bullish Cross marginally above the -0.500 level, the deepest it has ever been historically.
The above setting is an early call of a long-term bottom formation. A similar pattern, Lower Highs price sell-off into an oversold RSI and Bullish Cross MACD can be seen on AMC's previous market low during March 2020. The price then recovered, hitting both the 1D MA50 and MA200, extending as high as the Lower Highs trend-line. As a result, we consider the current levels a sound investment, targeting at least $25.00 (projected contact with the 1D MA200).
-------------------------------------------------------------------------------
** Please LIKE 👍, FOLLOW ✅, SHARE 🙌 and COMMENT ✍ if you enjoy this idea! Also share your ideas and charts in the comments section below! **
-------------------------------------------------------------------------------
💸💸💸💸💸💸
👇 👇 👇 👇 👇 👇

This Is Not The BottomOver 350 Million shares are still to be sold by AMC. There's not enough liquidity in the market (hello, threshold list), so Adam Aron has to come up with new ways to keep his retailer investor community excited. NFTs, Popcorn, a Creditcard & his cheerful tweets are methods to keep the cash cow going. It's sad to see such a big community being fooled by him - in other words - there are many people without the ability to observe things critically. Combined with a position at -97% (after going all-in), the same people choose to gather on Reddit, TradingView, and elsewhere in order to collectively complain about the "fraudulent" system. If you know everything is manipulated, why would you bet against it?

AMC November 25th, 2024 seems VERY importantI was charting out an AMC chart, and happened to notice several trends seeming to converge around November 25th, 2024 at approx 586.00. Using that, I refined the chart and trend lines using that point as an origin, and tracing it back through the price action.
Much to my suprise, the trends all seem to match both major and minor movements of the price action throughout the chart. In one instance, the price action rode the trend for more that 130 days, before dropping to a lower trend. Another interesting point is from the inflection point through the peak of the high in June lines up with price action as far back as 2015. Pay attention to not only the wicks and open/closes of major candles, but also the wicks of the smaller candles in between.
I know my charting style is unconventional, but there has been rhyme to my reason in the past.
I do not understand the significance of this yet, so I present my findings to you all.
Please comment and let me know what you believe is happening here.

BETR Better Home & Finance Holding potential SHORT SQUEEZEOn August 24th, the shares of Better Home & Finance Holding (BETR), a company backed by SoftBank, experienced a drastic decline of over 94%. This downturn came as investors showed reluctance toward the online mortgage lender. The company had recently gone public through a merger with a blank-check company (Aurora Acquisition Corp SPAC) precisely when mortgage rates had surged to the highest levels seen in two decades.
In the case of Better Home & Finance Holding, an overwhelming 95% of Aurora shareholders chose to redeem their shares. This decision left the trust account of the SPAC with approximately $24 million by the end of June, marking a significant decrease from the roughly $283 million it held at the conclusion of the previous year. These details are revealed in filings.
Typically, when a stock has only a small number of publicly available shares, it becomes susceptible to high levels of volatility. Despite trading at $0.77 intraday, it's worth noting that on August 2nd, the SPAC associated with BETR was trading significantly higher, at over $60.
The situation with BETR brings to mind past posts of mine regarding the potential short squeeze scenarios witnessed with AMC Entertainment and GME Gamestop:
Given the limited liquidity in play, I am inclined to believe that a short squeeze might be on the horizon for BETR.
Looking forward to read your opinion about it!

$AMC back to $2.72$AMC looks like it's headed for another low. I could see the potential for AMC to rally up to the $8.30ish region, but if price rejects that range or just falls here, it increases the likelihood that AMC will fall from here back to the $2 range.
The bottom of the blue channel structure has already been tested multiple times and has weakened support. If it breaks the bottom of the channel price should decline quickly-- back to the $2.72 area.
Be careful if you're long.

mmmmh, as expectedI hate AMC because the CEO is a thief, is cheating the people, and I don't know why the SEC is doing nothing. It looks like a very speculative game, so I was expecting to see this since May 10th.
I sold APES and bought AMC because I think APES will disappear.
Today the judge ruled in favor of AMC, allowing them to issue 100% of shares, so now we are diluted 50% with the creation of APE, and 50% of the 50% with the creation of these shares.

$CSSE pop expected 👁🗨️*This is not financial advice, so trade at your own risks*
*My team digs deep and finds stocks that are expected to perform well based off multiple confluences*
*Experienced traders understand the uphill battle in timing the market, so instead my team focuses mainly on risk management*
This afternoon my team purchased shares of Chicken Soup for the Soul NASDAQ:CSSE at $1.12 per share.
NASDAQ:CSSE announced in April that their annual shareholder meeting would take place either on 6/27/23 or around that date. There hasn't been an official announcement since April regarding this meeting but either way no new information is expected to be delivered at the annual shareholder meeting regarding revenue sales (which is what most investors want to see). My team however is still expecting a pop due to the current technical analysis of the chart. Good luck.
Our Entry: $1.12
Take Profit: $1.47
Stop Loss: $1.03
If you want to see more, please like and follow us @SimplyShowMeTheMoney

$AMC Unable To Stay Above 150 Day Moving AverageNYSE:AMC Unable to stay above or Close Above 150 Day Moving Average for more than a few days. It's like someone is selling or shorting every time it closes above it gets slammed back down.

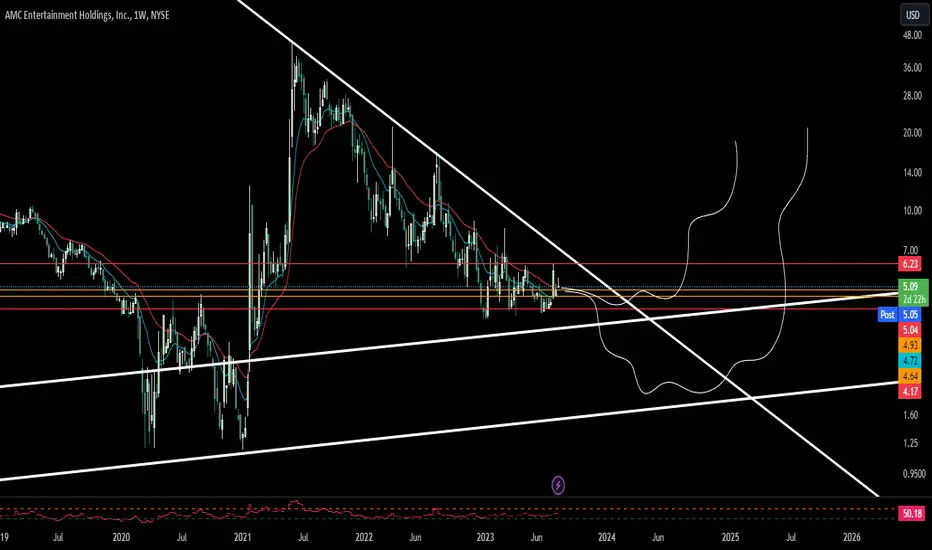
Amc weekly Looking at the Weekly NYSE:AMC #amc chart could still give us one more floor down. or continue to tighten in this wedge as pa is above weekly (orange) support but ones monthly(red) support breaks she is gone. #learn #technicalanalysis #daytrader #stockmarket