AMC Update: What to expect in the next 1-2 Wk's 9/13This Chart has been a work in progress but let me tell you, the process has been great.
Price has hit Pt's but now we begin to get close to the Squeeze.
We have hit a very important line of Resistance (LoR). 52.06 was a LoR that I see started back in the symmetrical triangle that was prevalent when price wanted to touch the Upper or Lowe lines of the symmetrical triangle.
Now that we are back at the low of that range, I believe we are going to see a lot of volatility in/near this range (Red Box)
Inside the range of the Red Box, I have 2 other ranges that I believe are significant Reversal or Continuation areas but Ultimately, we should be seeing Volatility and Upward momentum in/near the bigger range.
The way I see for the immediate short term to play-out is reversal's to the downside at ranges 1 or 3 to the Green line Labeled "2. Green Line". Once we see this range, for us to begin a healthy trend to the upside we need to see a bounce to the upside off that green line. For us to break 2. and assume we are going to the upside still, we would need to fall under the green line directly into a pattern (We wont know from the day that we break the green line to the downside that we will reverse to the upside until a few days plays out for the pattern to form itself) So if we do break the green line when we come back down to re test it to the downside give a few days for the market to do its thing and find entrance opportunities in the case that w do form a pattern.
If we do bounce to the Upside off the retrace to the green line, The best case scenario for us would be a test and breakout above the 52.04 orange dotted line which will send us on a Price Target Path of range 72.92-75.22. How we play-out after the breakout of 52.04 will give us a little more insight on how long it will take and what move we should be expecting to get to that range in the early to mid 70's
NOTE THIS: I stress this LoR soo much because it was the W pattern that we broke out of between the 9th and 10th of September. This is a strong resistance point so anytime price crosses it, many strong moves can take place (Reversal/Continuation with heavy momentum, Dump-Worst Case Scenario, Pattern Beginning- My Personal belief upon crossing the LoR.
Below is the Prediction I made for AMC at the Purple Resistance Line on the 2 Hr Tf.
Happy Trading and remember!
Scared money don't make no money (;
AMC


AMC
This is my price prediction for @AMC stock for upcoming months/weeks
1) Overconservative 83.51
2) Conservative approach 85.75
3) Main 99.39
TIP:
4) 1000 $
AMC/CMA
CMA stands for "Cover my a**," which is another way to say "Help me out" or "Protect me." It is typically used when a person detects some type of danger and asks another person to help him out.
Here is no coincidence
Buy and Hold. :)
@Instruction for the new apes - read this ^^^

BTC - IB announces new Crypto PlatformAbout all we can add at this point is the 41350 Level had better HODL.
Any significant Dip-In with Memes and Coins is going to end in tears for
this retracement.
Institutions are inching down Cryptos in a very managed decline.
It has an ordor of forced panic to it, we shall see.
Meme's are being fileted as Oddessy took the brunt of Citadels squeeze
and Call Piggies are back, there is however some heavy Put buying in AMC,
GME and all the new additions to the WSB's pool of pump a la dump.
Funds predating on Funds... never a good sign.
BBIG SVIT have given way to CCIG... Options with high IB's are typically
idiocy - that said, WSB's has the full on Pump for CCIG.
Difficult to tell how the rotations within will actually make money, but it
is an indication, patience is wearing thin with GME and AMC.
Bankrupting the HOOD is an end goal... Vlad will continue to seek $ from
an order flow which is now coming under even closer scrutiny.
SEC wants to make an example, they have their Target - Degenerate Gamblers.
We continue to add AMC PUTs as well, GME.


AMC ELLIOT WAVE PREDICTIONI see AMC going all the way up to at least the 60 area for the third wave, in the next week or so.

AMC is the sell-off imminent? Harmonious Gartley + Elliot wave German translation below
Symbol / name of the stock / time frame / trading place / currency / precision
---------------------------------------------------------------------------------------------------------
AMC / AMC Entertainment / daily chart / NYSE / USD / 1/1000
---------------------------------------------------------------------------------------------------------
Notice.
All texts as well as the notes and information in this idea do not represent any investment advice or recommendation to buy or sell securities according to (§ 85 WpHG).
Expressly again no buy / sell or hold recommendation no investment advice or the like.
You bear the sole risk for your actions.
As the name already says this is only an idea on my part the expressly not to the imitation call is.
Basis / starting points of this analysis
---------------------------------------------------------------------------------------------------------
All time low 1.910
All time high 72.620
On 05.08.2021, countermovement (wave A) at the 61.8% retracement.
RSI 65.30
XABCD Gartley Pattern
Elliot Waves
---------------------------------------------------------------------------------------------------------
XABCD Gartley
---------------------------------------------------------------------------------------------------------
X= 1.970
B= 72.620
C= 55.953
D= 17.061
X-B= 0.618
X-D= 0.786
A-C= 0.618
B-D= 1.44
C and D are still in execution!
---------------------------------------------------------------------------------------------------------
Elliot waves
---------------------------------------------------------------------------------------------------------
wave 1= 20.360
wave 2= 5.260
Wave 3= 72.620
Wave 4= 20.400 ?
Wave 5 ?
---------------------------------------------------------------------------------------------------------
Description of the idea
---------------------------------------------------------------------------------------------------------
1. after reaching the last all-time high and the formation of wave 3 on 02.06.2021 the price is in a correction phase (ABC) 0= 72.620 A = 28.910 B=? ( 55.829 - 63.322 ) C= ? ( 21.673 - 7.687)
2. on 05.08.2021 the price formed wave A at 28.910
3. with the formation of wave B, I expect in the range of 55,829 - 63,322 (Gartley C)
4. possibility of a short position in the area of wave B SL at 65,000 - 70,000 TP= 21,673 - 7,687 (consider CRV, risk and money management)
5. target areas of the downward movement:
Yellow = Harmonizes with the Elliot wave theory whereby 20,360 Optimally should not be undercut. XABCD Would not be in the range in perfection
Orange = Harmonizes with the Gartley formation, whereby 17,215 would perfect the formation. Elliot wave 4 would already be below wave 1 here.
Red = Lowest area for side D of the Gartley formation, Gartley and Elliot would not have performed Harmonious or Perfection in this area.
6. after reaching the target area of the downward movement, short positions should be closed, when leaving upwards from one of the target areas, long positions could be opened.
Since there is a very large margin here in the downward target range, one should watch closely here and think carefully about how to position.
One possibility here would be that one uses in each case the middle value of the respective area (yellow, orange, red) as an entry, and the spaces between the respective target areas as SL.
7. take profit zones:
The respective colored lines (Yellow Orange Red) in the Take Profit areas, are dependent on the respective entries, from the downward target areas. (Yellow = Yellow, Orange = Orange, Red = Red)
38.2% Range Take Profit Zone 1 32,492 - 41,232
61.8% Range Take Profit Zone 2 47,825 - 53,098
127% Range Take Profit Zone 3 86.257 - 90.144
8th Elliot waves 5 target areas:
Target 1 39,264
Target 2 52.899
Target 3 72,620
Target 4 86.746
Target 5 105.834
9. since the RSI did not fall in the oversold area of 30 on 05.08, my assumption is confirmed that in the target area of the current upward movement (Gartley C), the RSI will be in the oversold area and a strong sell-off will follow.
and a strong sell-off will follow.
I hope you liked the analysis, you should be of a different opinion, and or they have created their own analysis feel free to post it in the comments.
German Version
AMC steht der Abverkauf bevor? Harmonisch Gartley + Elliot Welle
Symbol / Name der Aktie / Zeitfenster / Handelsplatz / Währung / Präzision
---------------------------------------------------------------------------------------------------------
AMC / AMC Entertainment / Tageschart / NYSE / USD / 1/1000
---------------------------------------------------------------------------------------------------------
Hinweis!
Alle Texte sowie die Hinweise und Informationen in dieser Idee stellen keine Anlageberatung oder Empfehlung zum Kauf oder Verkauf von Wertpapieren nach (§ 85 WpHG) dar.
Ausdrücklich nochmal Keine Kauf / Verkauf oder Halte Empfehlung keine Anlage Beratung oder ähnliches.
Ihr tragt das alleinige Risiko für euer Handeln.
Wie der Name schon sagt ist dies lediglich eine Idee meinerseits die ausdrücklich nicht zur Nachahmung aufrufen soll.
Basis / Ausgangs Punkte dieser Analyse
---------------------------------------------------------------------------------------------------------
Allzeit Tief 1.910
Allzeit Hoch 72.620
Am 05.08.2021, Gegenbewegung (Welle A) am 61.8% Retracement.
RSI 65.30
XABCD Gartley Muster
Elliot Wellen
---------------------------------------------------------------------------------------------------------
XABCD Gartley
---------------------------------------------------------------------------------------------------------
X= 1.970
B= 72.620
C= 55.953
D= 17.061
X-B= 0.618
X-D= 0.786
A-C= 0.618
B-D= 1.44
C und D sind noch in der Ausführung!
---------------------------------------------------------------------------------------------------------
Elliot Wellen
---------------------------------------------------------------------------------------------------------
Welle 1= 20.360
Welle 2= 5.260
Welle 3= 72.620
Welle 4= 20.400?
Welle 5 ?
---------------------------------------------------------------------------------------------------------
Beschreibung der Idee
---------------------------------------------------------------------------------------------------------
1. Nach dem erreichen des Letzten Allzeit Hochs und die Bildung von Welle 3 am 02.06.2021 befindet sich der Kurs in einer Korrektur Phase (ABC) 0= 72.620 A = 28.910 B=? ( 55.829 - 63.322 ) C= ? ( 21.673 - 7.687)
2. Am 05.08.2021 Bildete der Kurs Welle A bei 28.910
3. Mit der Ausbildung von Welle B, rechne ich im Bereich von 55.829 - 63.322 (Gartley C)
4. Möglichkeit einer Short Position im Bereich von Welle B SL bei 65.000 - 70.000 TP= 21.673 - 7.687 (CRV, Risiko und Money Management beachten)
5. Zielbereiche der Abwärtsbewegung:
Gelb = Harmoniert mit der Elliot wellen Theorie wobei 20.360 Optimalerweise nicht unterschritten werden sollte. XABCD Wäre in dem Bereich nicht in Perfektion
Orange = Harmoniert mit der Gartley Formation, wobei 17.215 die Formation Perfektionieren würde. Elliot Welle 4 wäre hier bereits unter Welle 1
Rot = Tiefster Bereich für Seite D der Gartley Formation, Gartley und Elliot hätten in diesem Bereich keine Harmonische bzw Perfektionierte Ausübung geleistet.
6. Nach erreichen des Zielbereichs der Abwärtsbewegung, sollten Short Positionen geschlossen werden, beim verlassen nach oben aus einen der Zielbereiche könnten Long Positionen eröffnet werden.
Da hier im Abwärts Zielbereich ein sehr großer Spielraum herrscht, sollte man hier genau beobachten und sich genauestens überlegen wie man sich Positioniert.
Eine Möglichkeit hierbei wäre, dass man jeweils den Mittleren Wert des jeweiligen Bereiches (Gelb, Orange, Rot) als Einstieg nutzt, und die Zwischenräume zwischen den jeweiligen Zielbereichen als SL nutzt.
7. Take Profit Zonen:
Die jeweiligen Farbigen Linien (Gelb Orange Rot) in den Take Profit Bereichen, sind abhängig von den jeweiligen Einstiegen, aus den Abwärts Zielbereichen. (Gelb = Gelb, Orange = Orange, Rot = Rot)
38.2% Bereich Take Profit Zone 1 32.492 - 41.232
61.8% Bereich Take Profit Zone 2 47.825 - 53.098
127% Bereich Take Profit Zone 3 86.257 - 90.144
8. Elliot Wellen 5 Zielbereiche:
Ziel 1 39.264
Ziel 2 52.899
Ziel 3 72.620
Ziel 4 86.746
Ziel 5 105.834
9. Da der RSI am 05.08 nicht im Überverkauften Bereich von 30 gefallen ist, bekräftigt sich meine Vermutung das im Ziel Bereich der Aktuellen Aufwärtsbewegung (Gartley C), der RSI im über kauften Bereich sein
wird, und ein Starker Abverkauf folgt.
Ich hoffe Ihnen hat die Analyse gefallen, sollten Sie anderer Meinung sein, und oder haben sie eine eigene Analyse erstellt fühlen sie sich frei diese in den Kommentaren zu Posten.

$AMC Calls 145 Sept 17th Returns +79,067%AMC Entertainment Holdings, Inc., through its subsidiaries, involved in the theatrical exhibition business. The company owns, operates, or has interests in theatres. As of March 12, 2021, it operated approximately 1000 theatres and 10,700 screens in the United States and internationally. The company was founded in 1920 and is headquartered in Leawood, Kansas.

AMC symmetrical pop coming soon... $20-$30I was minding my own business and AMC came across my path, so I took a look at the day chart. I was ready to plan for a put, but saw a series of higher lows. So I drilled in for a better view on the 1hr & there it was as clear as day. AMC is getting ready to breakout of a symmetrical triangle. I have to play this b/c I believe that my chart matches the text book definition as found on Investopedia. Are you going to play it conservatively with me or all the way? Let's set some alerts and win.
Check the charts:
www.investopedia.com

AMC MOON ?! Elliott wave countIn semi log chart By Elliott wave count indicator we can easily count current wave is wave 4 but we don't know if we are in wave 5 or not, it count be flat correction, current price action still look like bear flag, so price need strength gain momentum to continue bullish, if it break previous high we can more confident it is wave 5, if it break last low which we count c by hand price still correct.
normal target for long is last high.

MARKET ALPHA - HOW TO FIND TRENDLINESIt's extremely important to look at price action where you are looking to place your trendline.
What I like to first start off is with looking at the areas where we have seen either gap up or gap downs. Starting at the most significant relative area to my analysis, I will continue that line, scoping out other gap areas if within reason. Some are very obvious. This one was one of the easier ones to spot.
I would recommend going over this chart and looking to see what it was buyers AND sellers were thinking at that moment. Would a skeptic seller have to become a buyer? Could buyers be running out of cash or is there enough liquidity to keep the stock down? This is where technical analysis comes in. It helps you understand the more important levels easier and faster.
I hope this helps.
Enjoy!
NYSE:AMC

NQ - Fridays / ES YM RTY TLT ZN AMC TQQQ CLNQ is the last to break.
It's Friday.
The FED is providing $8.34 Billion in Coupon Purchases.
1/4 to 1/2 Size today.
We will be watching until 10AM EST, to see IF there is
support of any kind.
Selling pressure yesterday was significant, but
again... it's Friday.
Commentary from 2 prior Sessions does not change.
Have a good weekend - HK

AMC Shares Can Continue To Rise: Pattern FormingTraders,
AMC shares stabilised and started to rise. The price is forming a good W pattern which means that it can go higher from the current level. For the bullish move, we can target the FCP zone.
Rules:
1. Never trade too much
2. Never trade without a confirmation
3. Never rely on signals, do your own analysis and research too
✅ If you found this idea useful, hit the like button, subscribe and share it in other trading forums.
✅ Follow me for future ideas, trade set ups and the updates of this analysis
✅ Don't hesitate to share your ideas, comments, opinions and questions.
Take care and trade well
-Vik
____________________________________________________
📌 DISCLAIMER
The content on this analysis is subject to change at any time without notice, and is provided for the sole purpose of education only.
Not a financial advice or signal. Please make your own independent investment decisions.
____________________________________________________

AMC time to break 50? AMC and GME tend to trend in the same direction and both looking bullish atm
Looks like AMC is headed to test the 52 resistance, then 55 if it can break throug. What do you think?
Not financial advice - happy trading folks

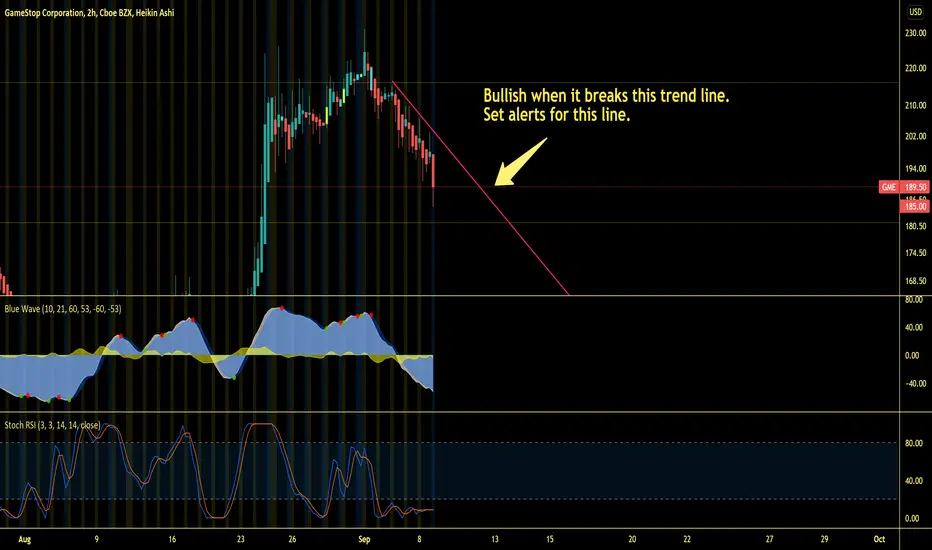
Set your Alerts for thisSet your alerts for this trend line.
GME will have a strong bullish momentum only after it breaks this resistance trend line.
GME extremely bullishGME is looking extremely bullish.
Yesterday I mentioned that GME needs to break this trend line to be bullish.
Don't forget your space suit boys, we're going to the moon!
