$AMC: Don't Miss This!AMC seems to have bottomed out at 13.40$. The market was very slow at the start of the day. Although it caught up at the end of the day. This caused AMC to retrace to 13.40$ before bouncing to 15$. The TD-Sequential displays a red 9 on the weekly chart. This means that AMC is at a very oversold state. If the market starts recovering, so will AMC. The weekly MFI is showing bullish divergence making higher lows. 13.40$ was below the large VPVR node which is located at the mid to low 14$ area. A close below this VPVR node would eliminate AMC and cause a large consolidation. Luckily we managed to close above this VPVR node which indicates that AMC is still bullish. We also managed to close above R1 which is a strong level of support.
Next week i see AMC retesting R2 (Block of resistance) which is supported by little VPVR nodes. If the market bounces AMC will break these levels and start trading back in the 20$ range. For the reversal of AMC to be confirmed we need to close a weekly candle above 22$. This will engulf the previous bearish candles and put us one step closer in to bullish price action. The weekly volume was bearish and it managed to engulf 5 weeks of trading. For next week i am looking for this volume to be eliminated by buying pressure. A confirmation of bullish price action is a break of the R2 block which is located at the 20-23$ level. This move needs to be confirmed with a large amount of volume. From a technical standpoint this could be the end of the bear market. We have had 10 weeks of havoc and we still managed to close above the largest VPVR node confirming it as a support level. I am still bullish on the stock and hoping for upside.
Most of the options activity by volume and open interest is located at 15-20$. Most likely we will trade within this range. If the markets perform well these levels are going to be broken causing a rally for AMC Stock. We need to push to higher levels so that bullish options get in the money which will cause an upswing for AMC.
If the market recovers next week i am expecting AMC to teleport to the 20$ range once again.
*WARNING* This thread is not financial advice. I am not a financial advisor.
Thank you reading!
Amcidea

The Ultimate Reversal of $AMCThese last 2 months have caused a lot of uncertainty for stock holders on the market. This has caused shareholders to exit their positions due to fear of losing capital. The stock market has had a large retracement that is now about to reverse. In approximately 1h we have the Fed meeting. This meeting is going to be crucial for the stock market. If we get bullish news the stock market should see a large bounce. I am expecting AMC to follow this reversal.
As of now AMC has been trading in a descending channel since the 8th of November 2021. This pattern is very bullish and is set to break out very soon. On Monday AMC made a retracement to test liquidity at the 14$ level. This level was the breakout level in May 2021. Old resistance becomes new support. This 14$ level bounced the price a signifficant amount with good volume making it reliable support. This level was also the .706 Fib level if measured at the breakout level of January 2021 at 5$.
At the current state i am not expecting a further retracement. AMC will in my opinion trade far above 14$ per share if the Fed meeting turns out in our favor. A slight retracement to 16.64$ might happen to confirm it as support. If we close daily and 4h candles below 16.64 i am expecting AMC to turn bearish again retesting the high 15$ range. A close above 17$ is a good sign of a bullish reversal. The TD Sequential is printed a red 9 at the 18$ range indicating that this level was the bottom. The TD-Sequential is printing a green 1 engulfing the previous candles. This is an indication of an uptrend. This move is also confirmed by the MFI consistently making higher lows. A short term resistance level is the 18$ level confirmed by a large VPVR node. We also managed to establish strong liquidity at the 16$ range (confirmed by a VPVR node). We also have resistance at 20$ (confirmed by a VPVR node). A break above these levels need to happen quickly so that we reclaim these important levels. I also noticed that the volume keeps engulfing selling volume which is a bullish signal for a potential reversal. If we got an engulfing selling volume at these critical levels i would be bearish on AMC stock. AMC also printed a bullish hammer on the 4h chart + the daily chart. This has caused AMC to close above that candle. This is a sign for a bullish reversal. If AMC closed at or below the bullish hammer it would be bearish causing the stock price to plummet.
The largest confirmation of this bullish reversal would be a 4h TK-Cross on the Ichimoku Cloud. This movement would have to be confirmed with a signifficant amount of volume. As long as the Ichimoku Cloud is being used as resistance AMC will remain trading under a bear market.
Looking at the options chain there is 25k Volume and 7k Open Interest at the 17$ level. We also have 40k Volume + 8.5k Open Interest at the 18$ level. At the 19$ level there is 21k Volume + 11k Open interest. We also got 33k Volume and 13k Open interest at the 20$ level. This options chain hints that AMC will be trading at or above these levels to keep these options in the money. The 14-15$ level are unlikely to be revisisted due to the fact that these options do not have a lot of Volume and Open Interest (3.7k Volume, 2.8k Open Interest, 15$).
If the Fed meeting goes well my conservative price target of the week is the 22$ level.
*WARNING* This thread is not financial advice. I am not a financial advisor.
Thank you for reading.

AMC Trade IdeaIt looks AMC bottom out and you can take entry if it crosses above 16.64 and hourly candle close above 16.64, if that's the case you can ride till 19.73 and take profit there and wait, If it crosses channel's middle dotted line then ride till 26.00 and take profit. but play within channel and 2 green bands for now and do not gamble big in the hope of Squeeze.

AMC to test the support lineIf you haven`t sold when the CEO did it:
then you should know AMC will most likely touch another strong support, the 14 usd.
My buy area is from 8 to 12usd now.
Looking forward to read your opinion about it.

The Rise of AMC! (HUGE UPSWING LOADING!)AMC has been trending in a descending channel with descending support and resistance. This channel was formed on the 8th of November 2021. The descending formation is valid due to the fact that we get selling pressure once the line of resistance is toutched causing a dip with bearish volume. The lower lines are levels of support. Notice the fact that these lines tend to bounce the price for AMC to hit resistance.
As of now AMC has filled the gap at 16.50$. This level caused AMC to bounce all the way to almost an 18$ close. That level of support is valid and supported by a good amount of bullish volume. The daily volume engulfed the recent bearish volume which is a bullish reversal sign. We also wicked below the .786 Fib which later caused the price to have a short term bounce and we managed to close a daily candle above this Fib level. The bad thing about this is the fact that the S&P 500 dropped signifficantly at the end of the day bringing selling pressure to AMC.
We need to start pushing back up to the 20$ range which is a large VPVR node that indicates resistance. This level needs to be reclaimed as support to keep AMC moving to the upside. If all of the indexes are strong AMC should follow nicely causing a pretty decent upswing. Currently we are bearish due to the fact that we are trading below the Ichimoku Cloud and the 200SMA. I also noticed the fact that the MFI is at a really low level. Last time the MFI was this low AMC had a nice 50% upswing before being rejected by the 200SMA. The minimum price target of this descending channel is where it started which puts us at the mid 40$ range.
There is also a slight possibility that we see a short term retracement to the 14$ range. This level is the largest VPVR node which would be the strongest level of support on this chart. A touch of this will make AMC bounce 5-15$ on the same day. A retest of this area would occur if the markets see a continuation of the current downtrend. Bad news on the FED meeting could cause the stock market to continue the bearish trend which could lead AMC to 14$ causing a massive spike in the price to the upside. I am not of the belief that this is going to play out due to the fact that the daily MFI is already really low. We also got an engulfing bullish volume on the 21st of January which eliminates all of the previous selling pressure.
Looking at the options chain we have a lot of volume and open interest at the range of 18-20$. Most likely AMC will be trading in this region if the stock market doesn't bounce. Closing daily candles above these levels will cause bullish options heading in to the money which will cause the uptrend of AMC. There is a good amount of volume and open interest at the 25$ range set to expire on the 28th of January. Hopefully we reach this level so that we begin a new uptrend.
A confirmation of the AMC bull run will be if we see a bullish TK-Cross above the Ichimoku Cloud with a large amount of buying volume and the MFI making higher lows.
If the market starts to recover this week i am expecting AMC to retest the 22$ range. A break of this level and a daily close above 23$ will put us in a good position for an upswing.
As mentioned in the previous thread my long term conservative price target of AMC is 145$/share.
*WARNING* This thread is not financial advice. I am not a financial advisor.
Thank you for reading!

AMC Entertainment Analysis 20.01.2022Hello Traders,
welcome to this free and educational analysis.
I am going to explain where I think this asset is going to go over the next few days and weeks and where I would look for trading opportunities.
If you have any questions or suggestions which asset I should analyse tomorrow, please leave a comment below.
I will personally reply to every single comment!
If you enjoyed this analysis, I would definitely appreciate it, if you smash that like button and maybe consider following my channel.
Thank you for watching and I will see you tomorrow!

AMC 600% SWING INCOMING? (TARGET 145$!)AMC has been having a weekly bearish trend since the june run-up 2021 which saw its stop at the 70$ territory.
As of now we are trading in a huge bull-flag which is a bullish reversal pattern. A breakout of this bullish pattern would cause AMC to go wild. For this breakout to be valid it has to be confirmed with an engulfing volume. The trading volume needs to close above all of the bearish volume to be sure that a big move is on the way.
At the current state we are trading below the 200SMA and the EMA Ribbons are used as heavy resistance. Once the EMA Ribbons are toutched we are receiving bearish volume which creates bearish divergence on the MFI and causes the price to plummet.
The weekly chart is looking very promising due to the fact that we are seeing a red 8 on the TD Sequential. This indicator has been very accurate on the weekly chart of AMC. Once these numbers are displayed on AMC it often causes a large swing in the price to the upside. The TD Sequential red 8 i am looking at is the previous level of AMC which is marked with a green arrow (before the huge run up). At that current moment we had "dead volume". The MFI was in a large downtrend which is identical to the current state of AMC. By viewing this i am getting a clear insight of how the stock is going to move. I am of the belief that a large run up is getting very close. It is going to be unexpected for a lot of people. It will cause a shock in the market. This upswing could come out of nowhere. I also did a Fibbonacci measurement from the old red 8 (old bottom of AMC) to the new top (72$). This indicates that the price has room to go to a minimum of 145$. At that level we will face a lot of resistance due to the golden trendline. Last time weekly chart displayed a red 8 AMC 600%.
The only thing stopping us right now from reaching higher levels is the current option chain that expires Jan 21 (2022). We have heavy options in the money with a signifficant amount of open interest holding the price of AMC in a bearish territory. If AMC manages to close the week above 21$ these options will be useless and the shorts will be screwed. Once the bullish 40$ and mid 30$ options with a high open interest start getting in the money we will break the EMA Ribbons and the 200SMA and then AMC will go to the moon!
LFG APEARMY!
*WARNING* This thread and analysis is not financial advice, i am not a financial advisor.
Thank you for reading!

AMC CEO sold another $7.1 million shares this weekAdam Aron, AMC`s CEO sold 312,500 shares on Tuesday, according to a filing with the U.S. SEC.
His total proceeds since November is $42 million.
Aron has still 2,302,760 shares worth more than $52 million based on AMC’s latest closing price, or maybe even less if AMC will fill the Gap to $16, which is possible.
After retail investors saved the company from bankruptcy, the CEO dumped a lot of shares lately as an act of gratitude.
Thanks, Adam!

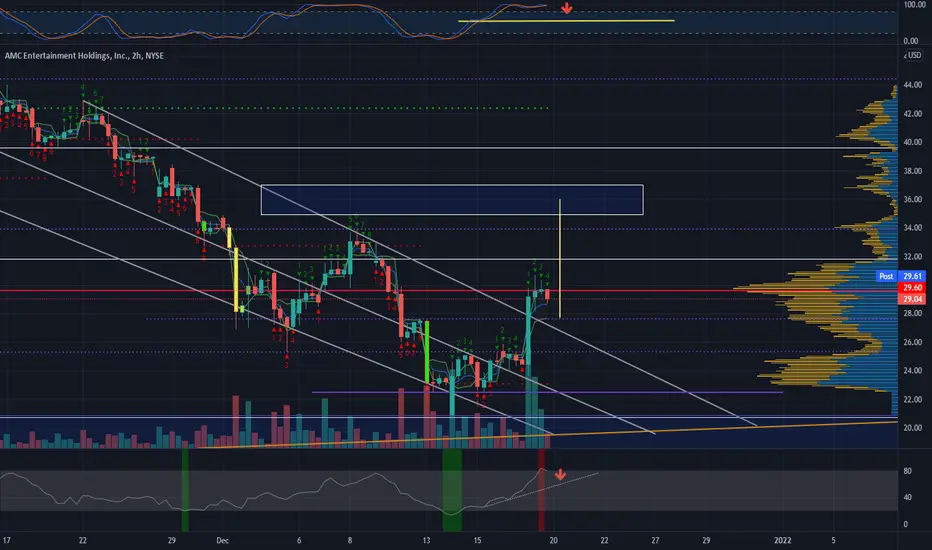
AMC Santa Claus rally Incoming?AMC is starting to break the descending channel that has been ongoing since the 16th of November (2021). AMC has been trading under descending resistance and descending support. That has pushed the price below the 200SMA which has made AMC enter a bear market. Right now AMC had a short term retracement to the high level of 26$-27$. Price does not want to get rejected at these levels. The price 26-27 remain strong support levels confirmed by volume. As of now AMC is looking to break the VPVR node which is located at 29.5-30$. That is a large resistance to break. Once broken witch a significant amount of volume and respected for a good amount of trading hours it will become a stong support level.
On the 2h Chart AMC is looking very bullish due to the fact that we have a bullish TK cross above the Ichimoku Cloud. This is usually a signal of a strong uptrend. As mentioned in my previous idea about AMC we are in a inverse head and shoulder formation. The right shoulder of the pattern is right now under construction almost at the finish line.
Next resistance from here will be the 200SMA + bearish OB (Orderblock) resistance at 32-34$ which could drop the price for a slight retracement back to 30$.
The MFI is indicating bullish divergence which means that AMC has started a potential reversal to the upside. It also looks like AMC has formed a good amount of support at 28.5$ which is a large VPVR node that needed to be broken today for AMC to enter a bull market. So far everything looks fantastic. I am hoping that AMC pushes to 32$ by the end of the year to put a lot of options in the money which will later push the price above the 200SMA and confirm a large upswing on AMC. The indexes are still looking strong (S&P 500, Nasdaq 100, US30) which will help AMC break resistance and enter a bull market after being bearish for over a month. In my opinion January is going to be an amazing month for AMC share holders.
My pricetarget of the inverted head and shoulders is still 40$ as mentioned previously if we break the 200SMA + the bearish OB which is at the neckline of the inverse head and shoulders.
*WARNING!* This idea should not be taken as financial advise. I am not a financial advisor.
Thank you for reading.

AMC Needs VolumeGood morning everyone. Past couple trading sessions was very low volume so I'm not too worried about the support break on Wednesday. What we need to see is more volume come in the stock for a push over 28.75. We do that we can easily test the $30 area resistance.

AMC 40$ incoming?Amc has been forming a huge inverse head and shoulders pattern. This pattern is very bullish. A breakout of this pattern could lead us back to 40$. AMC has a gap in the chart at 39$ which could be filled in the near future. The confirmation of this technical pattern is a break of the neckline which is on a very critical zone. We have the neckline resistance, the 200SMA and a bearish OB (Orderblock) all together at the neckline of the inverse head and shoulders. To confirm bullish activity a break of the neckline at 33$ would need to happen with a large amount of volume making the 200SMA, the bearish OB and the neckline of the inverse head and shoulders a strong level of support. A bullish TK cross above the Ichimoku cloud would also be needed to secure the trade.
At the current state the MFI indicates that a short term downtrend is forming. This could lead us to the lowest point of the Ichimoku cloud which is at 25.4$. That would complete the right shoulder of the pattern and would probably bounce the price above the neckline 33$. Once the MFI shows bullish divergence and is making higher lows with a signifficant amount of volume breaking the 200SMA and the bearish OB at 33$ it could lead to a big breakout. The options activity will be the largest factor of a breakout. If a lot of bullish options are in the money it will drive the price to higher levels. THE S&P 500, US30 + Nasdaq look bullish which is a good boost for the price of AMC. We are at the current state below a large VPVR node which is used as resistance at 29.5$. This level is strong resistance which pushes the price down once it is touched. AMC is also in the end of a downtrend which is very close of being broken. This downtrend is strong resistance. Once this line is touched we see large selling pressure confirmed by volume which drives the price to lower levels.
This technical analysis should not be seen as financial advice. I am not a financial advisor. The analysis is only for entertainment purposes.
Thank you for reading.

AMC: Turnaround! ↗️With entering the light blue zone, the AMC stock has theoretically reached a region where new surges are possible. However, we believe that the course will further decrease towards the area around $18.04. From there, our expectation centres around new surges past $52.79. A direct increase has a probability of 30% currently.
Already happy holidays!

$AMC retracement to 27$ before the break of the 200SMA?AMC has seen a huge rally the past couple of days. This large movement got rejected by the 200SMA at the 32$ range. This is heavy resistance due to the fact that this level contains a bearish OB (Orderblock). The 3h chart indicates that AMC will remain in a bear market a short period of time due to the fact that we haven't gotten a single 3h candle closing within or above the Ichimoku Cloud. The Cloud is being used as resistance. I am looking for a retracement to the 26.85-27.75$ range to hopefully bounce the price and close a candle within or above the Ichimoku Cloud on the 3 chart. Todays dip was driven with low volume which indicates that people are holding their shares.
AMC also closed below a large VPVR node at the 29-30$ level which is seen as strong resistance. The MFI indicator looks to be overbought which could lead to some minor bearish divergence. I would be surprised if AMC bounced from here due to the fact that the there are no reversal signals. We could have a short term runup to get rejected by 29.5$ which could later lead to a deeper retracement. My hopes are that this retracement happens quickly so AMC can get out of the 20's and hopefully break the 200SMA at 32$.
26.8-27.8$ has been heavy resistance before the move to 20$ confirmed with a signifficant amount of Volume. A retest of the previous top (resistance) would be a healthy retracement for AMC. I personally have buy-orders set at 26.85$. If this zone doesn't get hit my order will be adjusted.
A safe entry for AMC would be a daily close above the Ichimoku Cloud and the 200SMA. When the 200SMA is used as support with large volume backed up by the MFI and the Ichimoku Cloud this would indicate that AMC is trading in a bull market. This would lead to the next bull-run up to the 50's.
Also keep an eye on the options. There are some interesting calls out there that could be driving AMC to a new uptrend. The days to cover are rising according to Fintel which could indicate that a short squeeze is near. The short interest of AMC seems to be above 20%.
This analysis should not be seen as financial advise. I am not a financial advisor.
Thank you for reading and feel free to give me your thoughts on AMC.

AMC Held SupportNice hold at the 28.79 area. Next test is the 30.50 area then TL with major resistance right behind it at 31.74 area. Good luck out there. Ape strong
P.S. - This is the first time I've noticed a check box to abide by the house rules. For any sick asshole that attacks other people online, whether it a moderator or not, should do some soul searching and be a better human. Don't like what you see? Click away and move on.

$AMC Spider-Man Rally IdeaI am thinking $30 for a long term hold in IRA. There seems to be a lot of hype around Spider-Man and I personally went to the movies to watch it. It felt good seeing a packed movie theater again.

AMC Cup with Handle (Target 36$)AMC made a perfect bounce of the 0.786 Fib level (20$ level) earlier this week. This lead to a technical breakout above the 25-26$ level of resistance. We have established strong support at the 25-26$ range with signifficant volume spikes. We are at the micro times frames trading above the VWAP which was previously seen as resistance becoming new support. I am looking at a healthy retracement to the low 28's or 27.7$. These levels should hold. Otherwise i am expecting 26.7$ as a strong support zone which should lead to a good bounce.
At the current time we are overbought on the MFI and the Stochastic. We also haven't managed to close above a huge VPVR resistance node at the 29.7$. This could push the price for further downside but is in my opinion unlikely due to the fact that AMC has started to trade with higher volume. AMC is currently on a short term uptrend with increasing volume. Remember the trend is your friend and that volume predicts price.
We are on the 2h chart seeing a cup and handle formation. This is a very bullish pattern. I am expecting a little dip for the creation of the handle towards the high 27$ range. Tis would create the handle and bounce the price to 34$. If this level of resistance is broken (34$) with a high amount of volume making it new support we are going to trade above the 200EMA which is a bullish reversal sign. The cup and handle formation could lead to a break of 36$ which would make us fill the gap at 38.8$. At this point of time i am expecting a signifficant amount of FOMO-Buying which could bounce the price even more up to the daily VPVR level of 40$. If the overall market sees a bounce AMC should follow nicely which could lead to the continuation of the uptrend.
The target of 17$ that a lot of people in the AMC community have been speculating is not likely at the current state.
*WARNING* (This article should not be seen as financial advise. I am not a financial advisor.)
Thank you for reading
AMC Trade IdeaAMC still holding strong today, If it had to fall then today was the day but it looks like it will rise back to $29.50 before any fall further.
share.trendspider.com
AMC Trade IdeaThough AMC is going higher but do not think it's back to bullish pattern, this is just a regular Pullback Trade and if you are in a buy trade then take profit at $28.31, yes It can go to $29.77 but do not wait for it and better book profit at $28.31.

MOASS or loss porn? An opinion on AMC Entertainment.Dear babbling smooth brained baboons of the interweb, it's your ol’ boy Magnus here!
I have come to present a case for AMC. I do believe we are about to witness the end of the “battle for $40” in the war of “The smooth brained simians vs. The hedgies“.
Now dear fellow, I know you have never seen such artistic magnificence before! But do stop licking the screen and allow us to move along, ei?
Well, as you can see. According to my most sophisticated calculations we should either MOASS or have lots and lots of epic loss porn for our ape brethren over at r/wallstreetbets before the year is out!
Disclaimer: This is not financial advice. It is an opinion. Magnus is not a financial advisor.

AMC Looking bearishRejected at a heavy resistance area and fell back below TL. Currently trading below major support in after hours. If those levels hold, this doesn't have much stopping it from coming down. Be careful out there.

AMC you need this supportYou need to break above 31.74. That's a major area of resistance. If you can't, there's not much catching this thing. Good luck.

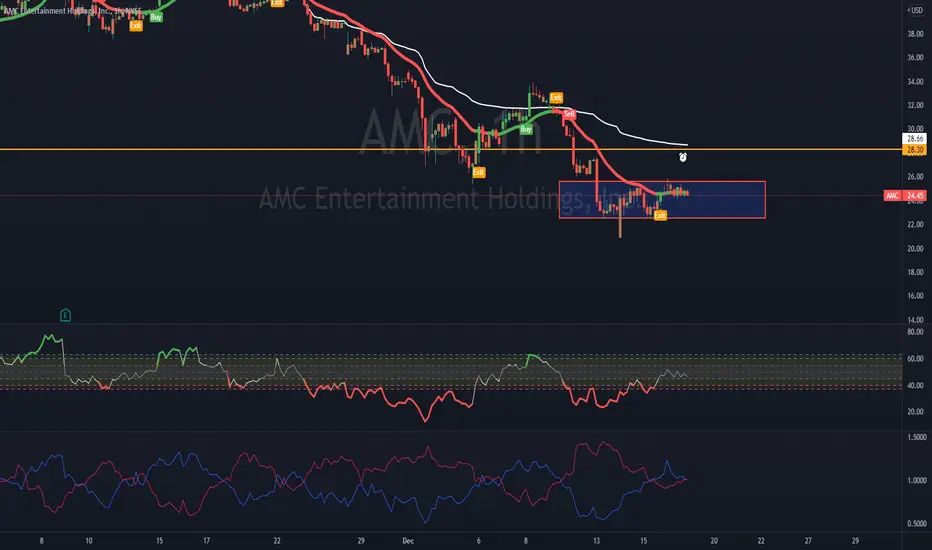
$AMC Trade IdeaAs per the current analysis and wave trend, AMC is not looking to go back into $40 or higher anytime soon. Yes, There is a possibility it will rise and touch the last wave low around $34.51, but then it looks like going down to $29.43 followed by $24.35 or even lower. Long term short trend persist.
Wait for the breakout at 32.06 if that happens, yes it's going to $34.51 latest or max.

AMC Entertainment Price Target after bouncing from SupportAfter AMC went higher after break-even on cash flow news:
now it bounced from it`s last support before a major GAP.
My price target is the $40 resistance.
Looking forward to read your opinion about it.
