INTC IS A BIG LONG TERM BUY TRUST MEINTC is looking very good my friends. It is a good time to buy long and hold. Minimum position length I would say 2 months. Maximum length infinite. Do not be dumb. INTC is INTC we are living in computer world. NOW REMIND ME WHAT CPU STANDS FOR. CENTRAL PROCESSING UNIT. WITHOUT CPU THEN COMPUTER IS MORE LIKE PPU (POOPY POOP UNIT) ONLY 2 BIG CPU AMD AND INTC AMD IS BEING PPU BUT INTC BEING BCPU (BEAST CENTRAL PROCESSING UNIT) so be smart my friends. ride with me into Valhalla. WITNESS ME
AMD

AMD Wyckoff Accumulation, Manipulation, and Distribution 📈💹📉 The Wyckoff Phases Recap: The Wyckoff method consists of Accumulation (smart money buying), Manipulation (price action controlled by insiders), and Distribution (smart money selling) phases.
📈 Applying Wyckoff to AMD: We can adapt this method to AMD stock. During Accumulation, savvy investors may be accumulating AMD shares quietly. Manipulation is when price action might seem unpredictable but is driven by insiders. Distribution marks the phase where these insiders might start selling.
📊 Accumulation Signals: Look for signs of increased buying activity in AMD while prices remain relatively flat. This could indicate the accumulation phase.
💡 Manipulation Hints: Manipulation can be tricky to spot, but unusual price movements or volume spikes might provide clues. Consider this phase as a time of price consolidation before a potential move.
📉 Distribution Clues: During the distribution phase, watch for decreasing buying interest and potentially diverging indicators. This might indicate that insiders are slowly selling off their holdings.
🚀 Trading Opportunities: If you can identify these phases correctly, you might find opportunities to trade AMD more strategically. For example, entering during Accumulation when prices are low and potential upside is significant.
🔮 The Future of AMD: Keep in mind that while Wyckoff analysis can provide valuable insights, no strategy guarantees success. Always combine it with thorough research and risk management.
In conclusion, applying the Wyckoff method to AMD stock can offer a unique perspective on its price movements. Recognizing the phases of accumulation, manipulation, and distribution might empower you to make more informed trading decisions.
Stay analytical, stay vigilant, and remember – understanding market phases can give you an edge when trading AMD or any other asset! 📊🚀

$INTC - Rising Trend Channel [MID-TERM]🔹Between support 32.86 and resistance 37.24 in Rectangle Formation.
🔹In case of a NEGATIVE reaction, it has support at approximately 33.
🔹Technically POSITIVE for the medium long term.
Chart Pattern:
◦ DT: Double Top | BEARISH | 🔴
◦ DB: Double Bottom | BULLISH | 🟢
◦ HNS: Head & Shoulder | BEARISH | 🔴
◦ REC: Rectangle | 🔵
◦ iHNS: inverse head & Shoulder | BULLISH | 🟢
Verify it first and believe later.
WavePoint ❤️

Adv. Micro Dev. (AMD) -> Breakout TimeMy name is Philip, I am a German swing-trader with 4+ years of trading experience and I only trade stocks , crypto , options and indices 🖥️
I only focus on the higher timeframes because this allows me to massively capitalize on the major market swings and cycles without getting caught up in the short term noise.
This is how you build real long term wealth!
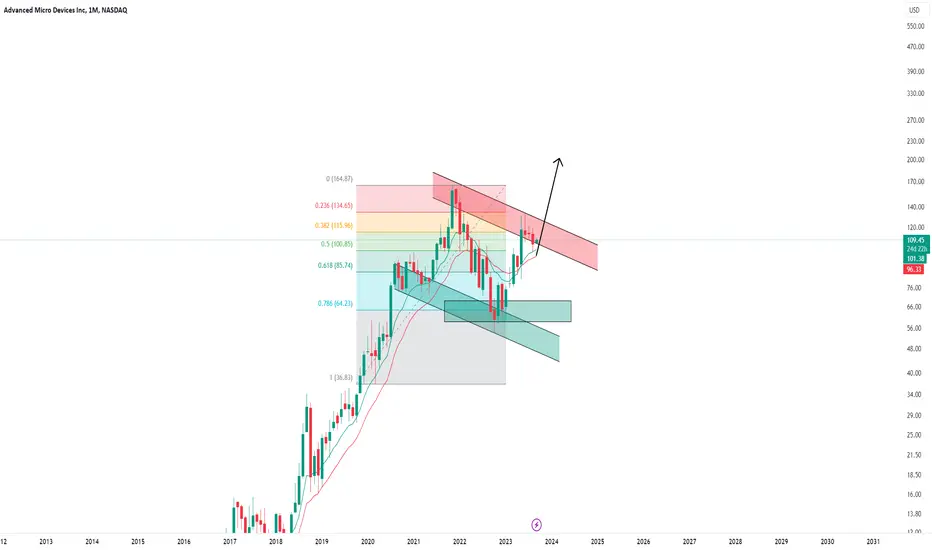
In today's anaylsis I want to take a look at the bigger picture on Advanced Micro Devices.
Just 9 months ago - after a quite harsh drop of more than 60% - Advanced Micro Devices perfectly retested the 0.786 fibonacci retracement level and reversed towards the upside.
With the overall trend still being massively bullish I am now waiting for and expecting a bullish breakout of the current flag pattern with my upside target being the previous all time high.
- - - - - - - - - - - - - - - - - - - -
I know that this is a quite simple trading approach but over the past 4 years I've realized that simplicity and consistency are much more important than any trading strategy.
Keep the long term vision🫡
AMD BUYHi, According to my analysis of AMD stock, there is a good opportunity to buy. Or a long-term investment. All reasons for purchasing are explained as shown in the analysis. Good luck everyone

AMD - Up to "All time high" ? AMD - Up to "All time high" ?
A popular stock + Above 150MA + continuation in Uptrend channel.
20% profit potential.
(In case it goes below the 150MA, I will exit the position).
Only an idea & not a recommendation for trading !

AMD Swing TradeLooking to enter Calls at $100 area (demand)
Hoping to enter prior to NVDA earnings release on Aug 23rd.

AMD supported by the high point in late March of this year!AMD supported by the high point in late March of this year!
This chart shows the weekly candle chart of AMD's company stocks from May 2021 to the present. The top to bottom golden section at the end of 2021 is superimposed in the figure. As shown in the figure, the recent high point of AMD company's stock has been suppressed by the 1.000 position of the top to bottom golden section in the figure! Then, AMD company's stock engaged in a long short competition between the 1.382 to 1.618 positions in the golden section of the chart from late June of this year to the beginning of this month. In the past three weeks, it has broken down and was supported by the high point in late March of this year! Just use the high point in late March this year (102.43) as the long short watershed for AMD stocks in the future!

AFRM - Rising Trend Channel [MID-TERM]🔹Breakdown support of rising trend channel in the medium long term.
🔹Support at 13.81 and Resistance at 19.99 in Rectangle formation
🔹Slightly risen above the resistance level of 17.
🔹Technically POSITIVE for the medium long term.
Chart Pattern:
🔹DT - Double Top | BEARISH | 🔴
🔹DB - Double Bottom | BULLISH | 🟢
🔹HNS - Head & Shoulder | BEARISH | 🔴
🔹REC - Rectangle | 🔵
🔹iHNS - inverse head & Shoulder | BULLISH | 🟢
Verify it first and believe later.
WavePoint ❤️

AMDAMD is currently trading right above the golden pocket and trendline. This confluence is very bullish in my opinion after a massive selloff, in the past few days.
A long here wouldn't be a bad idea IMO but make sure to use proper risk management.
#ManageYourRisk
Every day the charts provide new information. You have to adjust or get REKT.
Love it or hate it, hit that thumbs up and share your thoughts below!
Don't trade with what you're not willing to lose. Calculate Your Risk/Reward!
This is not financial advice. This is for educational purposes only.

The Last Nail to the Coffin of Random Walk Theory..!In this article, I want to make my argument against the famous Random Walk Theory:
First, let's see if the simplest thing that we think is Random and generates random outcome is really random:
Coin Flip
The most compelling finding that raises concerns about the validity of the coin toss comes from the use of mechanical coin flippers, which can be made to impart exactly the same initial conditions for every toss, namely the starting position, velocity, and force. In these cases, the outcome can be high, if not entirely, predictable.
Coin tossing becomes physics rather than a random event. It is the human element that makes the process random in that each toss tends to be at a different speed, sent to a different height, launched at a different angle, or caught in a different manner. Therefore, the possibility of practicing the task to reduce these different elements can be considered. If you try to toss the coin the same way each time, you should be able to make the outcome significantly different than 50:50.
A limitation of our study is the uncertainty about whether the individual results are repeatable. However, we conclude that the validity of using the toss of a coin to provide a random 50:50 outcome is thrown into doubt, both in medicine and everyday life.
www.ncbi.nlm.nih.gov
Now let's review My AMD analysis:
Please go to each of them, push the play button and see what is happening and then ask yourself if the market is a random phenomenon???
Obviously, AMD has had a Complex correction since December 15, 2021, but I predict all the moves correctly ..!
Another important thing to consider is in 1973 when Random Walk Theory was born, there was no computational power..!
at least Mr. Malkiel had no access to today's computational power!
The Biggest Secret of Rentech is that:
It was Jim Simons who build a good team and made the most money, but it was not him who solved the market..!
Think about...
Best,
Moshkelgosha
DISCLAIMER
I’m not a certified financial planner/advisor, a certified financial analyst, an economist, a CPA, an accountant, or a lawyer. I’m not a finance professional through formal education. The contents on this site are for informational purposes only and do not constitute financial, accounting, or legal advice. I can’t promise that the information shared on my posts is appropriate for you or anyone else. By using this site, you agree to hold me harmless from any ramifications, financial or otherwise, that occur to you as a result of acting on information found on this site.

NVIDIA - Bears, This Is Your ChanceIn a previous post on NVIDIA following its earnings gap all time high, I posited that a bearish three drives was a real possibility, which would involve the stock actually going down and then driving up a few more times in accordance with the overall market topping:
NVIDIA - A Scenario Few Are Considering. Few. Few. Few.
That never panned out, and instead what we're looking at instead, as you can tell with all the insider selling, is a very likely bump and run reversal.
But distribution patterns take a very long time to manifest, and one of the biggest tells with NVIDIA is despite it going from $366 to $440, it really has never targeted the sell side, not even rebalancing the original gap.
As far as this company goes... well, when you come across something like this whose CEO is a Taiwanese dude prancing around in a leather jacket for every photo op while it's trading like a Chinese Communist Party pump and dump, a number of red flags beyond the 250x P/E it's trading at should emerge.
Companies and their officers who have connections to the CCP are very dangerous, for the geopolitical situation is tense. Much is at stake right now with Mainland China and whether or not Xi Jinping is intelligent enough to get rid of the Party.
If Xi can't get rid of the Party, then the International Rules Based Order will do it for him and will go to install their own people from Taiwan in the Mainland.
Xi always has the option to weaponize the 24-year persecution of Falun Gong, started by the Jiang Zemin faction that's rooted in Shanghai, to take down the Party and defend China from the groups that wish to invade.
Live organ harvesting isn't a sin that can survive public scrutiny, really.
None of this is healthy for the markets, and if you're long on stocks at the top, some of them aren't coming back.
The indexes might come back, but many companies definitely go to zero and will be replaced by a future generation.
When you look at NVIDIA on the monthly, does this look like somewhere that you want to go long?
A monthly "gap" like this will certainly always be filled, and it just happens to be right around the actual level we're looking to target.
The weekly bars are severely ranged compressed, which tells us that a big move is coming
I have a call on that Nasdaq that we're about to get a pretty violent and serious correction, but that it will really be a bear trap:
Nasdaq - The Great Bear Trap
You might feel right now that stocks ONLY GO UPPY. But considering you're in a bear market and these things have been mooning for like an entire quarter right now, you might want to check that notion before that notion wrecks you.
The problem with NVIDIA going and making a new high right now is it's failed to do so twice. Friday's end of the day was a big rejection on everything Nasdaq.
And this is a time when price stopped just 1.8% short of the high.
So what it was really doing was covering the old range, and taking stops over the most subordinate high to the all time high.
Another big tell is the SOXS and SOXL 3x leverage semiconductor ETFs are simultaneously setup on weekly and daily candles to breakout/retrace, and both started to do that in sync on the Friday dump.
NVIDIA is the top component of the index underlying the ETF at roughly 9%.
The most obvious place for it to retrace to to start taking out sell stops is the $395 gap.
But this is only 5% at this point and not very scary.
Meanwhile, all the bulls and all the bears start selling on a break of $366, because Discord and Reddit told them to and some books and guru videos told them to "because confirmation."
Once the gap is finally balanced, I believe that Nasdaq is going to rip to something like 16,000 before we're done, and NVIDIA will actually finish its lifespan with a 5-handle.
So for bears: here's your opportunity. But you better have realistic expectations.
For bulls: here's your opportunity. But you better have patience in buying the dip, and you'll find you "made a lot of money getting out of the market too early."
And for bulls and bears: stay away from ponzi companies and social distance from the CCP and all the Marxist-Leninist and atheist things.
If you don't, you'll face more than the liquidation of your brokerage accounts, to say the very least.

Nvidia completing new base buy 478.Nvidia completing new base , buy at 478 above on new breakout.
Next target 600-800-1000.
on going process.
do expect some correction in between.

Wyckoff Cycle - AMD Setup 📊🎢🔍 Phase 1: Accumulation 📈
Imagine a market that's been in a downtrend, beaten down and disheartened. This is the accumulation phase, where savvy investors slowly start scooping up assets at bargain prices. It's like finding hidden treasures amidst the rubble. Prices might move sideways or slightly up, creating a sense of stability.
🎭 Phase 2: Manipulation 🕵️♂️
As accumulation continues, the market sentiment shifts. The smart money players start flexing their muscles. Prices might experience sharp upward spikes, tricking the crowd into believing a new bullish trend has begun. This is the manipulation phase – a time when market manipulation is at its peak. The goal? To create FOMO (fear of missing out) and draw in unsuspecting traders.
📉 Phase 3: Distribution 📉
Just when everyone thinks the party is getting started, reality checks in. The market takes a nosedive, catching the latecomers off-guard. This is the distribution phase – where the smart money players start offloading their assets at inflated prices. The unsuspecting crowd buys in, only to face a sudden and often brutal downturn.
💡 The Cycle's Dance: Accumulation, manipulation, and distribution create a rhythm that repeats in the market. It's like a choreographed dance between the smart money and the crowd's emotions. Understanding this cycle can give traders a leg up in spotting potential trends.
📊 Mapping Opportunities: Traders keen on capitalizing on the Wyckoff cycle often look for signs of accumulation, observe price manipulation tactics, and stay cautious during distribution. It's all about knowing the dance steps and staying ahead of the game.
So, what's the bottom line in the Wyckoff cycle? 🎢 It's a market ballet of accumulation, manipulation, and distribution – a sequence driven by the dynamics of smart money and crowd sentiment. By recognizing these phases, traders can potentially align their strategies for a smoother dance through the market's twists and turns.
Stay curious, stay vigilant, and keep your eyes on the dance floor of trading opportunities! 🚀🕺
❗See related ideas below❗
Follow + Like this post and leave a nice comment, it will allow me to move faster and make more useful content! 💚💚💚

NVDA - Rising Trend Channel [MID-TERM]🔹Breakout floor of a rising trend channel in the medium long term.
🔹Resistance at 470, which could potentially trigger a NEGATIVE reaction, but an upward breakthrough indicates a POSITIVE signal.
🔹Technically POSITIVE for the medium long term.
Chart Pattern:
🔹DT - Double Top | BEARISH | 🔴
🔹DB - Double Bottom | BULLISH | 🟢
🔹HNS - Head & Shoulder | BEARISH | 🔴
🔹REC - Rectangle | 🔵
🔹iHNS - inverse head & Shoulder | BULLISH | 🟢
Verify it first and believe later.
WavePoint ❤️


AMD Potential continuationI like this as continuation for the upside move.
I personally will be looking for buy at 100$,
80$ red zone as deeper discount buy.

AMD Still a buy as long as the 1D MA100 holds.Advanced Micro Devices (AMD) is trading on its 1D MA50 (blue trend-line), still within the 10 month, maintaining its buy status. As long as the 1D MA100 (green trend-line) holds, we will be long and target the 165.00 All Time High (ATH). If the price closes a 1D candle below the 1D MA100, we will take the loss and open a sell, targeting the 0.5 Fibonacci level at 95.00, on a potential contact with the 1D MA200 (orange trend-line) too, which is intact since March 02.
-------------------------------------------------------------------------------
** Please LIKE 👍, FOLLOW ✅, SHARE 🙌 and COMMENT ✍ if you enjoy this idea! Also share your ideas and charts in the comments section below! **
-------------------------------------------------------------------------------
💸💸💸💸💸💸
👇 👇 👇 👇 👇 👇

AMD - Greed Doth Bad Habits BreedI've noticed that, especially in the last week, the trading community has really transformed into almost full bore greed. People are buying highs on almost anything, especially some of the most dubious of stocks, and getting rewarded with 5-15% gains every day.
There's even a popular post on here that asks "As new highs approach, what is the bear case?"
Whenever the climate is like this, you really, really have to take a step back and cool your head.
If we were in a sustained bull market like we had in 2021, greed may ostensibly be fair enough. But when the Fed rate is at 5.5 percent and there aren't going to be cuts, with 6% enroute before year end, and TBond yields acting like they want to court with 4.5% or 5%, you're sort of in the Twilight Zone right now.
If repricing to the downside really does occur, it's going to be fast and sudden.
AMD is the company that floundered, and hard, after losing the arms race to Intel for a lot of years. Then it hired a Chinese CEO, who flew over to the Chinese Communist Party's land and did some courtship, and then all of a sudden AMD was worth a lot of money, and has been for a while.
You have to really be very careful with anything connected to the CCP and China because of the geopolitical tensions between Xi Jinping and the International Rules Based Order.
All the yammering about "Taiwan" is about the IRBO looking to plant a man from Taiwan in Xi's seat when the CCP falls in the exceptionally near term future.
Yet Xi, a Chinese nationalist, can defend China's 5,000 year old Divinely-imparted culture, and himself, by weaponizing the 24-year persecution and organ harvesting genocide against Falun Gong that was launched by the Party and former Chairman Jiang Zemin on July 20, 1999.
If any of the above really transpires, please use your head: Beijing's noon is New York's midnight. Whatever happens in China is going to happen outside of NYSE/Nasdaq hours, which means those enchanted by greed are one day going to enjoy the bitter fruit of a brutal breakaway gap that never comes back.
So, AMD earnings are tomorrow post market. This is notable, because despite all the bull fever and delirium, I note that we really might be watching the markets top right now:
SPX - The Sound of a Shattering Iceberg
And if you take a look at a number of stock market calls I link below, you'll see there's a number of warning signals that are really worth considering, but still some pretty nice long opportunities.
So with AMD, what I'd like to point out as we head into earnings are two things:
1. The market makers left a goalpost at $133, based on the monthly. Price action absolutely does not have to take this point out, but since it counts as "resistance" to retail traders, it stands to reason it will go at some point
2. Price action since the late-June dump is NOT bullish. It is a classic markdown-and-sell-a-lot-more pattern that traps all the people who bought over $120 and have been comfortably numb averaging down.
On weekly charts, the red box is a place that price action is likely to return to, and the catalyst for this may very well be earnings.
There's really a precedent for this, with Taiwan Semiconductor, which I think is a very high likelihood long-term long even as markets sell off, because it's not a member of the Nasdaq or the SPX:
TSM - Taiwan, Your Semiconductor Long Hedge
An important thing to note about TSM is that it's a very similar set up to AMD, but also a lot more bullish of a pattern, and yet it lost some 7% on earnings.
Earnings plays are very hard because the fundamentals don't matter. You get major gap repricing and have to pay a high premium for leverage or for puts/calls to boot.
Yet, a dump under $100 for AMD would likely be a real buying opportunity with a target over $135.
While you might find it too good to be true, May was already a $50/65% month for AMD.
Yet nobody wants to buy when there's big red. Instead, they want to buy on green and HODL, because you've been so perfectly conditioned, Pavloved, and trained by smart money.
Alternatively, if earnings were to raid $135, it may very well be the sell of the year.
Good luck. With the situation as it is, you should always ask yourself: "Are we really going to set new highs, or are we at the top of a bear market rally?"

American Superconductor - Floating Crystals, Floating CandlesThe new rage on financial social media is that a new room temperature superconductor has been discovered, and appears to be replicable in labs.
This is significant because superconductors normally have to be either really hot or really cold during their operations.
So, AMSC has Superconductor in its name and is naturally pumping, and has been since May.
The biggest pump was August 1 at 60%, spurred on my a lot of social media chatter, especially in Korean and Chinese.
Greed in the markets is already at extremes, people are convinced new all time highs on indexes are as good as in the bank, and it's very dangerous.
Moreover, you're dealing with hidden geopolitical risks from a Chinese Communist Party being on the edge of collapse that's guilty of the 24-year-long persecution and organ harvesting genocide of Falun Dafa meditation's 100 million practitioners.
And people want to long the top on stuff that's already up 400%+.
The world truly is an asylum.
And look at the monthly bar this has produced with people longing a daily range between $14 and $17.
The weekly candle looks more sane, because at least we're on Tuesday, but it still shows that this swing may have already topped.
So, here's the thing about the fundamentals of this kind of trade:
1. The Superconductor discovery right now is a piece of lead apatite crystal that is capable of majority levitation and diamagnetism when placed on a magnetic plate.
2. The crystal has been made by students in a lab using a paper from Korea.
3. It looks like a little piece of graphite/charcoal. Unless you put it on a magnetic plate, it doesn't even float.
4. Let's say the crystal is truly revolutionary, how many years away from it making its way into a sellable product are you?
5. Why would you think American Superconductor Corporation is going to be the one who licenses something disruptive?
6. Wouldn't TSM, Intel, or AMD, or some Elon Musk/Peter Thiel/Sam Altman-type venture be the ones to steal it?
7. The stock has already quadrupled in price
8. At Tuesday's close, the market cap is $488 billion
9. Look at their earnings results: they bring in $25 million in revenue quarterly
10. Next ER is August 9 post-market. Can you maintain a $500 million market cap when they report $20 million in revenue and the CEO tells investors and banks on the conference call that they aren't going to be able to profit from the discovery?
In essence, you're kind of dealing with a real corporation that's being subjected to something of a Bed Bath and Beyond-style pump and dump.
And this is at a time when greed in the markets is already extreme. People are longing the top on things like Palantir and SOFI without second thought and gettin' paid daily.
Yet the United States credit rating was downgraded today after the Treasury said it wanted to issue another $1.8 trillion worth of debt, and now the Nasdaq and the SPX are gap down on Wednesday futures open.
I discuss this here:
SPX - The Sound of a Shattering Iceberg
I actually think there's a long trade on ASMC over $20 before the hypenstein is over.
But if you don't see it manifest at market open Wednesday and prices lower than $13.31 are traded as the indexes drive a lot of things down, you're probably going back to $10 first, which is just horrific for top longers.
Take a look at the five minute chart.
Tuesday market close was either a big buy or 45 minutes before market close was a big short.
You have to decide for yourself. But sell the news, man, is really a piece of wisdom.
After all, implied volatility is so high that an August 18 at the money call is $4.10, on a $16 stock.
That's a lot of premium and the options sellers just absolutely love your exit liquidity.

Is NVDA done correcting? LONGNVDA shot up on earnings two months ago and more or less went sideways until
mid July when it trended up for a week and then reversed downward.
On the 2H chart, I have placed both a VWAP anchored to the earnings date as
well as a volume profile. Price is currently above the 0.5 Fib level as well
as at one standard deviation above the mean VWAP and above the POC line of
the volume profile. The mean VWAP and POC are confluent at about 422.
I suspect that it is at this level that volatility will be the highest and at where
buyers will step in to open a trade shares of NVDA that have been oversold
and are undervalued. Because of that, I will place NVDA on my watchlist for
a long trade when it trends down approaching 422. The stop loss will be
418 or about 1% while targeting the recent double top of 475 and so a zone of
horizontal resistance confluent with dynamic resistance in the red line of
two standard deviations above the mean VWAP. Confirmation of an upcoming
reversal is the histogram of the zero-lag MACD going red to green. NVDA has
had a great run this year (220%) and its heavy presence in the AI megatrend
bodes well for a good continuation.

AMD Earnings Bullish 31st July2023Make sure to understand the trade & then make your decisions. AMD looks bullish to me. Ultimately AMD should go to $140
NOTE: DO NOT TRADE OPTIONS

AMD breakout expected|31st July 2023Price has come down without touching any supplies. Price has also narrowed so much and price is initially from HTF DZ.
