Buy Zone and Target for Advanced Micro Devices $AMDMy buy zone and target for $AMD
(Not financial advice)
Amdlong


AMD long Targ 100; 108A clean setup offered by AMD, after decisively breaking out of ascending triangle. The Aug consolidation sets up next leg up, with immediate measured move to 98-101, and medium term target 108.
Current position: Long
Disclaimer: These should be seen as the commentator's Notes to Self. Hopefully educational but aiming for entertaining. No legal or financial liabilities should be pursued from these materials.

AMD - Target $95 within two weeksCurrently in a ascending triangle pattern and targeting $95 within two weeks.
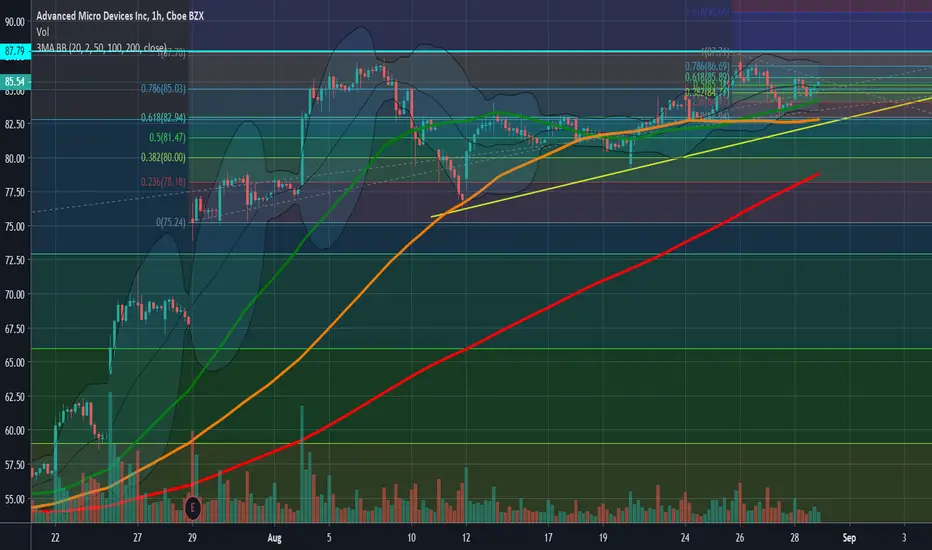
Buy the dip at ~$83 on 31st Aug which will form double bottom in lower timeframe (15 min & 1 HR) and hit $90.5 in two-three days. However, $95 is the high before any larger pullback.
AMD Existing Longs - Super Bull Run An update on our longer term holdings on AMD, we’re using higher degree wave (3) as a vehicle to reach the 101-127 price range and then will assess at that point. For now, we’re still holding on to our longs on AMD stretching the profits as long as the bullish wave (3) remains valid.

AMD is going to Outperform! Amd Trend is up up and away.
>Gaming Consoles Sony PS5 and Xbox X series will add to the top line growth.
>Innovation and capturing Intels market share
>Next 2 qtr earning should be better than expected
Some of the other factors to watch out is the next stimulus....

AMD New bull wave, target up to $105Well surely you have seen our old deal great, the old city has been reached and now it confirms the next way I will open Long AMD today.
- Pattern : Pennant
- Buy : $84
- Target : $105 +-3
- Stop loss : $78.5
Wish you a good deal!


I'm Looking For a Short On AMD Around $90I have kept my eye on lookout for a spot to short AMD.
Price has been playing this rising wedge perfectly.
We were looking to short it not too long ago if it would of broke through the support.
Instead it surged to return to the top of the wedges resistance.
We are now approaching the $90 level. I am interested in taking a short position their based off the pattern recognition. This will be an aggressive play. If were to break the top of resistance I will look to exit. First we need to see if we will get to $90. I stand firm on that price target.
Best of luck!

AMD Short BetAMD short possibility
Just above the channel
This is quite a large channel a return back to the channel is more likely than a breakout.
This is an intraday chart. For leverage traders.

AMD Short TERM Trading opportunityHi everyone, as always I am back, for another late night T.A. It gets me pretty excited to think about what is going to happen this month. So many stocks are near very pivotal resistances or supports and it truly is a great time to be alive. Speaking of pivotal points, I hope you all saw that Apple had a HUGE spike up last week, along with my long time favourite, AMD. I have always had an extremely bearish outlook on AMD, as you can tell from my past posts, but I think I am finally becoming an AMD bull, atleast for the time being ;). For now though, check out my T.A as to why I think this.
Elliottwave Analysis: The elliottwave analysis for this stock has taken me so long to figure out. I attempted to figure it out yesterday but I was seriously unable too. There is just so many possibilities, and measuring out the ratios seemed so challenging, but I have figured it out. Something that helped me choose my wave count, was that I would always compare the fibonacci ratios, and if the ratios seemed weird at the tops and bottoms of different waves, I would look at a different count. For example, if the wave 3 stopped at a 1.414 extension, I would immediately choose a different count, since that is such an awkward extension for a wave 3. So the wave count right now, is that we are in a larger cycles wave c of the wave 5. We have already finished wave 1, which is easy to see on the 15 minute and are headed up. How far up? Well< I am assuming that we are on our way to the 85-87 price target. This is because, it is a 0.764 extension of the wave a-b of wave 5, but it is also the 0.764 extension of the wave 1-3-4. Because these ratios align so perfectly, I am more incline to think that the wave c will hit somewhere here as opposed to the 0.618 or the 1:1 extension. In addition to this, on the 15 minute I have charted out what I suppose to be the wave count for the wave c of the wave 5, and using the wave 1 provided, I figured that the end of the wave, will hit the 3.618 extension of wave one, which also happens to be the 85 dollar range. Because of this large cluster of fibonacci extensions, I strongly believe that this is where we're headed. And if I am wrong, we will know right away, since I am setting the stop at the prior swing low (75.33). So that concludes the elliott wave analysis
Moving average analysis: The moving average analysis is telling me that we are also headed up. On the 15 minute, we have rested along the 55 ema for quite sometime, leading me to think we are going to be leaping off of it soon. On higher time frames, I am a bit weary, since we have no support except for the 13 ema on the 2 hour, which isn't that comforting.
RSI Analysis: The Rsi for this chart is really interesting. On the 15 minute we see some very strong bullish divergence and on the 1 hour, we see that the RSI keeps hitting incredibly high levels, but is also seeing a lot higher lows each and every time. This continues up on everytime frame until the daily. We are constantly seeing higher price action and higher rsi highs and lows. This is a really strong sign that we will continue to head upwards.
MACD analysis: On the MACD we are seeing that a move upwards is definitely on the way. On the 15 minute, we are hovering just below the zeroline reversal, but the positive ticking rsi leads me to believe it is another leap upwards for this week.
On the one hour, it is kinda bearish, since we have seen a bearish cross. Although, on the daily, we are continuing our exponential move upwards, which leads me to believe that we aren't headed down just yet.
All in all, it will be an exciting week for AMD. I am expecting that we hit the 85-87$ range which is a 10% return on your trade. In addition to this, the risk is only 2.64% or the 75.33. This is roughly a 4:1 risk to reward which is beautiful. I'll keep you posted as the trading week continues, and let you know if I am exiting the trade early or I am riding this wave even higher. Best of luck trading, and I hope you have a great long weekend.


Explosive Performance As support Never Broke. Rising Wedge(AMD)We were analyzing this one about a month ago with signs of it Squeezing under the most recent horizontal high as it ranged sideways towards long term support.
Major explosive bull movement breached the high and now is proceeding to play the top range of the massive rising wedge on a 3day chart.
I'm mainly interested in playing the breakouts of the major s&r levels on this one.
Stay tuned.

AMD Breakdown and predictions ER run upI won't short unless AMD breaks $69.05 on Monday. The market should rally on Monday imo. I would love a clean break and retest of the resistance level ($69.90 before I hop in. My long PT is $72 and my short PT is $67. Higher timeframes are still showing bullish momentum to the upside. We could see $70-72 before AMD falls. it should run up before ER


$AMD looks ready to blast$AMD is setting up for a move up from this level
Long Entry: $52.3
Stop Loss: $48
Price Target: $66

AMD BUY OR LONG , TARGET UP TO $80AMD is a very good stock, it has an out-of-date enterprise report, I gave it up to 12% of the assets to buy, I bought 50% and 50% would buy at $ 61.30 .
Pattern : Cup and Handle + Rectangle
AMD wait buy : $61.30
AMD target : $80
Stop loss : 12%
Wish you good deals!

AMD Daily Chart Gann / Ichimoku 1AMD appears to be in a several month-long consolidation pattern.
Learning Gann Fan currently.
Price target $78 -- 90 days
Not financial advice.

Tech Stocks look Bullish, Intel, AMDIntel with a bullish Fibonacci transition through the circle
AMD looking to push higher through the current fib ring aswell
I assume that other tech stocks like IBM and NVIDIA will follow.

$AMD possible breakout playFibonacci suggests a strong support above the 78.6% level.
Stock has been consolidating above since April.
For those who played the Maxim hype, some traders might return to this stock.

AMD LongTrend trading pattern, just a bit more reward then risk so worth the trade, give or take 1 month.
