AMD - All Time HighHello Traders, welcome to today's analysis of AMD.
--------
Explanation of my video analysis:
In 2016 AMD broke out of a long term triangle reversal pattern. This breakout was then followed by a pump of +5.000%. After the 2022 pullback of 70%, perfectly retesting previous structure, we are not certainly back to a bullish market on AMD. If we see a retracement back to the structure mentioned in the analysis, I am certainly looking for more long setups on AMD.
--------
I will only take a trade if all the rules of my strategy are satisfied.
Let me know in the comment section below if you have any questions.
Keep your long term vision.
Amdlong

AMD INV H&S ( SHORT TERM BULLISH )
AMD Inv. H&S, high chance of another bullish leg up to capitalize off of. The reasoning for short term bullish is due to the fact that the weekly time frame is over extended with a similar historial pattern to the previous "top" of AMD's weekly high before falling to correct.

BTCUSD ForecastOn the 4H TF, we see the classic Accumulation and Manipulation for Bitcoin. We're now in the Distribution Phase.
Nonetheless, on the lower TF, we'd be looking to take advantage of another AMD formation into the 4H FVG before we continue downwards.

AMD - Approaching All Time HighsHello Traders, welcome to today's analysis of AMD.
--------
Explanation of my video analysis:
After the massive breakout in 2016 we saw a rally of more than 4.500% on AMD. This rally was perfectly followed by a correction of 70% in 2022. As mentioned in my analysis, I am now waiting for a retracement back to the previous structure and if we have enough bullish confirmation, I will then look for potential trading opportunities.
--------
I will only take a trade if all the rules of my strategy are satisfied.
Let me know in the comment section below if you have any questions.
Keep your long term vision.

$AMD LONGNASDAQ:AMD - Breaking out from a multi-month falling wedge after holding the $100 support nicely which is a HUGE high timeframe support and psychological level. This breakout can lead us to previous ATH at around $150-$160 level in the next 2-3 months.

buy Amd at 140 for target of 280.breakout & consolidation at 130-140.
buy at 135-140 .
target 280 in 6-8 months

AMD - The Trend Is Your FriendHello Traders, welcome to today's analysis of Tesla.
I will only take a trade if all the rules of my strategy are satisfied.
Let me know in the comment section below if you have any questions.
Keep your long term vision.

AMD Reached to a good buying zone as shown on the chart NASDAQ:AMD reached to a fair price to enter right now and I think it is going to reverse up soon ,so i am buying AMD now now at 108.9 and my target in mid term is 125 and the final target at 156 .
What do you think? Please, comment on what's you opinion

Advanced Micro Devices Inc (NASDAQ:AMD) Soaring As Market GainsAMD made significant revenue and unit share gains in the server, laptop, and desktop PC markets during the last quarter. Year-over-year, AMD gained 5.8% unit share in desktop PCs, 3.8% in mobile, and 5.8% in servers. Looking at the percentage of the cash AMD gained compared to its rivals (revenue share) year-over-year, AMD gained 4.1% in desktops, 5.1% in notebooks, and 1.7% in servers.
The preceding quarters were challenging both for the consumer PC and server markets as chipmakers and their clients tried to normalize inventory levels and align supply and demand. The situation has largely normalized for the two major CPU suppliers — AMD and Intel — in the third quarter as PC makers started to purchase processors for back-to-school and holiday seasons, whereas server makers ramped up production of machines based on the latest EPYC and Xeon platforms. Overall, AMD was luckier than Intel in Q3 2023 as it gained share, according to Mercury Research.
As it turns out, AMD has gained client and server CPU market share both quarter-over-quarter and year-over-year in the third quarter of 2023, based on data from Mercury Research. The data does not include numbers for Intel and Arm, though, given the dominance of AMD and Intel in client PCs, we can guess that AMD's gains were at Intel's expense.
Technical Analysist
Price Momentum
AMD is trading near the top of its 52-week range and above its 200-day simple moving average.
What does this mean?
Investors have been pushing the share price higher, and the stock still appears to have upward momentum. This is a positive sign for the stock's future value.


AMD Shares Climb 9% On AI Optimism Despite Lowering GuidanceAMD expects to sell $2 billion in AI-powered chips next year, as it attempts to catch up to rival Nvidia.
Advanced Micro Devices (AMD) shares leaped more than 9% Wednesday after the company said it expects to sell $2 billion in AI-powered chips next year as it attempts to catch up to market leader and rival Nvidia (NVDA).
The company, which reported better-than-expected third quarter earnings yesterday, is projecting revenue of $6.1 billion (plus or minus $300 million) in the last three months of the year. That number is up from $5.8 billion for the third quarter but below the $6.4 billion analysts had expected.
However, according to some analysts, AMD's lineup of AI processors is more important than its embedded business—chips for industrial, automotive and networking sectors.
AMD is ramping up its investments in artificial intelligence (AI) in an effort to catch up to rival Nvidia, which has become one of the world's biggest semiconductor companies with a market cap exceeding $1 trillion.
AMD's MI300 processor, which the company has described as "the world's most advanced accelerator for generative AI," could help the chipmaker catch up to its bigger rival. Sales of AI-powered graphics processing units (GPUs) are expected to reach $2 billion next year, AMD Chair and CEO Lisa Su said on the company's earnings call.
Su earlier this year called AI "the defining technology shaping the next generation of computing and the largest strategic growth opportunity for AMD," and said the company is "laser-focused on accelerating the deployment of AI platforms at scale in the data center."
Shipments of MI300 processors are expected to begin by the end of 2023, Su said at a product showcase in June.
With Wednesday's gain, shares of AMD are up almost 69% so far this year. While impressive, it's a small gain compared to those of rival Nvidia, which has almost tripled year-to-date and is the S&P 500's best-performing stock this year.

SPY LIVE 19th Oct,2023This is my live analysis for SPY and I want to go long once price touched $424 levels and the logics are explained in this analysis.
NOTE:WAIT FOR THE RIGHT OPPORTUNITY

Bullish on AMD.
As you see here on the daily chart, we are bouncing off of a weekly trendline. We are also forming a bullish flag pattern on the weekly chart. So, I would look for a price break above the trend line on the daily chart with heavy volume and look to hold for a few days. This is a beautiful play.

AMD BULLISH OCT 13,2023AMD is doing something extra ordinary & I am confident that it should go to to $140 soon.
Watch the analysis carefully &trade as per your risk tolerance.

AMD UPSIDE EXPECTED 13 OCT,2023AMD has completed its price & time correction. Entry around 103 and SL 99 will give us huge targets.

AMD Bullish BreakoutAMD has given a strong breakout
The company is fundamentally strong and has been in bear trend but given the recent breakout is a strong indication of a bullish move upwards
Entry @ 107/108
SL @ 103
TP1 @ 119
TP 2 @ 130

AMD Daily timeframeafter valid breakout from wedge patern in daily timeframe with candle we can enter to long position with 4 risk to reward that its good
maybe price want to meet trend line again.. pay attention to this
good luck

AMD Falling Wedge Breakout - BullishWe traded AMD for over 100% leveraged profits a few moths ago. After hitting both our targets it made its way back to support to give us another great opportunity with a perfect RR.
Check out our older trade and it's perfection.
This trade is less convincing than the last, however the stop loss level is clear as there would be no reason to hold the asset below that support.

$AMD Quarter 3 (Q3) AnalysisAMD is playing out as planned since the initial Q2 prediction with a dip into the buy zone. I’ve been saying that AMD is an excellent buy opportunity under $100, and the bearish August and September price action has helped to send AMD down to this price level. I have $158.53 as a key price target for Q4, and I believe that AMD will form a new all-time high afterwards. Long-term I think AMD will be a $400-500 stock. The yellow trendline has been acting as a support level and AMD just formed a bullish bounce off this support. The red trendline will act as short-term resistance on the way up.

$AMD LONGNASDAQ:AMD
Possible Head and Shoulders Pattern if Price Action goes through the Cloud.
IMO -> Good Risk/Reward

AMD Swing SetupAMD falling wedge into ~$95 demand. Could we see some demand step in and a wedge break for a swing trade? I'll be looking for a long if we start seeing some support/demand in this area for a swing trade.

120 target by EOYAMD is basing and looking to retest the 120 supply zone.. bounced from the B leg of the bearish cypher (previous support is now resistances) A leg retested the supply zone, and retraced back to D leg of the bearish cypher pattern that was sold off. Now D leg is looking to act as support (previous resistances acting as support, same as it did for b leg). buy the dips and look for a retest of the 120 supply zone.

Adv. Micro Dev. (AMD) -> Breakout TimeMy name is Philip, I am a German swing-trader with 4+ years of trading experience and I only trade stocks , crypto , options and indices 🖥️
I only focus on the higher timeframes because this allows me to massively capitalize on the major market swings and cycles without getting caught up in the short term noise.
This is how you build real long term wealth!
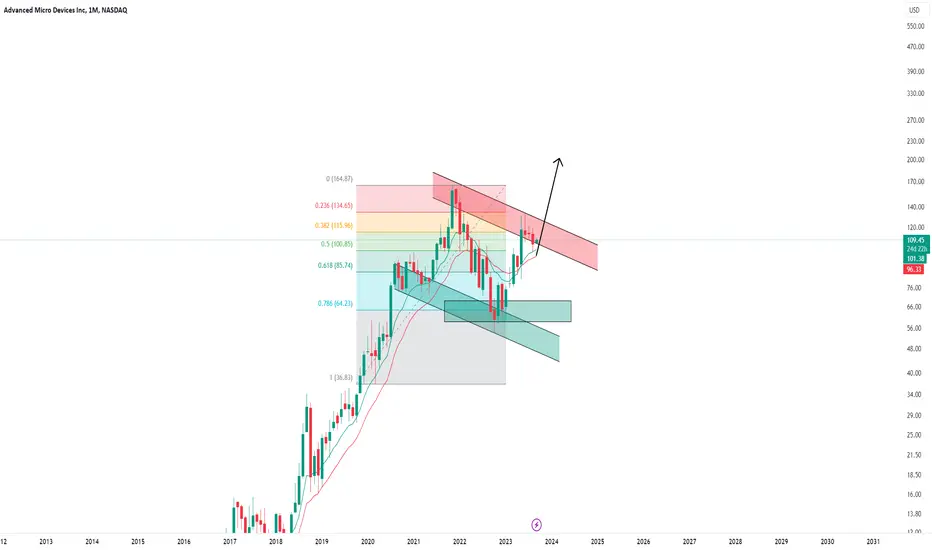
In today's anaylsis I want to take a look at the bigger picture on Advanced Micro Devices.
Just 9 months ago - after a quite harsh drop of more than 60% - Advanced Micro Devices perfectly retested the 0.786 fibonacci retracement level and reversed towards the upside.
With the overall trend still being massively bullish I am now waiting for and expecting a bullish breakout of the current flag pattern with my upside target being the previous all time high.
- - - - - - - - - - - - - - - - - - - -
I know that this is a quite simple trading approach but over the past 4 years I've realized that simplicity and consistency are much more important than any trading strategy.
Keep the long term vision🫡