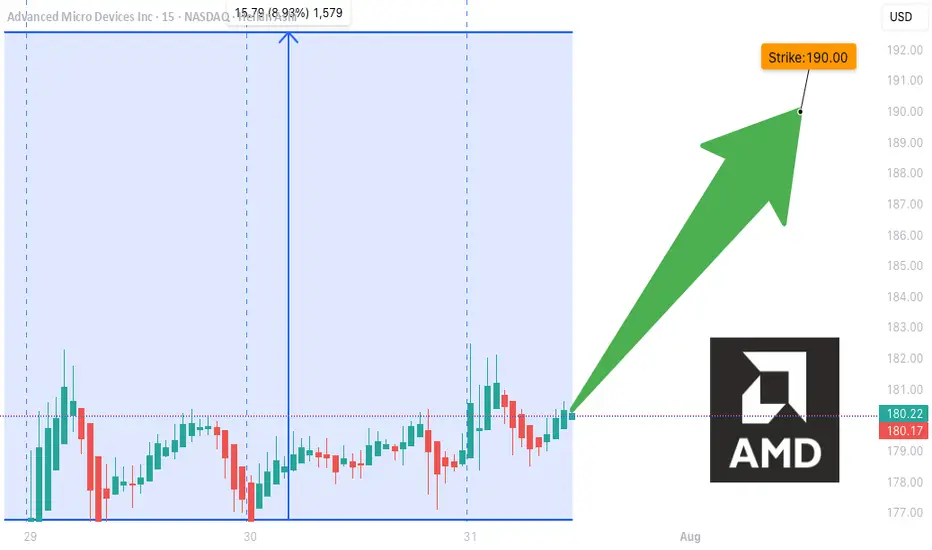
AMD WEEKLY TRADE SIGNAL (7/31/25)
### 🚀 AMD WEEKLY TRADE SIGNAL (7/31/25)
📈 **MARKET SNAPSHOT**
🟢 Daily RSI: **86.0** 🔥
🟢 Weekly RSI: **80.4**
📊 Volume: 🔺 1.5x (Institutional surge)
💬 Call/Put Ratio: **1.90**
🌪 Gamma Risk: **HIGH (1DTE)**
🧠 Sentiment: **Extremely Bullish** across all models
---
💥 **TRADE IDEA**
📍 Ticker: **\ NASDAQ:AMD **
📈 Direction: **CALL (LONG)**
🎯 Strike: **\$190.00**
💵 Entry: **\$0.51**
🎯 Target: **\$0.90** (+75%)
🛑 Stop Loss: **\$0.30**
📆 Expiry: **Aug 1 (Friday)**
📊 Confidence: **85%**
⏰ Entry: Market Open (Time-sensitive!)
---
🧠 **STRATEGY CONTEXT**
✅ Bullish momentum from AI sector hype
✅ Institutional call buying volume spiking
⚠️ 1DTE = High Gamma Risk = TRADE FAST OR DON’T TRADE
⚠️ Manage decay & exit early if momentum stalls
---
📌 Signal Posted: 2025-07-31 @ 12:17 PM ET
\#AMD #OptionsAlert #AITrade #WeeklyOptions #TradingViewViral #1DTE #GammaSqueeze
Amdsignal
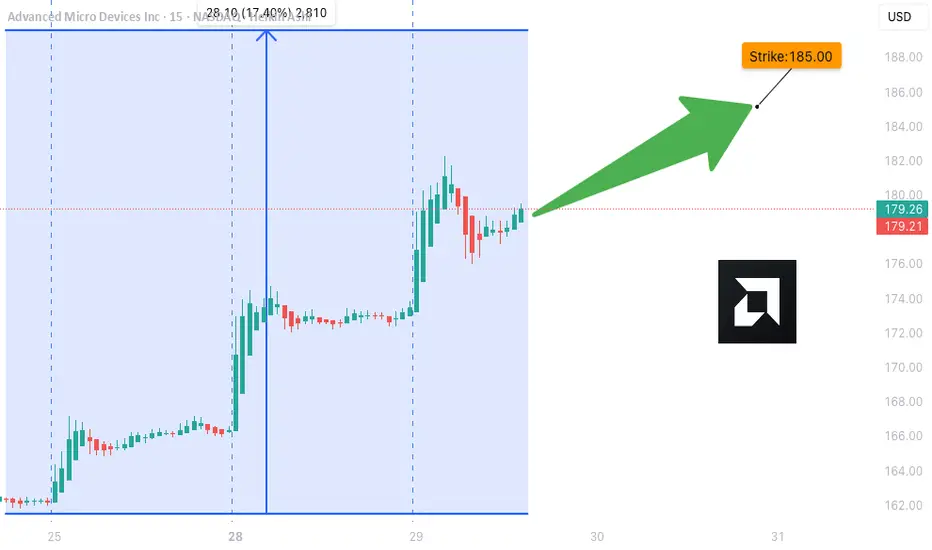
AMD Weekly Trade Alert (2025-07-29)
**🔥 AMD Weekly Trade Alert (2025-07-29) 🔥**
💹 *Momentum Confirmed. Calls Loaded. Let’s Ride.*
📈 **Key Bullish Signals**
✔️ Daily RSI: **83.2** (Rising)
✔️ Weekly RSI: **79.9** (Rising)
✔️ Call/Put Ratio: **2.03** 🧨
✔️ Volatility: Low (VIX = 15.2)
⚠️ Volume Weak (0.9x) – But not a dealbreaker.
---
**🎯 TRADE SETUP**
🔹 **Ticker**: \ NASDAQ:AMD
🔹 **Strategy**: Weekly Naked Call
🔹 **Strike**: \$185C
🔹 **Entry**: \$0.66
🔹 **Profit Target**: \$1.32 (100%)
🔹 **Stop Loss**: \$0.33
🔹 **Expiry**: 2025-08-01
🔹 **Size**: 3 Contracts
🔹 **Confidence**: 75%
---
**🧠 WHY THIS WORKS**
🔋 Momentum → STRONG
💰 Institutions are loading up calls
🧘 VIX = calm
⚡ Short gamma risk = fast payoff or cut
---
📢 **Watchlist it. Trade it. Exit fast.**
💬 Comment “🔥AMD” if you’re in.
🔁 Repost if you see \$190 coming.
\#AMD #OptionsTrading #CallOptions #TradingView #WeeklySetup #MomentumPlay #BullishSignal #MarketMomentum
The AMD Long Heist – Ready to Rob the Bulls?!🚨 AMD Stock Vault Heist: Bullish Breakout Plan with Thief Trading Style! 📈💰
🌟 Greetings, Wealth Raiders & Market Mavericks! 🌟
Hello, Ciao, Salaam, Bonjour, and Hola to all you savvy traders! Ready to crack the AMD Stock Vault (Advanced Micro Devices Inc.) with our 🔥 Thief Trading Style 🔥? This high-energy strategy blends technical precision with fundamental firepower to execute the ultimate market heist. Let’s dive into the plan, lock in profits, and escape the high-risk resistance zone like pros! 🏆💸
📝 The Heist Plan: AMD Bullish Breakout Strategy
Our chart lays out a long-entry blueprint designed to capitalize on AMD’s bullish momentum. The goal? Swipe the profits and exit before the bears take control at the resistance zone. This is a high-reward, high-risk setup, so stay sharp! ⚠️
📈 Entry: Crack the Vault!
Timing: Strike when the vault is open! Place buy limit orders on pullbacks within a 15 or 30-minute timeframe targeting the most recent swing low or high.
Tactic: Use a Dollar Cost Averaging (DCA) or layering strategy to stack multiple entries for optimal positioning.
Pro Tip: Look for bullish confirmation (e.g., candlestick patterns or volume spikes) to ensure you’re entering with momentum. 🚀
🛑 Stop Loss: Secure the Getaway!
Place your stop loss below the nearest swing low on the 3-hour timeframe (around $148.00 for day/swing trades).
Adjust based on your risk tolerance, lot size, and number of layered entries.
Why? This protects your capital from sudden reversals while giving the trade room to breathe. 🛡️
🎯 Target: Cash Out Big!
Aim for $179.00, a key resistance zone where bears may counterattack.
Watch for signs of overbought conditions or consolidation near this level—be ready to take profits and treat yourself! 💪🎉
💡 Why AMD? The Fundamental Fuel ⛽
AMD’s bullish surge is powered by:
Tech Sector Momentum: Strong demand for semiconductors and AI-driven chips.
COT Report Insights: Institutional buying pressure (check latest Friday COT data, UTC+1). 📅
Macro Tailwinds: Favorable economic conditions and positive sentiment in tech indices.
Geopolitical Stability: No major disruptions impacting tech supply chains.
Intermarket Edge: Monitor NASDAQ 100 and semiconductor ETFs for correlated moves. 📊
For a deeper dive, review:
Macroeconomic trends
Sentiment analysis
Index-specific correlations
Future price projections (overall outlook score: Bullish). 🌎
⚠️ Trading Alert: Navigate News & Volatility 📰
News releases can shake up the market like a rogue alarm system! To stay safe:
Avoid new trades during major news events (e.g., earnings or Fed announcements).
Use trailing stop-loss orders to lock in profits and protect open positions.
Stay agile—monitor real-time updates to adjust your strategy. 🚨
📌 Risk Disclaimer
This analysis is for educational purposes only and not personalized investment advice. Always conduct your own research, assess your risk tolerance, and align your trades with your financial goals. Markets move fast—stay informed and adaptable! 📚
💥 Boost the Heist! 💥
Love this Thief Trading Style? Smash the Boost Button to supercharge our robbery squad! 💪 Every like and share fuels our mission to conquer the markets with ease. Join the team, steal the profits, and let’s make money rain! 🌧️💰
Stay tuned for the next heist plan, you legendary traders! 🤑🐱👤🚀

AMD Clears Resistance, Eyes $147.8 on Bullish ReboundAMD broke above $139.8, making the primary trend bullish. A pullback to this level can provide a discount to join the bull market, with a target at $147.8.

AMD'S TLs and Channel101 Basic trend lines and channels analysis. Red lines are still holding and green channel is holding thus far.

AMD'S Technical rating indicator monthly !Still pretty high comparing with historical data all way back to IPO. Still high
even with last low ( 2 Green circles) Even though we might have a bounce big time
20%-40% up on a monthly we are still on the high side or readings comparing an
Apple for Apple all else absolute.!

AMD's Epic Surge or Plunge: Unveiling Key Levels for 2025!Good morning, trading family! Let's talk about AMD today. If the stock price goes above $130, it could go up to $142, then $157, and maybe even $169. But if it goes below $114.12, it might drop down to between $93 and $97.
If you want to learn more about sustainable trading, feel free to join my webinar this Sunday. Send me details to learn more.
Kris/Mindbloome Exchange
Trade What You See

AMD’s Earnings Stumble | A Golden Opportunity for Investors?Post Earnings Dip, Is AMD ready for a 2025 Comeback?
Shares of Advanced Micro Devices dropped over 10% after releasing its third quarter FY2024 earnings report, which fell short of investors’ expectations. Although the results were not poor, the market had high hopes given AMD's premium stock valuation. The company did surpass revenue projections, but its non GAAP EPS matched market expectations plus the midpoint of its fourth-quarter revenue forecast slightly missed estimates.
In my prior analysis, I upgraded AMD from a sell to a buy after a 20% dip, which realigned market expectations. Since that upgrade, the stock has climbed 15%, outperforming the S&P 500 Index by 9%. The recent earnings-driven decline has brought AMD's stock price close to my previously mentioned level.
While the gaming segment saw a sharper decline in revenue in 3Q, the Data Center GPU division continued to exhibit strong growth, boosting overall revenue growth and improving margins. I believe AMD is still in a strong position to further accelerate revenue growth and margin expansion in the fourth quarter and beyond. As a result, I see the post-earnings dip as a buying opportunity and maintain my buy rating on the stock, supported by its anticipated growth phase justifying its premium valuation.
For 4Q FY2024, AMD projects 21.6% YoY revenue growth at the midpoint of its guidance, with a $300 million potential variance. This growth is expected to be driven by continued expansion in Data Center GPUs. Although the midpoint guidance is slightly below market consensus, I believe AMD could exceed this number, given its track record. My estimate suggests a 24% YoY revenue increase, or $150 million above the midpoint.
3Q EPS Analysis Shows Margin Pressure
AMD has shown consistent margin improvement since 4Q FY2023, though the pace in 3Q didn't meet expectations. EPS aligned with estimates despite revenue exceeding forecasts, indicating margin challenges. Non-GAAP gross margin rose by 50 bps sequentially, while non-GAAP EBIT margin showed strong improvement, rising by 350 bps QoQ.
AMD forecasts a 4Q non-GAAP gross margin of 54% and operating expenses of $2.05 billion, driven by a favorable mix from its Data Center segment, which now represents 52% of total revenue. Management noted that gross margins in the Data Center segment are below the company average, focusing on customer needs and market growth for future gains. This contrasts with NVIDIA (NVDA), which reportedly has higher Data Center margins, though specific figures are not disclosed.
With a 4Q revenue consensus at $7.65 billion, AMD projects a non-GAAP EBIT margin of 27.2%, suggesting an additional 200 bps sequential increase. The company appears well-positioned for both revenue growth and margin improvement, despite its valuation declining after the recent stock pullback.
4Q EPS Outlook Signals Continued Growth
Although 3Q non-GAAP EPS met expectations, AMD’s growth accelerated from 18.1% YoY in 2Q to 32% in 3Q. However, the selloff post-earnings implies that investors anticipated even higher growth. Based on 4Q guidance, I estimate AMD’s non-GAAP EPS at $1.10, marking a 44% YoY increase.
AMD's FCF profile also improved, generating $496 million in 3Q, a 13% QoQ increase despite a one-time acquisition-related expense of $123 million. Higher capital expenditures are expected in FY2025 to support MI300 growth and maintain momentum.
Market Expectations and Valuation Impacts
Before the 10% post 3Q selloff, AMD’s EV/EBITDA TTM was higher than NVIDIA’s, but they are now on par, despite AMD’s margins and growth trailing NVIDIA's. AMD’s non-GAAP EV/EBITDA forward multiple is 46.3x, compared to NVIDIA’s 42.6x, and its forward P/E ratio is 50.4x, 17% above its 5-year average and higher than NVIDIA’s 49.7x.
While AMD's premium valuation can be justified given its growth acceleration, NVIDIA’s triple-digit EPS growth is not expected to continue. Moreover, NVIDIA’s gross margin recently declined, reinforcing the case for AMD’s valuation as it expands its growth in FY2025.
AMD’s stock has retraced to a 0% YTD return due to margin concerns and underperformance in Gaming and Embedded segments, though the latter is gradually recovering. However, the company’s strong Data Center gains and continued margin expansion indicate a solid growth phase. The recent selloff has recalibrated market expectations, and with ongoing AI-driven demand, AMD’s growth is likely to extend into FY2025, making the pullback an attractive buying opportunity.
What you think, Are you Moonish on AMD?

Earning report Today! Can $AMD breakout the downtrend line?
Technically, AMD is closing to the downtrend line again. There was a FAKEOUT three weeks before.So will NASDAQ:AMD truly breakout the downtrend line this time?
It will depends on the earnings report today!
Here are 3 Things I'm Watching in NASDAQ:AMD 's Earnings on Tuesday
1. MI300 Series: Flagship AI GPU
• Their new Instinct MI300 series GPUs are built to compete directly with NASDAQ:NVDA H100 chips, supporting both training and inference for large-scale AI models. The MI300 offers high memory capacity and multi-chip module (MCM) architecture, making it suitable for AI workloads that require massive data processing. Early deployments include partnerships with key cloud providers like NASDAQ:MSFT Azure -- which is leveraging AMD’s GPUs for its AI infrastructure.
2. AI-Powered Accelerated Processing Units (APUs)
• Their APUs, which combine CPU and GPU capabilities on a single chip, are designed to handle AI tasks efficiently in edge computing and consumer applications. For instance, AMD’s latest Ryzen AI-powered APUs provide AI acceleration directly in laptops -- aiming to improve tasks like image processing and natural language interactions.
3. Capturing AI Market Share
• Their approach is centered around capturing a larger share of the rapidly growing AI semiconductor market, which is projected to surpass $400B by 2030. As AI models become more sophisticated, they require increased computational resources. AMD’s focus on energy efficiency and competitive pricing allows it to offer alternatives to Nvidia, making it more appealing to enterprises managing rising energy costs and budget constraints. Unlike Nvidia, which has historically focused on high-end GPUs, AMD’s diverse product mix, including CPUs, APUs, and data center GPUs, enables it to serve a broader range of AI use cases. This could lead to more consistent revenue growth as AI applications proliferate beyond just data centers -- spreading into edge devices and personal computing.

AMD (Advanced Micro Devices, Inc.) BUY TF D1 TP = 184.94On the D1 chart the trend started on Aug.8 (linear regression channel).
There is a high probability of profit taking. Possible take profit level is 184.94
This level, which I have outlined above, is certainly not a “finish” level. But it is the level that has the “highest percentage of hits on target.”
Using a trailing stop is also a good idea!
Please leave your feedback, your opinion. I am very interested in it. Thank you!
Good luck!
Regards, WeBelievelnTrading

$AMD will just start a rally!!!
AMD is moving in a bullish channel, and just has retested the previous downtrend line.
The green candle of yesterday signals that the price is supported, and will start to go bullish!
as far as i'm concerned, I will place my buy order at this area.

$AMD will just start a rally!!!
AMD is moving in a bullish channel, and just has retested the previous downtrend line.
The green candle of yesterday signals that the price is supported, and will start to go bullish!
as far as i'm concerned, I will place my buy order at this area.

AMD (Advanced Micro Devices) SELL TF H1 TP = 134.58On the H1 chart the trend started on Aug. 21 (linear regression channel).
There is a high probability of profit taking. Possible take profit level is 134.58
Using a trailing stop is also a good idea!
Please leave your feedback, your opinion. I am very interested in it. Thank you!
Good luck!
Regards, WeBelievelnTrading

AMD Short Trade Opportunity - Very Overbought in a Greedy MarketNASDAQ:AMD is currently above a resistance level, and I think the price is very overbought here. There is still some bullishness short-term, but shorts have been getting wrecked and I wouldn't FOMO here. Maybe there could be a short trade setup once AMD stops trending up. I like the current price levels for shorting.
I believe semiconductor chip stocks have been extremely bullish, and I haven't wanted to be against them. However, they seem very overvalued at current prices, and I think the market could get a pullback soon. I think the AMD stock price and RSI will need a correction within the next few weeks. The correction could put AMD around $140 price levels.

AMD INV H&S ( SHORT TERM BULLISH )
AMD Inv. H&S, high chance of another bullish leg up to capitalize off of. The reasoning for short term bullish is due to the fact that the weekly time frame is over extended with a similar historial pattern to the previous "top" of AMD's weekly high before falling to correct.

ANALYSIS ON AMDDear Traders and Investors,
I'm sharing with you this analysis on AMD to tell you to close your position if you're holding a long trade, as you can see in the chart, the price pulled back on the 0.5 level of the fib and gave us a confirmation, now it's heading towards the 0.6.
For further question, don't hesitate to ask!

$AMD Due for a Correction This WeekAMD has been showing a lot of bullishness since September 26. However, AMD has reached the upper range of the white channel and is due for a correction this week. I have the yellow trend line as a key support level and my first price target. I think there will be a solid bounce off this yellow support line in the short term.

$AMD Quarter 3 (Q3) AnalysisAMD is playing out as planned since the initial Q2 prediction with a dip into the buy zone. I’ve been saying that AMD is an excellent buy opportunity under $100, and the bearish August and September price action has helped to send AMD down to this price level. I have $158.53 as a key price target for Q4, and I believe that AMD will form a new all-time high afterwards. Long-term I think AMD will be a $400-500 stock. The yellow trendline has been acting as a support level and AMD just formed a bullish bounce off this support. The red trendline will act as short-term resistance on the way up.

AMD BUYHi, According to my analysis of AMD stock, there is a good opportunity to buy. Or a long-term investment. All reasons for purchasing are explained as shown in the analysis. Good luck everyone

AMD stocks experienced range fluctuations in 1.382 and 1.618AMD stocks experienced range fluctuations in 1.382 and 1.618 positions
This chart shows the weekly candle chart of AMD stocks over the past two years. The top to bottom golden section at the end of 2021 is superimposed in the figure. As shown in the figure, AMD stocks experienced range fluctuations in May and mid June of this year after retreating to 1.382 and 1.618 positions, following the 1.000 position of the golden section in the upper test chart! The weekly chart for the past two weeks has shown a long upward shadow and a steady downward shift in center of gravity! In the future, the probability of AMD stocks weakening is expected to return to the bullish starting point in May 2023 as shown in the chart!

20 Reasons for long AMD
🔆MULTI-TIME FRAME TOP-DOWN ANALYSIS OVERVIEW☀️
1:✨Eagle eye: In 2016, the stock started its bullish run and created its first multi-year Bullish Order Structure (BOS) and also set an All-Time High (ATH). After a correction move last year, an important point to note is that the Point of Interest (POI) area held, indicating that bulls still have power and the stock is showing strength. It is now poised for the next impulsive move towards a new ATH.
2:📆Monthly: In October 2022, the correction move confirmed a Lower High (LH), signaling the end of the correction. Now, the price may either consolidate sideways or take a reversal impulse move. We need to consider both possibilities. If the price consolidates, the range between 98 and 110 is important, and we should only look for buying opportunities within this range.
3:📅Weekly: A very strong bullish structure has already formed, and the price has made a BOS and almost completed its corrective move. The corrective area ranges from 100 to 104. Here, we need to wait for a strong reversal signal to confirm the buying opportunity. No further signals are needed, only one confirmed reversal signal.
4:🕛Daily: A well-established bullish trend is evident, with a strong inducement and a corrective move that has filled the gap and window. The price is now approaching the most recent support area after the inducement. The most important thing to watch carefully is the confirmation of today's pro-gap. If the price closes above 112 for the next two or three days, or even today, it will provide a buying confirmation.
😇7 Dimension analysis
🟢 analysis time frame: Daily
5: 1 Price Structure: Extremely bullish
6: 2 Pattern Candle Chart: Pro-gap
7: 3 Volume: High selling volumes indicate the end of the correction, and now a confirmation of the long position is needed.
8: 4 Momentum UNCONVENTIONAL RSI: Holding above the 40 area, indicating a middle strength bullish zone.
9: 5 Volatility measure Bollinger bands: Volatility is starting to squeeze, which may lead to a temporary calm or sideways movement before a bullish move. The breakout of the squeeze will provide final confirmation.
10: 6 Strength ADX: Completely sideways.
11: 7 Sentiment ROC:
✔️ Entry Time Frame: Daily
12: Entry TF Structure: Bullish
13: Entry Move: Initial impulsive move
14: Support Resistance Base: The most recent Order Structure (OS) after the inducement acts as strong support.
15: FIB: Not activated yet. Additionally, a breakout of the hourly trend line will provide an additional confirmation.
☑️ Final comments: Buy at confirmation.
16: 💡Decision: Go long.
17: 🚀Entry: 112
18: ✋Stop Loss: 104
19: 🎯Take Profit: 148
20: 😊Risk to Reward Ratio: 1:6.5
🕛 Expected Duration: 30 days

There is still room above of AMD stock !There is still room above of AMD stock !
This chart shows the Line chart of AMD shares in the last two years. The top to bottom golden section is superimposed in the figure. As shown in the figure, the recent high point of AMD stock happens to be 1.000 level of the top to bottom golden section in the figure, and the recent wave of long start bits also happens to be 2.382 level of the top to bottom golden section in the figure! So, in the future, the probability of AMD stocks will continue to break through upwards, test the 0.618 level of the golden section, and then fall back, fluctuating and weakening!

AMD -> The Breakout Happened As PredictedHello Traders,
welcome to this free and educational multi-timeframe technical analysis .
In my last video analysis of AMD, linked below, I explained all the reasons for which I do expect the market to provide further continuation towards the upside and actually breaking above the neckline of the very obvious weekly double bottom.
With todays price action, this is exactly what happened, we are seeing a massive breakout to the upside, which could definitely lead to a significant short covering rally.
I am now just waiting for a small retracement on AMD and bullish confirmation to enter a long to also participate in this very bullish momentum.
Thank you for watching and I will see you tomorrow!
You can also check out my previous analysis of this asset:
