NASDAQ price dropAfter the Nasdaq price reaches around 23642.2, a historic drop will occur and the target is to drop to 16308.
Whatever happens at the highest price, the final destination is towards 16308.
I have identified the price levels in the middle of this expected drop that can cause the price to correct.
IG:NASDAQ
America

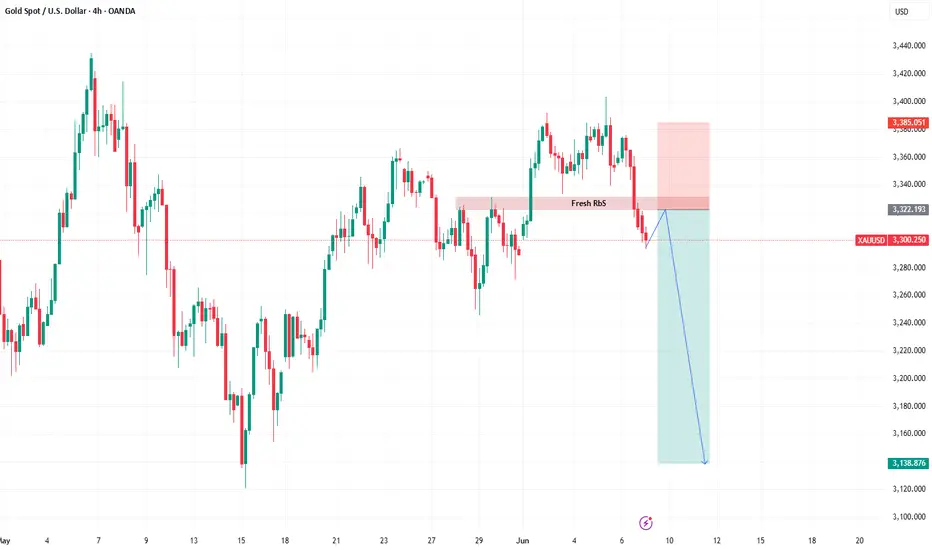
XAUUSD after NFPBased on chart
Price already break the RbS area
So for now the plan is to wait the price to retest the RbS area then drop
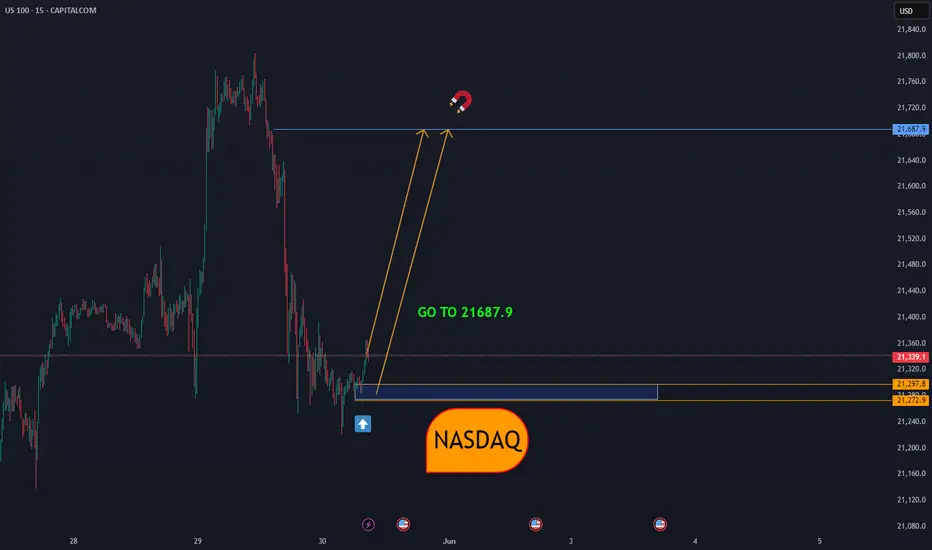
NASDAQGiven the geometry that has been created, there is a possibility of a correction towards the price of 21687.9, either from the current price or from a little lower, if the bottom of 21219 is broken, another decision must be made.
NASDAQ:NDX
The Illusion of Value: How the U.S. Market Became a Fantasy EconThe Illusion of Value: How the U.S. Market Became a Fantasy Economy
For decades, the American economy has been celebrated as the epicenter of innovation, wealth creation, and corporate success. But beneath the surface, an unsettling reality has emerged: The U.S. financial markets are increasingly driven by speculation, hype, and a distorted sense of value.
"Buy Now, Pay Later"—A Culture of Delusion
One of the most glaring symptoms of this detachment from reality is the widespread adoption of "Buy Now, Pay Later" (BNPL) services. A staggering number of American consumers have embraced debt-financed spending as a normal part of life. Credit cards are no longer the primary vehicle for financial mismanagement—BNPL systems have convinced people they can afford luxuries they fundamentally cannot.
This mentality, in turn, feeds into the stock market’s obsession with future promises over actual output. Investors have become infatuated with narratives rather than numbers, driving valuations to unrealistic highs for companies that either underdeliver or simply do nothing at all.
The MicroStrategy Paradox: Borrowing Money to Buy Bitcoin
Take MicroStrategy, for example—a company whose sole business model seems to be leveraging borrowed capital to buy Bitcoin. By traditional metrics, MicroStrategy offers no tangible product, no innovative service, no groundbreaking technology—just speculative accumulation. Yet, thanks to Bitcoin hype, its stock price is valued as if it’s a revolutionary player in the corporate world.
This irrational valuation mirrors the broader issue with American markets: Companies are being rewarded not for what they actually do, but for the financial games they play.
The Myth of Overvalued Titans: Tesla & Meta
Tesla and Meta serve as the poster children of speculative overvaluation.
- Tesla: Once hailed as an automotive disruptor, Tesla’s stock price often reflects what Elon Musk promises rather than what Tesla delivers. From self-driving software that never fully materialized to mass production goals that fell flat, Tesla’s ability to sustain its valuation relies more on Musk’s cult-like following than automotive success. Meanwhile, the gutting of regulatory oversight has allowed Tesla to push unfinished, potentially hazardous products into the market.
- Meta: Meta’s valuation has ballooned largely on the promise of virtual reality dominance. Yet, billions poured into the Metaverse have yielded little beyond overpriced VR headsets and gimmicky social spaces.
Elon Musk: The Master of Market Manipulation
Elon Musk’s influence on financial markets cannot be overstated. Through cryptic tweets, grand promises, and regulatory maneuvering, Musk has become a force powerful enough to shift markets with mere words. Whether it’s pumping Dogecoin, slashing Tesla’s safety oversight, or influencing government policy for personal gain, Musk operates in a reality where market value is dictated by his persona rather than corporate fundamentals.
The Rise of True Value Markets
While the U.S. economy indulges in financial fantasy, other global markets have started to present compelling opportunities:
- Europe: A more realistic, fundamentals-based approach to valuation is emerging. Traditional industries remain resilient, and companies must show actual profitability to attract investment.
- China: Despite regulatory challenges, China’s focus on industrial production, technological advancement, and infrastructure development gives its economy a sense of tangible progress.
- UK & Australia: Unlike the speculative U.S. markets, these economies remain grounded in earnings, productivity, and rational valuations.
Conclusion
The American financial landscape has become a speculative playground detached from reality. Companies are valued not for what they produce, but for what they promise, what they borrow, and what narratives they spin. Figures like Musk exploit market sentiment, while deregulation enables corporations to operate recklessly. As Europe, China, the UK, and Australia foster economies built on real value, the U.S. is at risk of crashing under the weight of its illusions.
SP:SPX TVC:DXY INDEX:BTCUSD TVC:GOLD NASDAQ:MSTR NASDAQ:TSLA NYSE:BLK NASDAQ:META XETR:DAX FTSE:UKX TVC:HSI SET:SQ NASDAQ:PYPL NASDAQ:AFRM NASDAQ:AAPL NASDAQ:AMZN NASDAQ:NVDA NASDAQ:COIN NASDAQ:HOOD

What’s America's Real Goal in a Possible India–Pakistan War?We are nearing the end of the petro-dollar era. The power balance of the new world order will be defined not by oil, but by the strategic resources essential for AI, electric vehicles, and cutting-edge technology.
Throughout the 20th century, the U.S. maintained its global dominance by controlling access to oil. From the Middle East to Latin America and Africa, wherever oil was found, the U.S. was there.
But today, the focus has shifted to rare earth elements, lithium, copper, and other strategic minerals.
Trump’s 2025 move to buy Greenland wasn’t a diplomatic joke—it was a signal. Behind-the-scenes deals in Ukraine for rare earth deposits tell the same story: whoever controls these "white gold" assets will lead the tech-driven world.
Now enters Pakistan, with mineral-rich lands spanning over 600,000 km², nearly three times the size of the UK. Experts estimate its underground reserves to be worth $8 trillion.
In Balochistan's Rekodik field alone, there are 12 million tons of copper and 20 million ounces of gold, with a copper purity of 0.53%, well above global standards. In the north, newly discovered lithium reserves could be a game-changer for the EV revolution.
This is no longer just about resources—this is about deciding the future balance of global power.


Fool trump BTC@Watch and follow the processBitcoin in the 15-minute time frame seems to have a tendency to rise in the short term
And we are in a range of fluctuation

TRUMP EFFECT BTC is being prepared for correctionBITCOIN IS READY FOR CORRECTION OR CONTINUES ITS DOWNWARD TREND
fool trump
trump decide to destroy world economy

Driven Brands Holdings: Dominating North America's Auto ServicesKey arguments in support of the idea.
A potential rise in U.S. car prices may positively impact the company’s sales.
DRVN is expanding its footprint in the essential automotive services market, simultaneously reducing its car wash segment with more cyclical sales.
Investment Thesis
Driven Brands Holdings Inc. (DRVN) is the largest automotive services company in North America, operating an increasing network of approximately 5,200 franchise, independently owned businesses operated by the company across 49 U.S. states and 13 other countries. The company has a footprint in all major automotive service areas, catering to both retail and commercial customers. Its main business segments include car maintenance and repair, express car wash, bodywork and paint services.
U.S. car import tariffs, introduced in March, support the trend of an increasing average age of cars on U.S. roads and may lead to higher car prices. These factors may contribute positively to DRVN’s revenue growth. On April 3, a 25% tariff on cars imported to the U.S. will take effect, and by May 3, equivalent tariffs on automotive components will be implemented. These tariffs may disrupt automakers’ production processes due to a reconfiguration of production chains. Only half of the 16 million new cars sold annually in the U.S. are produced domestically, while other autos could be subject to these tariffs. Production disruptions may result in price increases for both new and used cars. Many consumers may delay purchasing new cars, opting instead to spend more on maintaining their current vehicles. The new factors support the general long-term trend to an increasing average age of cars on U.S. roads. In 2000, the average vehicle age in the U.S. was 8.9 years; it has now grown to 12.6 years and continues to rise annually. Despite this, the total number of vehicles on U.S. roads is also steadily increasing at an average annual rate of about 1% over the past two decades. Combined with the new tariffs, the overall growth of the automotive aftermarket is likely to boost DRVN’s revenue in the upcoming years.
Driven Brands continues successfully shifting its focus to essential automotive services. After 2023, the company began reducing its ownership of standalone car washes while expanding its Take 5 Oil Change locations. Take 5 Oil Change provides rapid oil change services within 10 minutes, allowing drivers to remain in their cars. In March, reports have indicated that Driven Brands plans to sell its Take 5 Car Wash chain. We suppose this deal will accelerate the expansion of the Take 5 Oil Change segment and enable the company to allocate some proceeds toward debt reduction, potentially decreasing debt service expenses by up to 20%.
The valuation of DRVN stock, compared to its peers, shows potential for growth. DRVN’s valuation corresponds to 14 projected earnings for 2025, aligning with the average valuation among U.S. car dealers. Nonetheless, DRVN’s potential for revenue growth in the coming years is anticipated to surpass that of its peers. In the last three quarters alone, the Take 5 segment has demonstrated a sequential revenue increase of 10%, accounting for about 60% of the company’s total sales.
We suppose that Driven Brands Holdings Inc. (DRVN) shares may exhibit positive momentum in the near term.
The target price for DRVN shares over a two-month horizon is $19.90, with a “Buy” rating. We suggest setting a stop-loss at $15.50.


Geopolitical Analysis and Impacts on Currency Markets
Hello, my name is Andrea Russo and today I want to talk to you about how recent geopolitical news is impacting the Forex market, analyzing the main currency pairs and providing a detailed technical picture.
Current Geopolitical Context
This week, the geopolitical landscape has been characterized by a series of significant events. Among them, tensions between the United States and Russia have dominated the scene, with a phone call between Donald Trump and Vladimir Putin that has opened up the possibility of a negotiation in Ukraine. However, the situation on the ground remains critical, with Russian forces advancing in several Ukrainian regions2. Furthermore, uncertainty over gas supplies in Europe has led to significant volatility in energy markets, with the price of gas falling by 3%.
Impacts on the Forex Market
Geopolitical tensions have had a direct impact on the Forex market, influencing volatility and capital flows. For example:
EUR/USD: The pair has been showing a bearish trend, influenced by economic uncertainty in Europe and the strength of the dollar as a safe haven.
USD/JPY: The dollar has gained ground against the yen, thanks to the perception of economic stability in the United States.
GBP/USD: The British pound has been under pressure due to concerns about economic growth in the United Kingdom.
Technical Analysis
A technical analysis of the major currency pairs reveals the following trends:
EUR/USD: Technical indicators suggest a "sell" position, with key support at 1.0832 and resistance at 1.0862.
USD/JPY: The pair is showing "buy" signals, with an uptrend supported by resistance at 148.09.
GBP/USD: Indicators are mixed, with resistance at 1.2944 and support at 1.2920.
Conclusion
Geopolitical dynamics continue to play a crucial role in determining the movements of the Forex market. Investors should carefully monitor global developments and use technical tools to make informed decisions. The current volatility offers opportunities, but also requires careful risk management.
I hope this analysis has been useful to you in better understanding the connections between geopolitics and Forex. Stay tuned for more updates!

$USIRYY - U.S Inflation Rate Slows More Than ExpectedECONOMICS:USIRYY 2.8% YoY
(February/2025)
source: U.S. Bureau of Labor Statistics
- The annual inflation rate in the US eased to 2.8% in February below 3% in January and market expectations of 2.9%.
On a monthly basis, the CPI rose by 0.2%, slowing from 0.5% rise in January and below market expectations of 0.3%.
Core CPI also rose 0.2% on the month and was at 3.1% on a 12-month basis, both below consensus.

$LMNRCould benefit greatly from being an American based produce company. Either from tariffs (prices being more competitive to foreign imports) or from inflation

Ford seems to easy of a buyThoughts on the Ford recall vs price action
I'm personally watching as buying is heating up

EURUSD - PoVThe EUR/USD exchange rate is influenced by several economic and political factors, suggesting that the euro may continue to weaken in the coming weeks. On one side, the United States is implementing expansive fiscal policies that could strengthen the dollar, such as economic stimulus and increased public spending. These factors, along with potential protectionist measures like tariffs on Europe, could further weaken the euro by reducing the competitiveness of European exports. Additionally, the **Federal Reserve's** monetary policy, which has raised interest rates to combat inflation, makes the dollar more attractive to investors, increasing demand for the U.S. currency. The United States' energy independence, due to increased domestic production of gas and oil, has also reduced its reliance on imports, which further strengthens the dollar compared to the euro.
On the other hand, the Eurozone is facing a series of economic and political challenges that are putting pressure on the single currency. High inflation is eroding purchasing power across the Eurozone, and despite the European Central Bank (ECB) raising interest rates to combat it, economic growth remains slow. This divergence from the United States, where growth has been more dynamic, amplifies the euro's weakness. Moreover, the ongoing energy crisis in Europe, worsened by the war in Ukraine and reduced gas supplies from Russia, has increased costs and slowed the competitiveness of European businesses. In this context, political uncertainties in some Eurozone countries and the ECB’s less aggressive economic management compared to the Fed further contribute to the euro's weakness.
Therefore, the strengthening of the dollar, driven by U.S. policies and growing energy independence, and the structural weakness of the Eurozone, are likely to continue pushing the EUR/USD lower in the coming weeks.

Nasdaq on the fence for UP- But with a plan for up or downsideI honestly can't give a definitive analysis on this one.
On the one hand we have a previous uptrend, and now consolidation following a Box formation confirming the sideways range.
So if we break up we will head to a target of 23,440
On the other hand (with the US going awry with their radical bills being passed) if the M Formation plays out, there is a likelyhood of the price crash down to 18,850.
The technicals are pointing on the UP so I am 70% Bullish and 30% bearish.
I would imagine the first analysis seems more promising to 23,440.

$USINTR -U.S Interest Rates ECONOMICS:USINTR
(January 2025)
source: Federal Reserve
-The Fed kept the funds rate steady at the 4.25%-4.5% range as expected, pausing its rate-cutting cycle after three consecutive reductions in 2024.
The Fed showed more optimism about the labor market and noted that inflation remains somewhat elevated, removing the reference to ongoing progress toward the 2% target.
The Fed also said the economic outlook is uncertain, and is attentive to the risks to both sides of its dual mandate.

Is the American Coin Memecoin $USA Prime for a 1000% Surge?The Solana-based memecoin NYSE:USA , a parody token with no direct affiliation to the United States, has captured the attention of the crypto world. With a current market cap of $88 million, this coin surged to prominence, recording a staggering 1300% increase during the week the official Trump and Melania coins were launched. However, this meteoric rise was followed by an 81% retracement, leaving investors wondering about its future potential.
Recent Market Trends and Technical Indicators
Since former President Donald Trump’s inauguration last night, NYSE:USA has seen a sharp decline, dropping 55% in the past 24 hours. Despite this downturn, there are signs of a potential trend reversal. The daily candlestick pattern indicates the formation of a new candle, suggesting a possible surge of 252% in the short term and a 1000% increase in the long term, provided the broader crypto market stabilizes.
Key Technical Levels to Watch
- Support Level: $0.00000194, aligning with the one-month low. A breakdown below this level could trigger catastrophic losses for $USA.
- Resistance Level: $0.000019755, coinciding with the 38.2% Fibonacci retracement level. A breakout above this point could set the stage for a long-term 1000% rally.
- RSI: At 66, the Relative Strength Index suggests that NYSE:USA is holding strong against bearish pressures, leaving room for further upward momentum.
Fundamental Insights
NYSE:USA ’s unique positioning as a parody token and its community-driven nature have been instrumental in its popularity. Its association with significant events, such as the Trump and Melania coin launches, underscores its speculative appeal. However, the token’s lack of intrinsic value and high volatility remain critical risks.
Market Activity and Liquidity
NYSE:USA tokens are available on decentralized exchanges, with Orca being the most popular platform. The trading pair DEFAI/USA on Orca recorded a 24-hour trading volume of $93,766.70. Other options include Meteora and Raydium (CLMM).
Trading Volume
The 24-hour trading volume of NYSE:USA is $18,866,936, marking a 93.90% decrease from the previous day. This significant drop highlights a decline in market activity.
Historical Price Performance
- All-Time High: $0.00002545, recorded on January 19, 2025. The current price is 70.12% lower.
- All-Time Low: $0.0000002267, recorded on August 21, 2024. The current price is 3,254.68% higher.
Outlook for NYSE:USA
The future of NYSE:USA hinges on its ability to capitalize on market momentum and maintain investor interest. While the current technical indicators and market dynamics suggest a potential for significant gains, the token’s high volatility and reliance on speculative trends present substantial risks.
Conclusion
NYSE:USA represents a unique blend of humor, speculation, and community engagement in the crypto space. Its recent performance and technical indicators suggest potential for a strong rebound, but investors should exercise caution, keeping an eye on key support and resistance levels. As always, conducting thorough research and considering market conditions are essential before making investment decisions.

$USIRYYY -U.S Inflation Rate (December/2024)ECONOMICS:USIRYY
December/2024
source: U.S. Bureau of Labor Statistics
-The annual inflation rate in the US accelerated for the third consecutive month to 2.9% in December, as expected.
On a monthly basis, the CPI rose by 0.4%, exceeding expectations of 0.3%.
However, annual core inflation slightly decreased to 3.2% from 3.3%, below the anticipated 3.3%. The monthly core rate also eased to 0.2% from 0.3%, in line with expectations.

XAUUSD | Market outlookGold prices were set for their largest weekly drop over three years on Friday. Expectations of less aggressive interest rate cuts by the U.S. Federal Reserve, which strengthened the dollar, drove the drop.

BTCUSD | Trade idea
BTCUSD Performance: BTCUSD pulled back after reaching a minor top around $65,000, hitting a high of $65,103 and currently trading around $62,500.
Rate Cut Probability: The probability of a 25 basis point rate cut in September increased to 71.50% from 71% a week ago (CME Fed watch tool).
BTC ETF Inflows: BTC ETF saw an inflow of $202.51 million, with BlackRock attracting $224 million.
US Markets: NASDAQ, which has a negative correlation with BTC, is bearish but neutral for BTC. NASDAQ is trading weak ahead of Nvidia earnings; a close above 20,000 could push it to 20,500.

EURUSD UPWARD MOVE After the US elections, price is finally consolidating and the EURO is on it's way back up after it retests key levels.

USDCNY | Market outlook
The USD/CNY strengthened on Tuesday as a stronger U.S. dollar and concerns over a weak Chinese economy put pressure on the Yuan.
Recent data from China revealed that manufacturing activity fell to a six-month low in August, while growth in new home prices also slowed during the same period.
Additionally, the property sector has yet to respond positively to Beijing's series of stimulus measures, continuing to drag down the overall economy.
