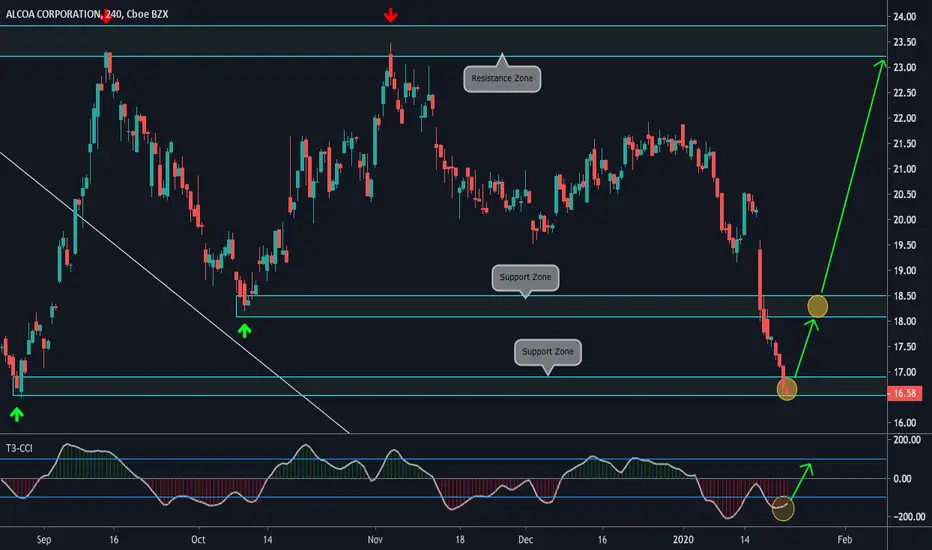
"Alcoa: bouncing from here?" by ThinkingAntsOk4H Chart Explanation:
- Price broke the Descending Trendline on a Weekly Basis.
- Price is near an important Support Zone.
- Bullish CCI.
- If price bounces from here, potential to move up towards the Resistance Zones.
Weekly Vision:
Daily Vision:
Updates coming soon!
America
Nomber Go Up. Dry January Epic FailDog Fish Head + Truly + happy midd/e/upper class of Americans = BOOM TIME $420 magic number

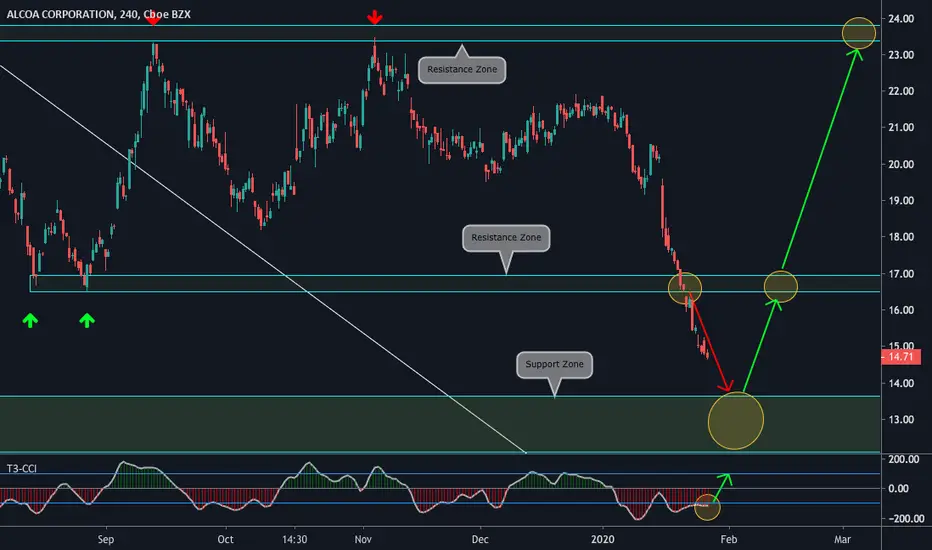
"Alcoa: Top and Bottom Analysis" by ThinkingAntsOk4H Chart Explanation:
- Price broke the Descending Trendline on a Weekly Basis.
- Price is on a lateralization after that.
- Price is on an important Support Zone.
- Bullish CCI.
- If price bounces from here, potential to move up towards the Resistance Zones.
Weekly Vision:
Daily Vision:
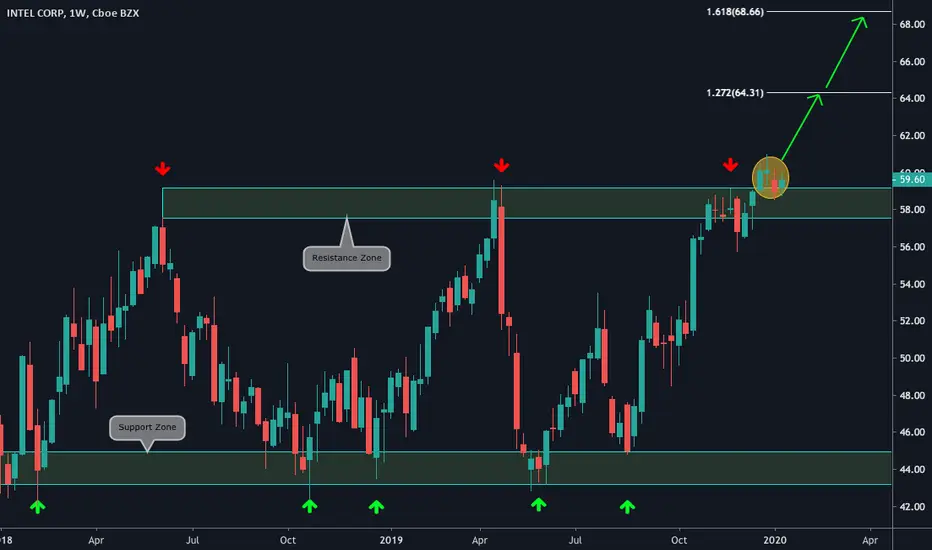
"Intel: potential up movement coming" by ThinkingAntsOkWeekly Chart Explanation:
- Price broke the Resistance Zone (All Time Highs Level).
- In lower timeframes, it is on a correction.
- We are sending signals this week to trade this instrument towards the Fibo Zones in case we consider the up move has started.
Updates coming soon!
EUR/USD- SECOND WEEK OF MY JOURNEY Hello Traders and Welcome.
I will describe what the chart illustrates about the Euro Vs. U.S Dollar. A combination prediction of Trend reversal (short and long term), breakouts and pullbacks, with the most important figure of analysing charts and specific these market (The foreign exchange market, Forex, FX, or currency market) the Simplicity. No technical indicators no fundamentals.
First of all, the downtrend line works like resistance and from the history has been tested several times, this trend line comes all the way back on 2018.
Fan line is the line inside the trend channel, is not an accelerate trend line but works like that with one similar performance. If you move the mouse on the left you will see the formation of the downtrend channel and the support trend down line of this channel.
The close tonight shows the fight of the bulls and the bears on daily time frame and the successful retest and not yet bounce the fan line that we mentioned above.
I expect break of the resistance trend line and the second try to printed enough strong for break it.
If the forecast proved successfully we can put new take profits targets of the major horizontal resistance key area, everything depends on the price action basically.
Retrospectively, I suggest to have always two plans, depending on how the market moves and after apply the propriate risk management with the stop losses and the lot size, to comes first.
From the finish of first week back to trading and 1 day off because the NYE, I am pretty confident and I close with profit of 346,56 Euro and not even 10% loss .
Thank You very Much About Your Time
Talk Again Soon
(Friday 01:05 Athens, Greece)
John Vasilopoulos

"McDonalds on a Weekly Ascending Channel" by ThinkingAntsOkDaily Chart Explanation:
- Price is on a Weekly Ascending Channel.
- Price broke the Inner Ascending Trendline.
- Price is on a Bearish Corrective Structure.
- Bearish CCI.
- If price breaks the Corr Structure, it has potential to move down towards the Bottom of the Channel.
Weekly Vision:
Updates coming soon!

SPX500 surely a short candidate now LBLS Analysis 3124 we expectBy checking the LongBuyLongSellIndicator it looks for me SPX is a clear short candidate now.
All the parameters shows 3150 to 3124 the fall will come soon.
This is the indicator i use for all my analysis for all market


28 October 2019 - Nasdaq - Long - Falling Wedge - HPT Thank you to Lizette, (one of our loyal memberss) for bringing this trade into my attention.
Nasdaq has been forming in a Falling Wedge formation.
As the price approaches 3/4s of the apex, we can expect a breakout to the upside which will send the price higher.
For a trade, we have two ways to base our take profits.
1. At the top of the wedge formation (which doesn't give it much room).
2. The price range between the high and the low added to the high.
NOTE: HPT = High Probability Trade as the previous trend is up...

Gold SellExpecting gold to go down quite a bit now. As its currently going in a downward trend its just come under my 200 ema which usually means sell. its also failed to break my 1498 zone for some time now. I have first TP at 1477.45 and second TP at 1457.35 if it finally breaks range and continues its downtrend. I have SL at top of the range 1498.72 but hopefully goes my way. This chart was based on looking at 4 hour and daily chart. like and share any comments you have about my analysis would be appreciated.

17 Oct 2019 - S&P 500 - Negative Divergence - AnalysisCHART ANALYSIS
Looking at the weekly chart of the S&P500, you can see the price has been making higher highs since January 2018.
However, the RSI indicator hasn’t…
The RSI or Relative Strength Index is a popular indicator used for when you buy or sell trades.
All you need to know is the RSI measures the speed and change of market price movements.
And if you can compare the movement in the share price versus the movement on the RSI, you’ll be able to ‘probability’ predict which way the market will go.
For this article, there is one signal on the RSI that is showing major downside to come for the S&P500.
I’m talking about the Negative Divergence that has formed.
The negative divergence is when the price of the market moves up, while the RSI falls simultaneously. This means, the momentum to the upside is slowing down and we can expect the market to drop to its next strong floor level (support level). In this case, the next target for the S&P500 is set to fall to 2,400.
And so, looking at the chart above we can conclude three things for today’s chart analysis…
Conclusion #1:
The market price of the S&P 500 has been moving up.
Conclusion #2:
The RSI has been falling (hence a negative divergence).
Conclusion #3:
The next strong support level is at 2,400.
This means we can expect a 20% drop on the S&P 500 in the next couple of months
NEWS ANALYSIS
It's official.
The US-China trade war just might be the catalyst that will send America into its next great recession.
But I don't worry about that because there is always a profit opportunity that will follow…
In fact, there is one indicator that shows a major 20% crash for the S&P 500 is likely, thanks to this impending recession.
Let me explain why the S&P will fall...
The manufacturing sector is now in a recession
With the continuing US-China trade war, we are now seeing major economic and manufacturing problems arise in the US.
Tthe ISM Manufacturing PMI has come in below the 50 level mark for two months in a row.
And as measured by the Federal Reserve, with the output shrinking over two consecutive quarters this year, the US manufacturing sector is now in a recession.
And according to the index drawn from purchasing managers, September’s drop-in manufacturing was the steepest since 2009, with production, inventories and new orders all dropping.
The “domino effect” for America’s next recession
The problem with the manufacturing recession, is that it will, create a domino effect which will, lead to other sectors falling.
Take this year’s rail road sector for example…
The drop in carloads for large US railroads increased to 5.5% in the third quarter. Shipments are down with coal, grain, chemicals, consumer goods, and autos.
This makes it the biggest drop in three years, according to the weekly reports from the Association of American Railroads.
And with the US-China trade war making shippers more anxious and cautious with their freight orders – this will continue to add to the cargo crumble.
And so, we’ve confirmed that a recession in one sector can lead to a recession in another. But more importantly, when it comes to America I like to measure its performance based on its biggest stock market with over 500 US companies listed. I’m talking about the S&P 500.
Here’s why I foresee a 20% crash for the S&P 500
Trade well,
TimonRosso

Dollar Shore opportunity D1 GartlyA harmonic pattern is about to complete. Sharply moving towards PRZ...

BTC/USD - 1H RiseWith 1000 SMA on the support side, Its' Strong Support. Taking decision around there would be a good Idea.

Dollar is in BIG TroubleI see a Big bearish wave coming in dollar market. A weakly bat is forming if the Potential "B" (supply) area is broken. then I'm expecting a big move downside....


BAC Short ScalpOn this one, I'm going to trade a short scalp on BAC.
A resistance that have showed to be valid is tested again just before the weekend and after that seen some bearish conformation that it is not ready to break yet.
With a slightly high RSI at 70 I'm getting in.
The target is where I drew the support on the chart.
Thanks for reading!
Wesley

S&P 500/SPY Next level $277.64 - $278.00S&P 500/SPY Next level $277.64 - $278.00
1) We formed a bear flag figure.
2) We have 2 big impulses (Current impulse is 2)
3) We are under two moving averages 60 and 200
4) We are under clouds ichimoku
Target is: $277.64 - $278.00

looking For short opportunity on EURAUD Euraud have Strong Reversal REsistance around 1.63 and can Flip TO downside soon!

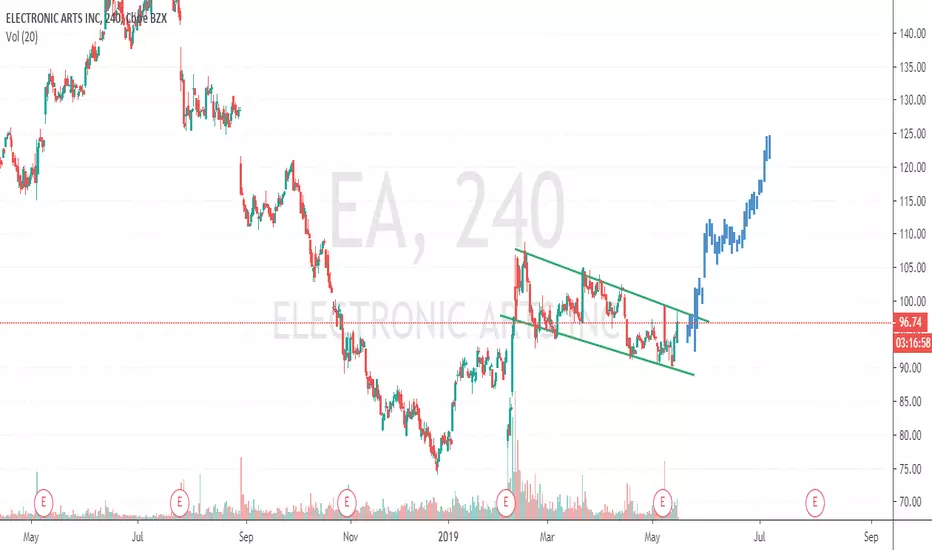
ELECTRONIC ARTS (EA) 4-HOUR TIMEFRAME LONGPrice is currently forming what looks like a bull flag pattern. If prices can break higher above $100, that should be a good indication of possible bullish momentum. Hwever, traders should exercise extreme caution and proper risk management as the last bull leg stopped abruptly, signalling the presence of sellers at every corner of this market!. Here is how i would enter this trade:
STOP LOSS: BELOW 90
ENTRY:100
TAKE PROFIT: 120
EURUSD (EUR/USD) Buy 1.11500 >>> 1.11950 (Small target)EUR/USD
1) Two days we close above main volume
2) We have two impulses for first target correction
3) We have resistance zone 1.11923
4) We have Low volume trade zone for confirm first target correction
---
Buy = 1.11500
Take Profit = 1.11950
Stop Loss = 1.11050
---

American Air (AAL) Sell $33.67 > $30.62 (Profit:Risk = 2:1)NASDAQ:AAL
American Airlines Group, Inc.
Information:
Growing Channel was broken. Now we have formed a bear channel. At the opening with a small pullback considering sales.
SPY/SPX/S&P 500 in the coming days may show weakness and fall on the mini correction (Gold is now in a growing local phase).
According to the volume profile, we will have to preserve the main savings for the subsequent fall down.
Today we expect reports.
About stop loss:
Stop loss for the top $35.27. Can be reduced, but given the day of the report. I reduce volume of the position stop loss a little more is obtained.
------
Sell Limit = $33.67
Take Profit = $30.62
Stop Loss = $35.27
------
Profit:Risk = 2 : 1
Profit:Risk = +9.06% : -4.75%

Cisco Systems (CSCO) Sell $56.33 > $48.63 (Profit:Risk = 4.48:1)NASDAQ:CSCO
Cisco Systems, Inc.
Information:
We go up the channel for too long.
Now there will be a breakdown and a reversal of share price.
About stop loss:
Stop loss is placed just above the weekly candle in case of a false touch.
Weekly chart:
Daily Chart:
H4 Chart:
------
Sell = $56.33
Take Profit = $48.63
Stop Loss = $58.05
------
Profit:Risk = 4.48 : 1
Profit:Risk = +13.67% : -3.05%

Dominos Pizza (DPZ)(NYSE) Buy $286.00 >>> $269.95Deal on breakdown and return prices.
NYSE:DPZ
Dominos Pizza Inc
Stock - NYSE (USA)
Profit:Risk = 1:1
---
Sell = $286.00
Take Profit = $269.95
Stop Loss = $302.06
------
Take Profit = +5.61%
Stop Loss = -5.62%
