The #NASDAQ could see it's Biggest Selloff in it's LONG HISTORY!The #NASDAQ could see it's Biggest Selloff in it's LONG HISTORY!
America

URA LONGNormal descending triangle in downtrend is bad but this has held the low for a few years and is still down 90%+ from previous highest while the supply has just recently dropped by about half, so seems like a good buy to me.

USD MXN rangingWe find this pair ranging, we are expecting a bounce off the bottom support line as we are expecting the USD to make a strong rally again next week, but we will be keeping an eye on this and Entry, TP and SL will be sent out to our clients as and when this trade becomes valid.
Message us about joining our group.

Market slaughter housesIn this screencast and links below I expose what's going on in market manipulations.
In essence large organisations - who shall remain nameless - are busy buying back their own stock in an attempt to stabilise Wall Street and other markets. This is likely to give small investors a sense of security that they should buy stock. Price - to the minds of the big boys - is likely to move north as the small fish come in. Then the big boys sell off!! Oh sure - this is a gamble by the big boys. How big? Nobody really knows for sure. Estimates are in the region of Trillions of US dollars.
Yes the big boys have a secret 'war chest' with which to fight the markets. And the 'big' manipulate money out of the pockets of the poor. This is Corporate America - innit?
References:
1. Corporate buybacks keeping the markets afloat (at this time).
2. Why would a company buy back its own shares?

USD YUAN (US CHINA) FOREX BREAKOUT SOON (JUNE 22-23?) TRIANGLE*Horizontal triangle with a breakout by 23 June at the latest (apex).
The breakout could be either direction so pay attention to when the breakout starts in order to short or long.
The potential breakout could be gigantic so this along with bitcoin is one to watch out far.
Remember, make sure the breakout is trending (bullish or bearish) before investing or it may reverse.
As always, any and all feedback would be awesome!

DOLLAR INDEX POSSIBILITESI personally believe it to fall down, But we have strong Data Expected on Monday next week, so no trade until that time,It's always best to trade on tuesday according to my timezone when market settles.
If you find this analysis Useful then like and commnet ;)


EURUSD SHORT TO LONGEURUSD has clearly broken the 1.20 monthly res for a while. Right now its definitely looking over bought, so upon the next month I'm thinking we're going to be seeing those sells happening maybe back to the 1.20 res but most likely hover just over it at 1.205/1.21 I'll be placing buys at 1.21 with a TP at 1.27 then buy again to TP at 1.35 (6 Months+). In the short term be selling at this all the way to 1.21.
News will be playing a big role to switch the buy to a sell..keep on the look out and take the opportunity when you can!
All the best.


Analysis of % market cap of europe and america vs the world ...Analysis of % market cap of europe and america vs the world ... money.visualcapitalist.com

BCH Hints to Sell all to USDBy highlighting the lack of support to continue to push through the recent upward resistance (highlighted in blue) and drawing numerous resistance lines, we can see there is a strong support to switch from BCH to USD. You heard it here first.

DXY - RSI 21 - 3X DIVLots of divergence - Market is not buying FED policy fully... Dollar devaluated 20.2trillion dollar debt

Bitcoin ABCDE WaveThere are 2 scenarios in this chart:
1. The Elliot Wave completes with 5 being the longest and most powerful, in which case I'd expect the price to hit a new low, but not much lower. ~2800
2. We are in an ABCDE pattern and will finish the b leg of the B (Orange) wave, then start the lower descent to a new target of ~3225. The overthrow from wave E (Orange) will push us into a new low. ~2600

BAC breaking out and ready for take offBAC broke out of the triangle it has been stuck in for a while. as tech stocks dumped, it could be a good time to jump into financials. especially with that breakout.

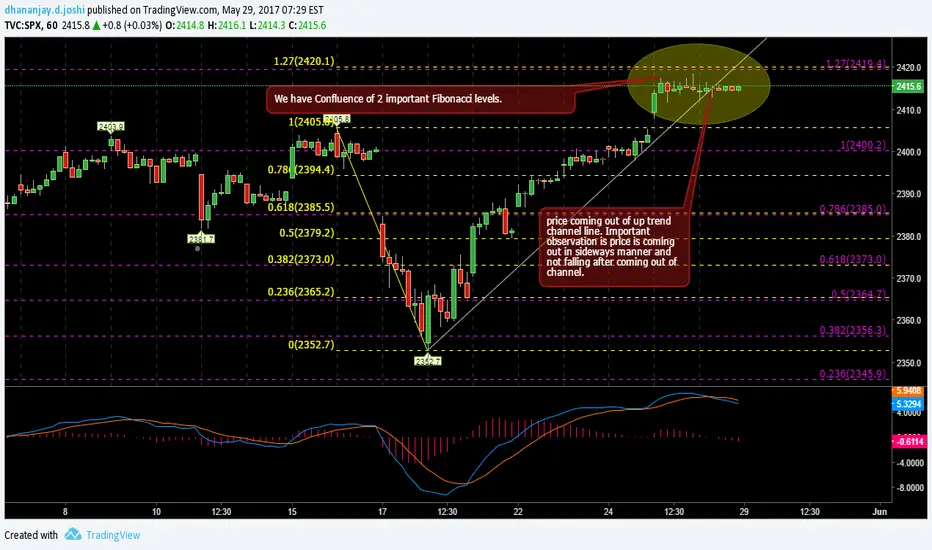
SPX near important price and time point
As i have said many times when we don't have any thing on left of the chart we will have to use Fibonacci, Price structure and channel or other tools like WD Gann analysis.
On hourly chart we can see that price is near 2 Fibonacci levels and moving sideways. With the side ways movement price came out of up trend channel. This indicates that buying pressure is decreasing and participants of market are waiting for clear trending move. trigger to movement can be anything.
We will have to wait for structurally price to close below earlier swing low. The move after that will be quick. Expected move can come in 1 to 2 weeks time.
If price moves up and closes above important Fibonacci levels then structure and Fibonacci levels can be used to trade.


USDCHF FALSE CHANNEL BREAK OUT1)Price failed to break and close above resistance zone @ 0.99040
+ triple top formed @ 0.99500 zone
2) False Break and retest of descending price channel
3) Daily support broken @ 0.98402 zone
4) Previous Daily candle closed as an bearish engulfing
5) MA's spiralling to the downside
adding confluence to bearish momentum
6) A break of the trend line will warrant shorts
7) Target 1 @ 0.95039 zone = weekly support giving extra confluence

Will NZDUSD make a head and shoulders formation?From what I see, two spinning tops formed at the bottom of what could be the neckline of a potential head and shoulders formation, indicating there may be a reversal of direction. I am waiting on some more bullish confirmation from the daily chart however you may find some good long opportunities on a shorter timeframe.
Good luck and please trade at your own discretion.
