Bank of America Stock Surge on Q3 Earnings BeatBank of America (NYSE: NYSE:BAC ) delivered impressive third-quarter results, showcasing its resilience amid a challenging economic landscape. The bank reported $25.34 billion in revenue, slightly up from $25.17 billion a year earlier and above the analysts' consensus projection of $25.28 billion. Although profit fell to $6.90 billion ($0.81 per share) from $7.8 billion ($0.90 per share) last year, this was still better than the expected drop to $6.45 billion** or $0.75 per share.
Key Financial Highlights:
- Net Interest Income (NII) was reported at $13.97 billion, down from $14.38 billion a year ago but exceeding the expectation of $13.85 billion.
- The bank's trading revenue saw a significant uptick, with fixed income trading revenue rising 8% to $2.9 billion and equities trading jumping 18% to $2 billion.
These results come on the heels of similar positive reports from rivals like JPMorgan Chase and Wells Fargo, highlighting a robust start to the big bank earnings season. This broader positive sentiment in the banking sector is likely contributing to a favorable outlook for Bank of America.
Technical Analysis
As of the time of writing, NYSE:BAC shares are up 1.62%, signaling a bullish trend. The stock has recently rebounded from a consolidation zone, gathering momentum for further upward movement. A key indicator of this bullish sentiment is the Relative Strength Index (RSI), currently hovering around 71, indicating that the stock is entering overbought territory.
The stock's performance is further supported by its trading above key moving averages, which traditionally signals a strong bullish trend. Analysts note that this upward momentum, combined with the bank's robust earnings, positions Bank of America (NYSE: NYSE:BAC ) favorably for potential further gains, especially as NII shows signs of recovery.
Investment Implications:
The current trajectory suggests that Bank of America (NYSE: NYSE:BAC ) is turning a corner in terms of NII, as indicated by analysts like Wells Fargo's Mike Mayo. With the Federal Reserve having recently cut interest rates, analysts believe this should help improve bank earnings moving forward, as lower deposit costs may enhance profitability.
Additionally, with a provision for credit losses reported at $1.5 billion, slightly under the estimated $1.57 billion, the bank appears to be managing its risks effectively, further instilling confidence in investors.
Conclusion
Bank of America's latest earnings report reflects a strong performance amid a dynamic banking environment. The combination of better-than-expected trading results, a recovery in NII, and robust investor sentiment positions NYSE:BAC as a compelling investment opportunity. As the bank continues to navigate the evolving landscape of interest rates and economic conditions, investors may want to keep a close watch on its performance in the upcoming quarters.
America

SPX & Bitcoin Correlation & US presidential election #Spx 1D chart;
Let me first talk about the importance of the S&P 500 chart;
They are positively correlated (i.e. they move together):
*#Nasdaq100
*#Oil
*#Bitcoin (sometimes)
Now, what I want to draw your attention to is that just before the presidential elections, in September and October, there was always a decline. After the elections, there has been a continuous upward trend in the first 100 days.
Not counting the 2008 world economic crisis, this has never changed in the last 3 elections. Even after the 2008 crisis, after falling for a while, it started to rise immediately afterwards. The data we are evaluating here is the first 100 days.
In September 2024, I indicated the decline with an orange circle
With a decline in October, a long-term uptrend may begin.
If Bitcoin also shows a correlation here, which is my expectation as in the #Btc chart I drew earlier, we will start a permanent uptrend after suffering for another 1 month.
SP500 end of first 100 days data after the US Presidential election:
Post 2020 Election (Joe Biden): +17%
Post 2016 Election (Donald Trump): +10%
After 2012 Election (Barack Obama - Second Term): +10%
After 2008 Election (Barack Obama - First Term): -19%

US DOLLAR - Boxed RangeUS DOLLAR is trading SUPPORT and RESISTANCE zones within a boxed RANGE.
It is respecting a range of 100.53 - 101.93, with respective bounces on either end, keeping it within its BOXED RANGE.
When I'm speaking about a BOXED RANGE, what I mean is that the RANGE ISN'T TIGHT like a normal range, where its looking for volume before a big move, these types of ranges have volume and are easier to read as they respect KEY ZONES, for example right now they are respecting 100.53 - 101.93.
We should wait for the US DOLLAR to enter either SUPPORT or RESISTANCE to enter a trade, we can wait for a rejection + bounce or wait for a breakout.
If the US DOLLAR breaks to the downside (BEARISH) I would expect for the overall US markets to continue it's BULLISH movements, as usually the US MARKET IS INVERSELY PROPORTIONAL TO THE US DOLLAR INDEX...
Conversely if it shows BULLISH signs and begins to move towards the SUPPORT ZONE, I will be looking for the US MARKET to move BEARISH.

GBPJPY | Trade ideaOn Tuesday, the yen gained support as Bank of Japan Governor Kazuo Ueda maintained a hawkish stance, indicating the central bank might raise rates further if the economy meets expectations. Ueda’s comments were part of a document presented to a government panel led by outgoing Prime Minister Fumio Kishida, where he detailed the BOJ’s July policy decision. His remarks emphasized that despite global market volatility, partly triggered by the BOJ's July rate hike, Ueda remains committed to raising borrowing costs if the bank’s projections are realized.

$USINTR - A Month of BreathThe Federal Reserve left the target for the Fed Funds Rate ECONOMICS:USINTR
unchanged at 5%-5.25%, as expected, but signaled rates may go to 5.6% by Year-End if the Economy and Inflation do not Slow down more.
It is the first pause in the tightening campaign following ten consecutive hikes that lifted borrowing costs by 500bps to the highest level since September 2007.
Throughout Fed's announcement The Dollar Index TVC:DXY
plunged to what can be said Wave C completed from A-B-C
Elliot Waves Correction
(attached ideas)
Have the markets priced in Inflation ECONOMICS:USIRYY and Interest Rates ECONOMICS:USINTR ?
TRADE SAFE
*** NOTE that this is not Financial Advice !
Please do your own research and consult your Financial Advisor
before partaking on any trading activity based solely on this Idea .

Apple getting golden to $301.56W Formation formed on Apple and the breakout was strong and confirmed.
With the momentum up and the strong demand and buying, we can expect this market to rally up.
Nature: HIGH Probability
Target $301.56

Crashing airlines - Brace for impact to $6.04Inverse Cup and Handle formed on Anerican Airlines since 27 July 2020.
The price still needs to break below the brim level, but it's looking really bad.
Nature: High Probability
Price<20
Price<200
Target $6.04

S&P 500 Cup and Handle formed and ready to run up to 5,704S&P 500 has formed a Cup and Handle, broken above the handle and has created a breakway gap.
This is showing the beast is ready to run up and rally to new All time highs.
It's ideal for the price to turn, test and confirm which will help get us into a better position for a trade.
My first target is at 5,704.

The next decade belongs to Latin AmericaFor the past decade, decision-makers in major banks and multinational companies have been focusing their attention on one of the hottest "growth frontiers": emerging markets.
During much of the 1980's the prospects in most emerging countries were quite bleak: the debt crisis, inflation and domestic political turbulence.
Then a number of "economic miracles" began to pop up, drawing attention to specifically Southeast Asia, the Indian subcontinent, Eastern Europe and toward the end of the 80's, Latin America.
Latin America struggled with the heavy burdens of the debt crisis, hyperinflation, recession and the transition from authoritarian to democratic governments. Most analysts call the 80's Latin America's "Lost Decade." Most governments in the area came to the realization that they were gradually becoming irrelevant to the investment decisions of major international players and that they would slowly but surely lose ground to Asia and Eastern Europe in the competition for capital and employment opportunities. The region's trade with the rest of the world increased but at a slower pace than in countries at similar stages of their development. Latin America largely remained an exporter of primary goods. In fact, beside the popping off of just particular industry sectors and multinational companies, Latin America never saw a bullrun as a continent.
After lagging behind big players like India and China during the Era of Markets (1989–2019), where there was a remarkable increase in global economic interconnectedness and rapid adoption of digital technologies, now it's time to shine for Latin America and to catch up to OECD economies.
The next decade is expected to be a transformative period for Latin America with many countries experiencing rapid growth and development.
Economic Growth : Latin America's economic growth is expected to continue, driven by a combination of factors such as increased trade, investment, and infrastructure development. The region's large and growing middle class is also driving consumer spending and demand for goods and services.
Regional Integration : Latin America is also expected to strengthen its regional integration, with initiatives such as the Pacific Alliance and the Mercosur bloc aiming to promote trade and cooperation among member states. This will help to increase economic competitiveness and attract foreign investment.
Demographic Dividend : Latin America is experiencing a demographic dividend, with a large and growing population of young people entering the workforce. This will provide a significant boost to economic growth and innovation, as well as help to address social and economic challenges.
Innovation and Technology : Latin America is also expected to become a hub for innovation and technology, with many countries investing in digital infrastructure and innovation hubs. This will help to drive economic growth and create new opportunities for entrepreneurship and job creation.
Emerging countries now represent the clear majority of the world's population. Their growth prospects range from 4 to 5% per year in Latin America, 6 to 7% in East Asia and up to 10% in China. These are typically two to three times the expected growth rates of developed countries.
In all of these countries, growth will invariably entail the expansion of new middle classes, with outsized needs for consumer durables, housing and mobility.
The MSCI Emerging Markets Latin America Index e.g. captures large and mid cap representation across 5 emerging markets countries in Latin America. This index is one of the most trusted measures of how these stock markets in the region are performing. However, all the constituent countries do not have a proportional representation in the index. The country weights in the MSCI Emerging Markets Latin America Index are mostly Brazil 46.6%, Mexico 36.51%, Chile 9.79%, Colombia 4.17% and Peru 2.93% with sectors like materials, energy, consumer staples, common services and financials.
Looking at the Index from a technical macro standpoint we can see clearly almost 20 years of an (Wyckoff) accumulation period (with the launch in 1990 probably even longer) and sideways movement resulting in a kind of created bull flag signaling a continuous coming-in of buyers and losing steam of sellers.
Furthermore the monthly RSI is printing higher lows and higher highs which is an indicator for a steady uptrend and positive momentum shift towards the upside.
No doubt, Latin America is gonna flourish the next decade(s) marking a significant transformation, with the region poised to emerge as a major player on the global stage.

BTC and 59000Following the sudden price movement in Bitcoin due to the tension between Israel and Iran over the weekend, the resulting market tension provided a buying opportunity below 60K. I had written that this wouldn't sit well with American institutions. Ultimately, as we've reached today with the opening of NY, the price retraced, reaching that level and even dipping below the wick point to clear out liquidity. COINBASE:BTCUSD

Accenture turning down for the worst to $283Head and Shoulders seems to be forming on Accenture.
This pattern started on 11 December 2023, the price headed to a high at $386.00 and right back down again.
Now it has reached some semblance of support but could be forming a right shoulder.
If we see a price break, then it is likely for the market to drop all the way down to $283.
Medium Probability
Price<20
Price>200
Target $283
POSSIBLE PROBLEMS:
Shift in Demand:
There may be a shift in demand within the services offered by Accenture, with clients possibly prioritizing different areas of investment due to changing market conditions
Operational Challenges:
Any operational challenges or inefficiencies within Accenture could also lead to increased costs or reduced profitability, affecting share price
Strategic Investments and Acquisitions:
While Accenture has been active in acquisitions aimed at expanding its capabilities and market reach, the initial costs and integration challenges of these ventures could impact short-term financial performance, affecting investor perspectives

JD.COM showing upside soon to come to $35Inverse Head and SHoulders seems to be forming on the JD.COm
The market has come down from a high of $42 down to $21 since July 2023.
Then there was a solid consolidation and higher lows forming, before the next move.
Now we do have a potential Inv H and S but it's still of a Medium Nature.
Price>20
Price<200
The target is around $35.01 but we need the price to first break up and out of the neckline.
Let's wait and see.

ethereum ETH (MACD)The reason MACD is not so reliable even with blue chip analysis; as seen in the graph the rising movement in the MACD indicator leads the buyer to think the price is going up and at the same time using a measuring stick it had been 50 days since the last price increase, instead of going positive like the MACD and timeline would lead one to think, the price went down really hard. A bad sign for the 100 day moving average is to see the price fall hard like Ethereum did at the 50 day.

Don't Blow this Dip-Buy opportunity in 2022 for Cummins"Natural science has invaded and transformed human life all the more practically through the medium of industry; and has prepared human emancipation, although its immediate effect had to be the furthering of the dehumanization of man."

TECHNICAL TUESDAY 3/26/24Today may or may not pan out as far as triggering an entry.
As of right now we are hitting 2 out 5 on the checklist which means, NO ENTRY.
Will revisit at 0845.
what will I be looking for?
US Core Durable Goods Orders
US Durable Goods Orders
Why? Because 'actual' less than 'Forecast' is good for precious metals. If this happens at 0830, Ill feel better about entering the buy stop.
Why will I not be selling even if given a signal? Welp Jimothy, because its above water and thats a no-no.
And for the love of sweet baby Jesus, please dont over leverage.
********Disclaimer********
The trade ideas and insights provided on this channel are for informational and educational purposes only and should not be construed as financial advice. Trading involves substantial risk and is not suitable for everyone. You should carefully consider your financial situation and consult with a qualified financial advisor before making any investment decisions. Past performance is not indicative of future results. The content shared here is based on personal opinions, analysis, and interpretation of market trends, and it may not always be accurate or up to date. By participating in these trade ideas and insights, you acknowledge that you are solely responsible for your own investment decisions and any outcomes that may result. The moderators and administrators of this channel shall not be held liable for any losses incurred from trading activities. Always conduct your own research and due diligence before engaging in any trading activities.

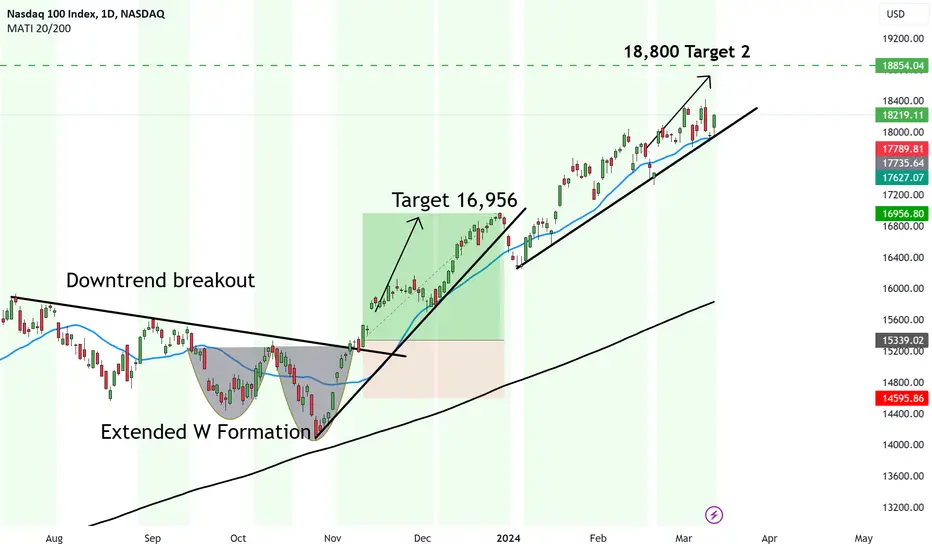
UPDATE: Nasdaq target 1 reached next one even higher116,956 target reached easily.
This was based off the W Formation and the price breaking above the neckline.
Then we had the run up which surpassed the first target of 16,956 - Text book.
Now the price is heading to the next target at 18,800. This is purely based off a momentum trending strategy.
The bull run is not over until it's over...
So trade cautiously and trade within the trend.
If you're predicting tops, EGO is taking over.
If you're predicting tops, Gambling mentality is lurking.
If you're trading tops - You feel you have something to prove.
Simple.
UPDATE: US 30 trend trading haven to 40,000This is a bit out of my expertise.
THe price broke above the pattern and reached the first target.
Since then it's bneen a trenders market. Simply buying, holding and raising stop losses above in case the trend changes.
They have their systems and strategies, and I'm just waiting for a Breakout pattern to form.
However, the price is above both 20MA and 200MA which makes the bias continued to be bullish.
The next target I can imagine is none other than a psychological level at 40,000.
Then we could see consolidation and range boundedness for a while.

BUY StopLooking like Ill be changing my bias based on structure, and DXY short.
Will hold for 160 pips but first TP is 40
Enjoy

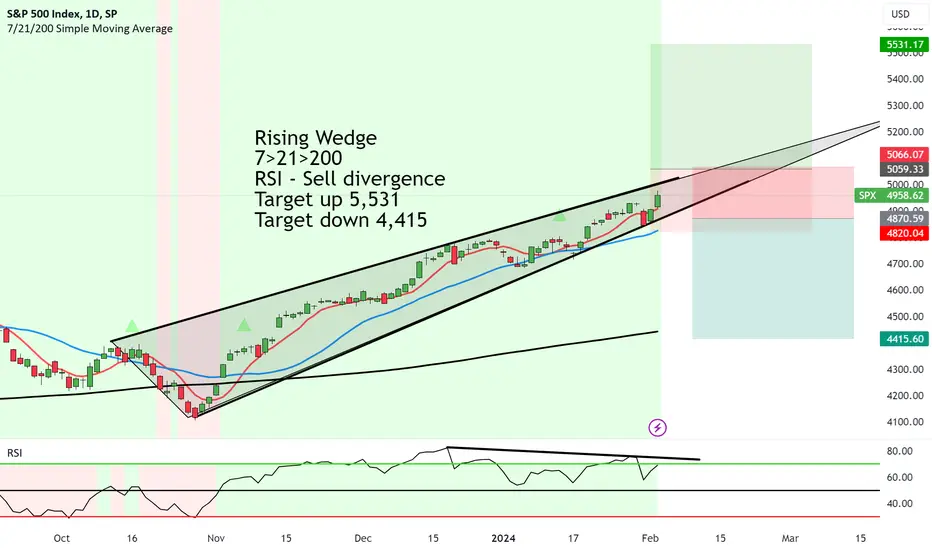
SP500 ready to breakout of the Wedge - Which direction though?There are conflicting signals with the SP500.
Yes it is definitely in a BULL market no doubt about that.
This is defined as a rising trend and with 7>21>200. And the price is above 200MA (main decider).
However, the indicators are showing a potential Sell Divergence as the RSI is making lower highs.
This does seem to be a Rising Wedge but the concern is the low direction of the prior trend.
This is a classic example to play the trade depending on the breakout.
If it breaks up the next target could head to 5,531
If it breaks down, we could see it heading back to the 200MA with a target of 4,415
Which direction are you vouching for?
LL Flooring Revision: Back From The GraveBuilding your new home is exciting, especially when you understand how the process works. It’s understandable that buyers are excited to see their new home built from start to finish says Chip Perschino, senior vice president of construction at Edward Andrew Homes.
“Our homeowners enjoy watching the home come together, from pouring the foundation to framing and watching the home take shape,” he says. “Once the home has drywall, they start to visualize themselves living in the space and how they’ll use it — imagining what furniture goes where and how they’ll entertain friends and family there.

Is this the big bad turn for LVMH?LVMH has had one heck of a run from $39 in 2009 up to $996 in 2023.
But since April 2023, it just has NOT been able to break that $1,000 psychological mark.
And since the beginning of last year, we've seen it form a bearish Head and Shoulders pattern.
Now I am not a total bear yet. We do need the price to break below the neckline before we get all excited about the short.
But until then it's a patience game. We also have other indicators showing potential downside to come including:
Price<200
20>7
RSI<50
Target $412
Let's see how it plays out, cause this could make a change any week now.

$DXY -Ballads of the Dollar *W (11 Consecutive Green Weeks) Its time for a Dollar Story !
(previous lin echart idea 100-105 Range; before & after to the current spot)
The Dollar Index ( TVC:DXY ) has managed to print 11 Consecutive Green Weekly Candlesticks,
rallying up as much as 8 % from its July/2023 99.580 Low.
A low violating all Technical aspects, which got us into a Short Idea but not
for long before changing bias
(idea's live chart)
TVC:DXY tried to close in Green its 12 Consecutive Candlestick Print, but failed to do so.
However,
during this up-rally time of Dirty Mighty TVC:DXY for the past 11 Weeks,
heavy negatively correlated assets like $EUR/USD and other major FX pair got
slapped on the face mercilessly,
as well so did the US Major Financial Markets and other Indexes and Equities,
but when comparing them with the Fiat Currencies market,
their blood shed was less.
Is about time for The Dollar Index ( TVC:DXY ) to cool down for a while and correct ?
Fundamentally no,
as fear and troubles looms for a US Recession being just around the corner.
Technically (TA) speaking yes,
it is time for a brief correction,
would be totally fine for someone looking in to longing the Financial Markets or
exchanging their Fiat Dollars for other Major Fiat Currencies.
We can see TVC:DXY on line chart having broken the Range's Ceiling of 100-105,
as well retesting it (so far).
Holding it as Support or finding itself below again facing it as Resistance
shall be proven on upcoming week(s)

Dow Jones Leading the indices? Next target sky highExtended W Formation has formed on Dow Jones.
WHile other indices and stock exchanges are falling or moving sideways, this one is racing up without any shackles.
There's always been a price breakout above the downtrend since Aug 2023.
All in all, it's looking very bullish and is showing upside to come.
Target R35,689
What's interesting is the DOw Jones, SP500 and Nasdaq are normally the leading indices. So could this be a prediction that other indices (including ours) are ready to rally to new HIGHS of the year?
If so, we need to prepare for this possibillity with hedging carefully.
