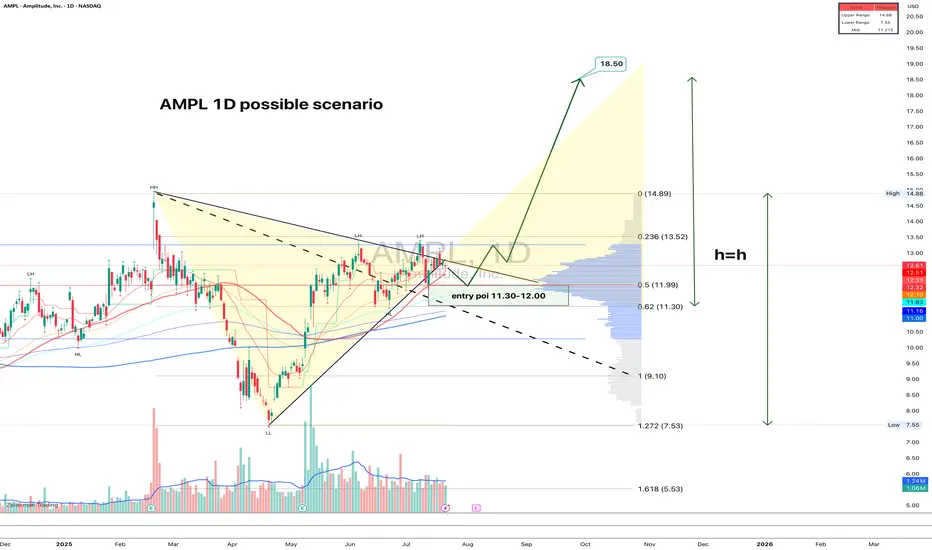
AMPL: structure clean, volume right, fundamentals warming upAMPL just broke out of a symmetrical triangle on the daily chart. The breakout was confirmed with decent volume, and now price is calmly pulling back into the 11.30–12.00 zone — exactly the kind of textbook retest that gets serious traders interested. The 0.618 Fib level sits at 11.30, and 0.5 at 11.99, strengthening this entry area. Volume has tapered off post-breakout, which is typical before a continuation. Moving averages are stacked bullish, confirming the trend shift. First upside target is 13.52, followed by 14.89, and if the full h = h move plays out, price could reach 18.50. A natural stop sits just below 11.00. Clear structure, solid risk control — this is one of those setups that checks all the boxes.
On the fundamental side, Amplitude remains a key player in product analytics and digital optimization. After a slow 2024 marked by cost-cutting and stagnating revenue, the company is showing early signs of recovery this year. The broader SaaS market has stabilized, and AMPL is benefiting from renewed enterprise demand, especially for AI-driven user behavior analytics. Recent earnings came in better than expected, and institutional interest has quietly returned. Valuation is still moderate at these levels, giving it room to re-rate if momentum builds.
A clean breakout with technical alignment and an improving macro picture - when both sides of the story match, it's worth paying attention.
Ampl
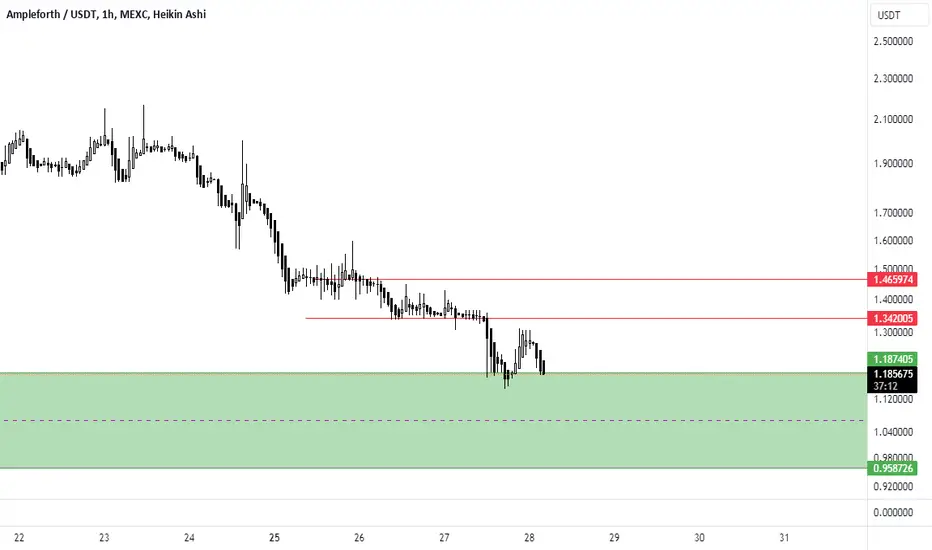
AMPLIn the daily time, it is in a strong support zone. In my opinion, it is more suitable to buy the green box until it breaks the above lines.
#AMP/USDT#AMP
The price has been moving in a descending triangle since June 2022
Due to a strong support area at 0.001500
We are on the verge of a downtrend supported by oversold conditions on the MACD
Current price is 0.002275
The first target is 0.005555
The second goal is 0.008855
Nearly 400% of the current price
Powered by the Moving Average 100 breakout.

FLOW ADAM AND EVE PATTERN: TIME FOR AN UPTRENDIn this logarithmic chart, BINANCE:FLOWUSDT is forming an Adam and Eve pattern in which the price movement creates two bottoms, one indication of reversal for the coin's current downtrend. Will it happen in the next days or may not? To answer that, I'll provide continuous technical analysis for you in this idea thread below. Always PLAN your trades, secure positions and happy trading!

AMPL Sitting at a 0.786% RetracementSo long as it can hold the 88.6% - 78.6% zone here over the next couple of weeks we will likely be targetting the $1.12 Level and beyond from here. At the Highest we will see it go to the 88.6% Retrace from the high to low which would land AMPL at $1.736

Ampleforth Has Grown A Massive 769% Since November 2021This week Ampleforth (AMPLBTC) broke weekly above a new resistance to hit its highest price/level since October 2020.
A long-term double bottom pattern was formed for this pair in 2021 followed by a very strong bull-market.
AMPLBTCs bull market is reaching its climax.
From its Nov. 2021 low, so far we have over 760% of growth.
Additional resistance levels are mapped on the chart.
We are not making any predictions here, just sharing what has been happening with this pair.
Thank you for reading.
Namaste.

AMPL Sitting at a 0.886 RetracementSo long as it can hold the .886 here over the next couple of weeks we will likely be targetting the $1.10 Level from here

AMPL in the perfect buy zoneAMPL has completed another of its parabolic rise/correction cycles. Thanks to the overall crypto market correction today, AMPL now hit its bottom and is in the perfect buy zone range. After several red days, I expect this asset to make a quick recovery of 30-40% followed by a minor correction and accumulation phase that may last 2 to 3 weeks and finally ending in the next parabolic rise/correction cycle, possibly by mid to late December. RSI and MACD indicators both signal this to be an opportune moment to invest in this asset.
We now have a fairly consistent history of AMPL's fluctuation between the ~0.8 and 1.7 USD range and can predict similar patterns to follow with relatively high confidence.
Good luck trading and remember to always do your own research before committing to an asset.

AMPLUSDT Technical Analysis⏳ Spot
💎 AMPLUSDT has broken above the major resistance. We see several large green candles which indicates the bulls are in control. After the pullback we can expect another Bullish move
🌐 Tradingview
💵 Invest Only 5% of your Portfolio
🎳 Entry/Pullback now or from 1.03387 -0.91716
☕️ TP1 1.15590
🍺 TP2 1.32243
🍻 TP3 1.60244
🍾 TP4 1.81024
🍷 TP5 2.00000
🍸 TP6
🍹 TP7
🎁 TP8
🚫 SL 0.91716 - 0.79926
Good Luck 🎲
Check the Links in Description and if you LIKE this analysis, please support our page and Ideas by hitting the LIKE 👍 button. ❤️ Your Support is really appreciated! ❤️
Traders, if you have your own opinion about it, please write your own in the comment box. We will be glad for this.
Feel free to request any pair/instrument analysis or ask any questions in the comment section below.
We will have more FREE forecasts in TradingView soon
Have a profitable day 😊👍🏻

50% Move to the upside incoming for AMPL?All indicators showing a reversal incoming on Ampl.
Channel support here.
MacD impending reversal.
Stoch RSI bottomed and looking for crossover.
Squeeze indicator also showing reversal incoming.


AMPL in a steady updtrend
AMPL is in a steady uptrend since the May crash. It is the only token I found to have somewhat decoupling from the cryptomarket temporerally and continues to make steady profits since May. This may be due to the rebasing nature of AMPL. We can see AMPL has been fluctuating in a channel between ~0.7 and ~1.8 USDT over a long period of time. Currently it stands at around the mid point of 1.07 USDT. If this is the case, AMPL was, and still remains a very good investment, at least until we get a clear direction for the general market, as it is less susceptible to the constant BTC dips. Instead, by following its current uptrend, it is gaining very good traction against BTC (see the AMPL:BTC chart).
I expect one of two scenarios:
1. AMPL will continue up until it reaches ~1.8 USDT and then it will start declining. This is representative of the simplistic sketch I made in the chart. I suggest stop losses at around the current daily MA price. Expected profits can be around 50%.
2. New hype (e.g. AMPL being added on AAVE as a borrowing asset) may bring a surge of new liquidity into AMPL causing a price hike that may shoot price out of the regular channel and above 1.8 USDT. This won't last, but can lead to very high short to mid term profits (see AMPL:BTC for potential).
In any case AMPL seems like a very good investment for now.

AMP Monthly Buy SignalAMP has generated a bullflag on the Monthly timeframe
Really good signal if you are looking to long this coin
and by long, I mean long.. (Month by Month)

AMPL/USDT Double Bottom Formation, 2x Profit Probability!I've been following this chart for almost months, but since I'm not actively on the crypto exchange, I can't take advantage of these opportunities. Actually, I should have shared this chart months ago, but I forgot. It seems too late to buy now, but we may still have a chance.
If we look at the other double bottom formations, it was realized with a slightly longer interval. Even if we look at the bottom, we see structures with double needles. Maybe the last double bottom I showed could be single of the double bottom formation. Therefore, we can see a decrease to 0.75-80 levels again. If it stays above 200EMA (Purple line) maybe it can go directly to 1.70 levels. Both possibilities are positive, but for those who can't buy it like me, it would be good for it to drop once again. If it were me, I would put my limit order at numbers like 0.80 and wait. Also, none of what I've said here is investment advice.
Additionally, it has taken a very resilient stance towards BTC. Yes, it fell more than 50 per cent but that helped our technique work. As low as 0.50, buyers recovered this price and retreated to the main zone. I think this fake breakout shows us that there are still a lot of buyers and they are resistant to BTC dominance. So I would trade with stop-loss. As a sell order, 1.60-1.70 levels look very perfect. Of course, there is no such thing as it will come out, but he has tested it 3 times. In fact, this time (if it comes out) it can go above the 1.70 level and break the big resistance. Your every investment is your responsibility. I hope all your trades will be profitable. I wish you a good day!
I trust the AMPL...


Long soon AMPL-USDTI think tillmid of april price will reach 1.5 usdt like its shown on previous chart. I will open position at this sunday 21. march.


#AMPL soon to have a breakoutYou can trade on Kucoin AMPL/USDT
Soon will have a breakout and ready to go up
Only spot buy always!!! 25% 40% 50% profit
Enjoy!!!


