Amazon is an opportunity to buyHello traders. There is a great investment opportunity in Amazon shares. With a downtrend break. And break the ascending triangle pattern. Likewise, breaking the resistance at level 104. These are all factors confirming the strong entry of buyers into this giant stock .Note: If you like this analysis, please give your opinion on it. in the comments. I will be happy to share ideas. Like and click to get free content. Thank you
AMZN

AMZN Stock Analysis: 4 Reasons to Doubt the Bullish OutlookAfter the Fed signaled last week that rates may be higher for longer than expected, the US stock market has received a strong bearish boost. And among the most vulnerable assets were technology stocks (considered risky). The NASDAQ index has already fallen by about 6% since last Wednesday (when the FOMC meeting took place). And the negative backdrop from the Fed is one of the 4 issues that give reason to doubt the bullish outlook for AMZN stock.
The second reason is that AMZN has fallen 9% in value since last Wednesday. That is, AMZN is falling faster than the overall market. And this problem is not new. Compare the dynamics of the index and Amazon shares on a weekly timeframe and you will see that the shares have been performing weaker than the index since the summer of 2020. That is, the leadership status that was held for many years has been lost.
The third reason is that yesterday, it became known that the Federal Trade Commission and 17 states sued Amazon, claiming that its online commerce policies illegally stifle competition. The litigation could put further pressure on the stock price.
The fourth reason is volume analysis. The last two spikes in large volumes of trading in AMZN shares on the NASDAQ exchange were recorded on August 4 and September 15. After the first surge, the price stopped growing as part of a bullish trend that has lasted since the beginning of 2023. After the second, it began to decline. Perhaps large players took profits from the rally and reversed positions in anticipation of lower prices?
It is also worth noting that the 2023 rally did not reach the level of 50% of the A→B decline, so the level of USD 126 per share of AMZN (providing support in July) may be broken against the backdrop of these problems, opening the way to the psychological mark of 100 USD per share.
This article represents the opinion of the Companies operating under the FXOpen brand only. It is not to be construed as an offer, solicitation, or recommendation with respect to products and services provided by the Companies operating under the FXOpen brand, nor is it to be considered financial advice.

TSLA NVDA AAPL MSFT AMZN GOOGL META Price ForecastWelcome to the daily how to make money online with stock market Mega Cap 7 Tech stock, Nvidia Microsoft Google Apple Amazon Meta Tesla Stock, Technical Analysis Show where I break down the price action and let you guys know what the most likely scenario I think will be going forward.
00:00 QQQ & Sp500 ETF Stock Price Forecast
07:22 Tesla Stock TSLA Forecast Technical Analysis
09:18 Nvidia Stock NVDA Forecast Technical Analysis
11:58 Apple Stock AAPL Forecast Technical Analysis
13:45 Amazon Stock AMZN Forecast Technical Analysis
15:36 Google Stock GOOGL Forecast Technical Analysis
17:28 Microsoft Stock MSFT Forecast Technical Analysis
18:46 Meta Forecast Technical Analysis

AMAZON: Testing the 1D MA100. Will it hold?AMAZON is on the third straight day where it respects the 1D MA100. Holding this level translates into a rebound base as the long term pattern is a Channel Up. The 1D technical outlook hasn't been lower thought (RSI = 40.739, MACD = -0.760, ADX = 35.289) since December 28th 2022, so the slightest cross below, should extend the downfall under the Channel Up and towards the 1D MA200.
The Huge Buy Zone is inside the 0.382 - 0.5 Fibonacci range. Those will be the two buy entries and our target on the medium term is the R1 level (TP = 145.90).
## If you like our free content follow our profile to get more daily ideas. ##
## Comments and likes are greatly appreciated. ##

00:00 Economic Data, Rate Hike Data, Sentiment data, AAII Data 0Welcome to the daily how to make money online with stock market Mega Cap 7 Tech stock, Nvidia Microsoft Google Apple Amazon Meta Tesla Stock, Technical Analysis Show where I break down the price action and let you guys know what the most likely scenario I think will be going forward.
00:00 Economic Data, Rate Hike Data, Sentiment data, AAII Data
03:25 QQQ Forecast
08:43 Sp500 ETF analysis
10:10 Tesla Stock TSLA Forecast Technical Analysis
12:28 Nvidia Stock NVDA Forecast Technical Analysis
13:49 Apple Stock AAPL Forecast Technical Analysis
14:38 Amazon Stock AMZN Forecast Technical Analysis
16:02 Google Stock GOOGL Forecast Technical Analysis
17:16 Microsoft Stock MSFT Forecast Technical Analysis
18:28 Meta Forecast Technical Analysis

TSLA NVDA AAPL MSFT AMZN META GOOGL Price ForecastWelcome to the daily how to make money online with stock market Mega Cap 7 Tech stock, Nvidia Microsoft Google Apple Amazon Meta Tesla Stock, Technical Analysis Show where I break down the price action and let you guys know what the most likely scenario I think will be going forward.
00:00 QQQ Forecast
06:55 Sp500 ETF analysis
09:54 Tesla Stock TSLA Forecast Technical Analysis
11:21 Nvidia Stock NVDA Forecast Technical Analysis
13:45 Apple Stock AAPL Forecast Technical Analysis
14:45 Amazon Stock AMZN Forecast Technical Analysis
16:34 Google Stock GOOGL Forecast Technical Analysis
17:43 Microsoft Stock MSFT Forecast Technical Analysis
19:17 Meta Forecast Technical Analysis

AMZN, Decisive H-S-FORMATION, Setup For BROADER PULLBACKS!Hello,
Welcome to this analysis about AMZN and the 4-day timeframe perspectives. Since major stocks in the stock market such as PYPL or FB recently showed up with heavily increased volatility bearish pullbacks to the downside the advance-decline line of the whole averaged stock market is declining which means that a pullback in the other bigger market cap stocks such as AMZN is increasing the more other stocks follow these developments, this can also lead to increased volatility to the downside in which the whole market turns to the downside. Therefore it is necessary to do not keep this scenario from the desk and consider the technicals to rightly prepare and also possibly catch opportunities in this market environment. Therefore when looking at my chart, we can watch there how AMZN is now building this main head-shoulder-formation with the left shoulder and the head already completed. Now with forming the right shoulder, AMZN has a huge resistance within the main Upper-Resistance-Cluster which is marked in red in my chart, in this case, there is a high possibility given that from there on AMZN pulls back to the downside which will show the origin of final completion of the head-shoulder-formation. Once AMZN has completed the head-shoulder-formation bearishly below the neckline as seen in my chart this will activate lower target-zones shown in my chart at the 1980 level marked in black, once these levels have been reached it will be determining on if AMZN holds these levels or just sets up for a continuation. If AMZN breaks below these targets and into the Bearish-Continuation-Zone marked in red this will lead to a Wave-C-Extension down the line, in any case, it is necessary to keep the bearish perspectives in mind and be prepared on these dynamics.
In this manner, thank you for watching the analysis, all the best!
"There are many roads to prosperity, but one must be taken."
Information provided is only educational and should not be used to take action in the markets.

TSLA NVDA AAPL MSFT AMZN META GOOGL Price ForecastWelcome to the daily how to make money online with stock market Mega Cap 7 Tech stock, Nvidia Microsoft Google Apple Amazon Meta Tesla Stock, Technical Analysis Show where I break down the price action and let you guys know what the most likely scenario I think will be going forward.

Should You Buy AMZN Now??Technical Analysis:
- AMZN is still doing a WXY medium term correction in blue
- In the short term AMZN is finishing wave ((3)) in black of ((5)) waves to complete wave (X) in blue
- We expect that the correction will be finished at around
70 when wave ((II)) in black is also completed
- H1 and H4 right side is up
Technical Information:
- Don't buy AMZN now
- If you're either a swing or position trader, you can buy when the correction WXY is completed around 70

Watching AMZN break of 139.64 for continuationThe headline chart is a 15 min chart, but it's easier to see what's really happening on the 5 min chart where it broke a wedge downwards and remains to reject entry back into the trend:
I'll be watching for breakdown entry under 139.64 only if it retests it and confirms resistance. I would be looking for 138ish.
Already played NASDAQ:AMD for +20% today. Continued to +50% on strength.
Welcome to follow for more insights.
Of course, this move is cancelled if it breaks 139.98 and becomes support. Thanks for reading.

Head and Shoulders AMZN LONG $$$AMZN has recently demonstrated an uptrend until a sudden momentum change on 9/19. The current resistance level (neckline) is set at $145.05. With the beginning downtrend, the stock sets up a short position from the neckline to roughly $102. Following a reversal from support of the previous shoulder, a long position forms and AMZN exits the pattern.
MacD and SQZMOM are indicative of a trend reversal while RSI is indicative of an overbought condition.
In the broader market context, many major stocks have recently experienced significant corrections, followed by impressive rebounds, eventually reaching new 52-week highs. This pattern may serve as a template for what could happen with AMZN after this inverted head and shoulders formation.
Possible Long positions and Short positions look like this:
Remember to put your stop losses after the last low!

TSLA NVDA AAPL MSFT AMZN META GOOGL Price ForecastWelcome to the daily how to make money online with stock market Mega Cap 7 Tech stock, Nvidia Microsoft Google Apple Amazon Meta Tesla Stock, Technical Analysis Show where I break down the price action and let you guys know what the most likely scenario I think will be going forward.
- Stock Market QQQ & SPY in a neutral trend
- Stock market hourly trend will be our guide

AMZN: there's strong support here, but I'll wait for TL touchThis would likely be a daytrade or 1-2 day swing when this transpires anyway.
If I miss out on the reversal, it's better than entering too early.
One strategy is to enter slow, but that can be detrimental if you don't know what that means and if you don't have discipline.
Also there's a h/s on the 4hr candle-chart. So I'll wait.
Look at my AMZN short from yesterday. Paid well and hit targets. Puts are at least +100%.

part 2 QQQ & SPY & 7 Mega Cap Tech stockssupport and resistance guide QQQ & SPY & 7 Mega Cap Tech stocks

part 1 QQQ & SPY & 7 Mega Cap Tech stockssupport and resistance guide QQQ & SPY & 7 Mega Cap Tech stocks

#EASEMYTRIP 44.70 Buy Recommendation - Rachit SethiaEASEMYTRIP 44.70
NSE:EASEMYTRIP
TARGET 58
SL 38
RR >2
TF <6 Months
Return ~30%
Factors: BULLISH WEDGE BREAKOUT Trend Following Rising Volume with rising Prices. Flag pattern breakout. Pennant Pattern Breakout with Bullish Candle. Retest Successful. Higher Highs & Higher Lows. Broken above RESISTANCE levels Trading at SUPPORT levels Earnings are strong. Bullish Wedge Breakout Risk Return Ratio is healthy. And Rising from Double Bottom Pattern to Flag Pattern forming. If you like my work KINDLY LIKE SHARE & FOLLOW this page for free Stock Recommendations. With 💚 from Rachit Sethia

Pt 2. QQQ SPY & 7 Mega Cap Tech stocks Forecastsupport & resistance guide of QQQ SPY & 7 Mega Cap Tech stocks

Pt 1. QQQ SPY & 7 Mega Cap Tech stocks Forecastsupport & resistance guide of QQQ SPY & 7 Mega Cap Tech stocks

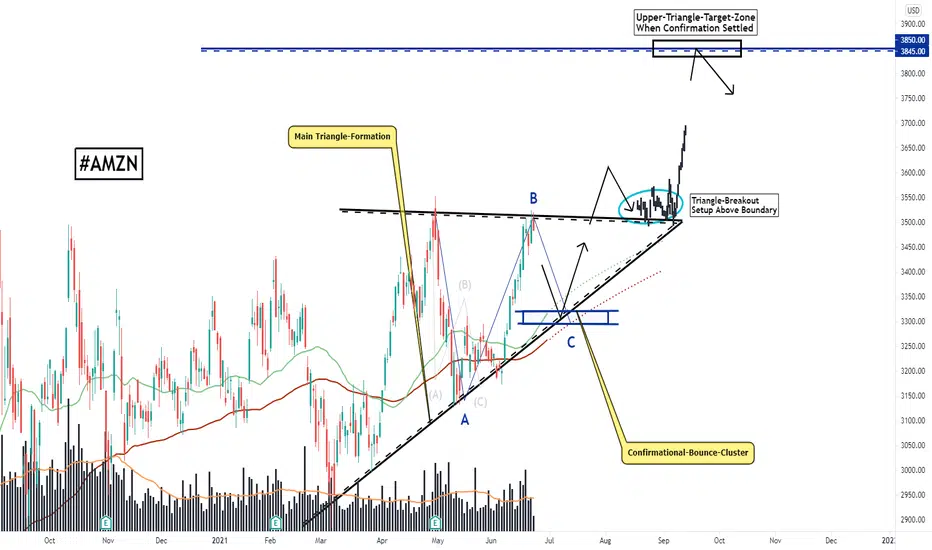
AMZN, Develops Main Ascending-Triangle, Bullish Breakout Ahead!Hello Traders Investors And Community,
Welcome to this analysis about AMZN, we are looking at the 12-hour timeframe perspectives. AMZN in recent times is in a very interesting constellation as it managed to hold its higher base-formation and is showing up with some bounces within. Besides that, I discovered this amazing ascending-triangle-formation within the structure marked with the black boundaries. Within this triangle-formation, AMZN has the coherent wave count and the waves A and B already completed. As AMZN now approaches the upper boundary of the triangle where still resistance is lying this is likely to be the origin of the wave C that will approach the confirmational-bounce-cluster from where a bounce can be expected. In this case, it is necessary that AMZN rightly holds this zone and does not falls below because this will invalidate the formation. When AMZN then manages to bounce in the structure and finally marks above the upper boundary it will be the proper confirmational breakout setup to activate upside targets mainly lies within the 3850 zones marked in blue. When AMZN reaches out to these targets it has to be elevated how it proceeds further and if there can come a continuation of bullishness right away or AMZN firstly settles for a pullback which is not unlikely in this case. For now, the upcoming bullish breakout should be expected, it will be an interesting development ahead of upcoming times.
In this manner, thank you everybody for watching, support the idea with a like and follow or comment, have a good day, and all the best!
"Trading effectively is about assessing possibilities, not certainties."
Information provided is only educational and should not be used to take action in the markets.
AMAZON Will Go Down! Sell!
Hello,Traders!
AMAZON is already making
A pullback from the horizontal
Resistance level of 146.31
And it is a strong level so I think
That we will see a further
Bearish correction to the downside
Sell!
Like, comment and subscribe to help us grow!
Check out other forecasts below too!

Amazon.com Inc. rally could just be getting started!Amazon.com Inc. (AMZN) presently approaching significant resistance, able to absorb weekly buying pressures.
Amazon.com Inc. (AMZN) is currently in a buy signal by one-degree from last week’s settlement above a key level.
Therefore, bullish continuation is expected.
A more cautious investor/trader may wait for a weekly settlement above the resistance levels just above (AMZN) current price.
Inversely, a weekly settlement below an elicited support level would lead to bearish momentum through the end of the year.

AMZN long position 50% moveOn the chart we can see a falling wedge.
We expect the price to break the downsloping resistance line,so when it's happen we could entry for long position.
After the breakout of the wedge we expect short consolidation in the green zone and after that an impulsive move to the upside.

