Can Two Paths of Wealth Lead to the Same Mountain of Impact?In an era where wealth accumulation often dominates financial headlines, Amazon's founding family presents a fascinating dichotomy that challenges our traditional understanding of success and impact. Jeff Bezos and MacKenzie Scott, once united in building one of the world's most valuable companies, now demonstrate how divergent approaches to wealth management can equally shape our future, albeit through distinctly different lenses.
The stark contrast becomes apparent in their recent financial movements: Bezos's methodical $5.1 billion stock sale through a carefully orchestrated 10b5-1 trading plan showcases traditional wealth management at its finest, maintaining significant control while diversifying assets. Meanwhile, Scott's bold $8 billion divestment for charitable causes, part of her larger $37 billion philanthropic initiative, revolutionizes the concept of billionaire responsibility. This juxtaposition raises intriguing questions about the multiple paths to creating lasting societal impact.
What emerges is a compelling narrative about the evolution of wealth stewardship in the 21st century. While Bezos continues to influence global markets and pioneer space exploration with his retained $213 billion in Amazon shares, Scott's approach of direct, unrestricted funding to over 2,300 nonprofit organizations challenges traditional philanthropic models. Their contrasting strategies suggest that perhaps the true measure of wealth lies not in its accumulation, but in its potential to effect change – whether through market innovation or direct societal intervention. This modern tale of two wealth philosophies invites us to reconsider our own definitions of success and impact in an age of unprecedented financial capability.
AMZN

AMAZON WILL GROW|LONG|
✅AMAZON is approaching a demand level of 200$
So according to our strategy
We will be looking for the signs of the reversal in the trend
To jump onto the bullish bandwagon just on time to get the best
Risk reward ratio for us
LONG🚀
✅Like and subscribe to never miss a new idea!✅

Stock Market TSLA NVDA AAPL AMZN META GOOG MSFT AnalysisNvidia Stock NVDA Forecast Technical Analysis
Apple Stock AAPL Forecast Technical Analysis
Microsoft Stock MSFT Forecast Technical Analysis
Google Stock GOOGL Forecast Technical Analysis
Amazon Stock AMZN Forecast Technical Analysis

AMAZON Local Long! Buy!
Hello,Traders!
AMAZON is about to retest
A horizontal support level
Around 200$ and after the
Retest we will be expecting
A local bullish rebound
Buy!
Like, comment and subscribe to help us grow!
Check out other forecasts below too!

AMAZON: Small pullback expected. Buy the dip.Amazon is trading inside a Channel Up on the 4H timeframe, supported by both the 4H MA50 and the 4H MA200 and almost overbought on its 1D technical outlook (RSI = 68.804, MACD = 6.500, ADX = 38.620). The 4H RSI is printing a sideways pattern which was a sell signal when the previous bullish waves peaked. The first pulled back to the 0.382 Fib, the second to the 0.5 Fib. Consequently we expect a quick pullback here but technically the dip should be bought on the 0.382 Fib. Our target after that will be near the top of the Channel (TP = 230.00).
See how our prior idea has worked out:
## If you like our free content follow our profile to get more daily ideas. ##
## Comments and likes are greatly appreciated. ##

AMAZON Minor pull-back and then off to $240.Amazon Inc. (AMZN) has been following our bullish signal within the Channel Up we indicated on August 23 (see chart below) very accurately and is halfway through to our $240.00 long-term Target:
This is also confirmed on the lower time-frames, namely the 1D on this chart, where the stock can be seen trading within a Channel Up and having started its most recent rebound on the 1D MA50 (blue trend-line).
The first Bullish Leg of the Channel Up, pulled-back to the 1D MA50 (and Fib 1.0) after approaching the 1.382 Fibonacci extension level and then rebounded aggressively to hit (and even break) the 2.0 Fibonacci extension. Even the 1D CCI sequences between the two fractals are quite similar.
As a result, we don't dismiss the possibility of a 1D MA50 pull-back but that will be another buy opportunity on Amazon's way to $240.00.
-------------------------------------------------------------------------------
** Please LIKE 👍, FOLLOW ✅, SHARE 🙌 and COMMENT ✍ if you enjoy this idea! Also share your ideas and charts in the comments section below! This is best way to keep it relevant, support us, keep the content here free and allow the idea to reach as many people as possible. **
-------------------------------------------------------------------------------
💸💸💸💸💸💸
👇 👇 👇 👇 👇 👇

Amazon Stock (AMZN) Holds Above $200Amazon Stock (AMZN) Holds Above $200
On Thursday, October 31, Amazon released its Q3 earnings report:
→ Earnings per share: actual = $1.43, forecast = $1.14;
→ Gross sales: actual = $158.8 billion, forecast = $157.2 billion.
The report exceeded analyst expectations, with additional optimism driven by Trump’s victory and a Fed rate cut, pushing Amazon’s stock price past the psychological $200 mark and reaching a new high above $210.
Today, Amazon’s stock chart shows the price beginning to round off (indicated by an arrow). Does this signal the end of the bullish trend?
Unlikely, given the strong fundamental support. In technical terms, it may be more accurate to consider the price’s vulnerability to a correction, especially as it sits near the upper boundary of an ascending channel.
Should a correction occur, a retest of the $200 level is possible. Support may come from the median line of the long-term blue channel or the lower boundary of the short-term black channel.
According to TipRanks, which surveyed 45 Wall Street analysts:
→ 44 analysts recommend buying AMZN stock;
→ On average, they forecast a 12-month price target of $238.
This article represents the opinion of the Companies operating under the FXOpen brand only. It is not to be construed as an offer, solicitation, or recommendation with respect to products and services provided by the Companies operating under the FXOpen brand, nor is it to be considered financial advice.

Amazon (AMZN) Long Side Analysis: Staying Bullish with CautionHey Again Folks!
Just wanted to share some thoughts on Amazon (AMZN) — I’m still leaning on the 🔵 long side here, but keeping a close eye on a few key levels.
Right now, AMZN is sitting around the $206-210 range, and it’s getting close to that resistance up at $213 🟢. This has been an important level before, so I’m watching to see if we can push through it with some strength 💪.
If we get a strong breakout above $213 🔥, I think the next target to watch is around $236 📈. That area lines up with previous highs and could be the next stop if this momentum keeps up. But if we hit resistance and start pulling back, I’ll be watching the lower boundary of the channel and especially the $190 zone for support 🛠️.

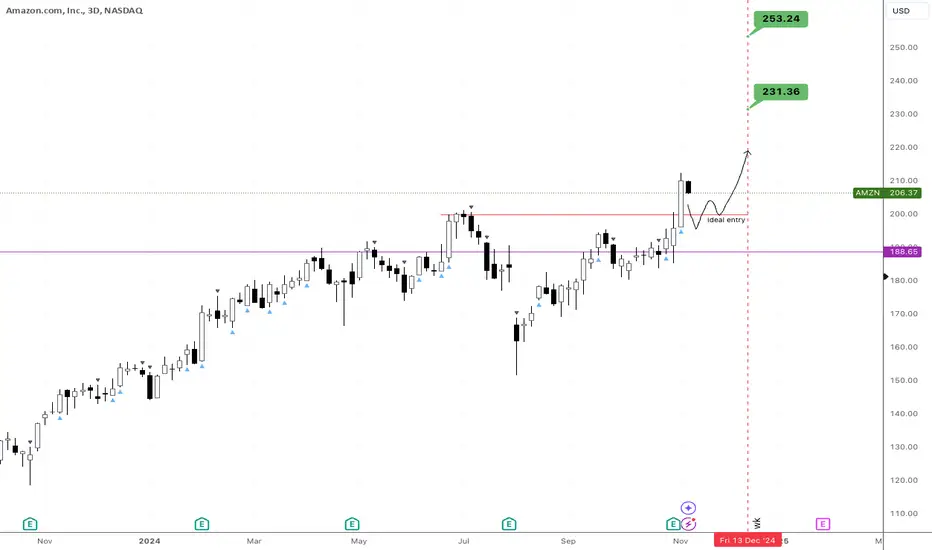
Prime'd for Profits: Amazon at Price DiscoveryNASDAQ:AMZN is currently trading at price discovery. Last weekly candle closed with lots of strength above precious all time high. Any retrace is a chance to jump in and increase our positions.
Bullish time at mode trend has just been confirmed.
- Expiry is set for mid December
- Targets of $231 and $253's at first .
- Entry dca at low $200’s to $180's
Stock Market TSLA NVDA AAPL AMZN META GOOG MSFT AnalysisNvidia Stock NVDA Forecast Technical Analysis
Apple Stock AAPL Forecast Technical Analysis
Microsoft Stock MSFT Forecast Technical Analysis
Google Stock GOOGL Forecast Technical Analysis
Amazon Stock AMZN Forecast Technical Analysis

Break and retest of ATH's for AMZN?🔉Sound on!🔉
Thank you as always for watching my videos. I hope that you learned something very educational! Please feel free to like, share, and comment on this post. Remember only risk what you are willing to lose. Trading is very risky but it can change your life!

Amazon: Significant Breakout!The resistance at $189.76 has recently been a major hurdle for the AMZN stock. Since April, the price has essentially been moving sideways along this level, with each breakout attempt being sold off. As envisioned by our primary wave count, the stock has now managed a breakout above $189.76, developing a first impulsive move toward a new all-time high. We expect a more substantial correction only after the larger beige wave III has found its top at a higher level. An earlier sell-off remains possible as part of our 30% likely alternative scenario: this alternative count suggests that the recent peak was the top of the beige alt. b wave, which would lead to a pullback below $145.86 and a fresh low of the overarching blue wave alt. (IV).

$AMZN IS ABOUT TO EXPLODE! BUY NOW OR FOMO LATERNASDAQ:AMZN
💥 NASDAQ:AMZN IS ABOUT TO EXPLODE! 💥
I first called out NASDAQ:AMZN on October 21st as it was setting up for a huge move and CupnHandle breakout. Here's 3 reasons to not miss this investing or trading opportunity. Price targets at the end.
1.) HIGH FIVE SETUP (Check the numbers below and you will see. 1-Breaking out of cupnhandle & symmetrical triangle pattern. 2-Volume profile gap from a volume shelf. 3-Uptrending MACD. 4-Higher Highs on RSI. 5-Uptrending Stoch. (trend).
2.) #Amazon margins and FCF are growing rapidly and will continue this uptrend heading into the holiday season with a RESILIENT AMERICAN CONSUMER.
3.) It's a BUY according to the fundamentals especially when valuing this company according to it's Discounted Cash Flow (DCF).
Intrinsic Value: $250
🎯PT1: $231 (Symmetrical triangle measured move)
🎯PT2: $310 (Multi-year CupnHandle Measure Move)
Are you a shareholder? or Are you trading this name?
I'm done for the day! Going to be with my wife on her birthday and go trick or treating with my boys. Thanks for all the support, much love!
LIKE l FOLLOW l SHARE
HAPPY HALLOWEEN!
#Earnings
NFA

Amazon (AMZN): Approaching critical resistance!Amazon continues its impressive rise, moving out of our initial sharp Wave (2) scenario. Despite the bullish momentum fueled by last Thursday’s earnings report, we remain cautious and are still leaning towards a potential larger pullback. The company showed strong performance in key segments, with CEO Andy Jassy’s strategic focus on expenditure and cost-cutting delivering an 11% revenue increase to $158.9 billion, surpassing analysts’ expectations.
Now, Amazon has reached our second key turnaround zone, between $201 and $220. A move higher would invalidate our bearish outlook, but until then, we are preparing for a potential pullback and targeting lower entry points to capitalize on future upward swings. The stock has recently posted a nearly perfect equal high, alongside a bearish divergence, which could signal an upcoming correction.
The looming U.S. elections could inject significant volatility into Amazon’s price action, with potential wicks forming in either direction. While a move up to $220 would still be considered valid within this structure, we are closely monitoring these levels. As always, we will update you once the bearish scenario is confirmed or invalidated.

Amazon’s Next BIG Move: Can It Bounce to $207 from Key Support?If Amazon holds strong at $194.31, it could be setting up for a run to $207.30. This level is both a potential target and a great take-profit zone if the bounce holds. Let’s break down what to watch for as this setup unfolds!"
Trade Setup Details:
Support Level at $194.31
Right now, $194.31 is acting as a solid foundation. If Amazon finds buyer interest here, it could kick off a new upward move.
Target Zone: $207.30
If the support holds, $207.30 is the next target. This level is likely to see some selling pressure, making it an ideal area for profit-taking on a successful bounce.
Beginner Tip
Keep an eye on how Amazon reacts around $194.31. Look for strong buying signals (like a bullish candle) before entering, and consider setting your take-profit level around $207.30 to capture gains if the bounce holds.
Happy Trading
Kris/ Mindbloome Trading
Mindbloome Exchange

AMAZON | AMZN , Jeff is back? While Jeff Bezos, fiancée Lauren Sánchez have star studded engagement party on his $500M yacht Amazon has just reported its Q2 2023 earnings result, EPS of 65 cents is not comparable on YoY basis nor to consensus due to the company booking some gains related to its Rivian Automotive, Inc (RIVN) investment. Revenue of $134.3 billion beat consensus by about 2% while showing a YoY jump by nearly 11%. As an immediate reaction, the stock is up nearly 8% after-hours, although this can turn on a dime.I wrote in my preview that Amazon still remains a revenue story and to pay attention to Q2's actual revenue and Q3's revenue guidance. Amazon hit it out of the park on both counts, with Q2 revenue showing an 11% jump and Q3 guidance of $138 billion to $143 billion, easily upping the consensus of $138.29 billion.
As a direct effect of the company reining in on its expenses, Amazon's Free Cash Flow ("FCF") in Q2 2023 improved to almost $8 billon compared to -$23.5 billion in Q2 2022. Headcount is now down 4% YoY.Advertising, which I've highlighted as the next growth driver in many of my past articles, was up 22% YoY. But, more importantly, resumed its upward trajectory on a quarterly basis. Advertising services revenue showed continuous QoQ improvement until the first blip in Q1 2023. Whether Q2's upsurge is a new trend remains to be seen, but it is encouraging that Q2 did not follow Q1 down. I am also glad that my prediction that advertising will cross $10 billion in sales came true.It appears like retail has finally stopped bleeding profusely to avoid wasting all the gains from AWS and Advertising. In my view, retail is just their medium to sell their ecosystem, and this is acceptable to me.
Heading into earnings, Amazon stock was almost into the oversold territory with a Relative Strength Index ("RSI") of 37. Revenue beat and guidance should help the stock garner more analyst support in the upcoming days, and I fully expect the stock's almost-oversold conditions to be in the stock's favor as it has plenty of room upwards technically. The after-hours move has also helped the stock clear all of the commonly used moving averages.AWS's revenue and operating income appeared to be on a perennial, mid-double-digit growth trajectory until recently. However, Q2 saw AWS' sales increase by "just" 12% while operating income fell by more than 5%. It is in this context that advertising services becomes even more important. While $22 billion is strong, it fell well short of the $25 billion I predicted, as the company aims to cross $100 billion in 2023 AWS revenue.
The stock was already up 50% YTD heading into earnings and the run appears set to continue. I am not complaining as a long, but it shouldn't surprise anyone to see the stock pullback from the highs given the market's shaky behavior the last few days.
Overall, Q2 results are much better than Q1, and that shows in the stock's performance, at least as shown in the after-hours price movement. However, Amazon has never been a single quarter or single year story for me. Amazon's ecosystem is enough reason for me to continue believing in the company long-term. The ability to leverage multiple products and services across the entire organization is not something any company can build overnight. In fact, even Amazon has taken nearly 30 years to be the company that it is today

Stock Market TSLA NVDA AAPL AMZN META GOOG MSFT AnalysisNvidia Stock NVDA Forecast Technical Analysis
Apple Stock AAPL Forecast Technical Analysis

Be careful with Amazon !!!In my opinion, the shares of this company should be 1.5% lower than the current price, which means at $186.5 .
So, any correction in the shares of tech giants is an opportunity for investment entry....
✨We spend hours finding potential opportunities and writing useful ideas, we would be happy if you support us.
Best regards CobraVanguard.💚
_ _ _ _ __ _ _ _ _ _ _ _ _ _ _ _ _ _ _ _ _ _ _ _ _ _ _ _ _ _ _ _
✅Thank you, and for more ideas, hit ❤️Like❤️ and 🌟Follow🌟!
⚠️Things can change...
The markets are always changing and even with all these signals, the market changes tend to be strong and fast!!

Amazon is up over $140BAmazon is up over $140B overnight. For perspective, that's the entire market-cap of $SCHW. Also more than the entire value of $NKE. Amazon represents 22% of entire Consumer Discretionary Index. It's 5% of NASDAQ:QQQ and newest member of the DJ Industrial Avg

AMZN 50%+ UPSIDE!!! CUP N HANDLE PATTERN! BREAKDOWN BELOW:NASDAQ:AMZN #Earnings #BlackFriday
I PRESENT TO YOU: 🎁
🔜 THE NEXT 3T MKT CAP COMPANY
Behold the beautiful CUP 🍵& Handle 👌#chartpatterns #trading #tradingstrategy #Stock
This tea is going to taste delicious when we finally break over $201.20. NASDAQ:AMZN has been a laggard and it's time for them to play a little catch up! 🧧
Not much explaining needed with this one...Cup n Handle breakout means we are going to the measured move destination of...🥁🥁🥁....$310.69 ‼️‼️‼️
CATALYST: 😼
✔️Continued AWS growth and dominance!
✔️Stellar holiday quarter (best quarter of ea. year)
✔️MONEY PRINTER (ATH Free Cash Flows (FCF)
✔️Better margins and #3 player in Ad space!
NASDAQ:AMZN is a 17% in my LT portfolio. Also, I have several options plays on this name. Gonna be a fun ride! 🎢
Like and follow for more great charting and stock talk!
Not financial advice 🖖 NASDAQ:QQQ AMEX:SPY AMEX:IWM NASDAQ:BIVI

Amazon.comHello community,
A little analysis of Amazon stock.
We must watch the break of the trend line.
The movement is bullish, the 200-period simple average is bullish.
The 3 green zones on the chart indicate the accumulation zones.
The end-of-year holidays should be beneficial for the stock.
Make your opinion, before placing an order.
► Thank you for boosting, commenting, subscribing!

AMZN Amazon Options Ahead of EarningsIf you haven`t bought AMAZN before the previous earnings:
Now analyzing the options chain and the chart patterns of AMZN Amazon prior to the earnings report this week,
I would consider purchasing the 190usd strike price Puts with
an expiration date of 2025-1-17,
for a premium of approximately $11.65.
If these options prove to be profitable prior to the earnings release, I would sell at least half of them.

Stock Market TSLA NVDA AAPL AMZN META GOOG MSFT AnalysisQQQ Forecast
Sp500 ETF analysis
Nvidia Stock NVDA Forecast Technical Analysis
Apple Stock AAPL Forecast Technical Analysis
Microsoft Stock MSFT Forecast Technical Analysis
Amazon Stock AMZN Forecast Technical Analysis
Meta Forecast Technical Analysis
Tesla Stock TSLA Forecast Technical Analysis
