AMZN Earnings Play — July 30 (AMC)
## 🚀 AMZN Earnings Play — July 30 (AMC)
**💵 High Conviction Call Trade | 85% Confidence**
📈 **Amazon (AMZN)** — Cloud + Consumer Power Combo
🧠 Setup driven by earnings momentum, bullish flow, and macro strength.
---
### 🔍 FUNDAMENTALS SNAPSHOT
✅ **Revenue Growth**: +8.6% TTM
✅ **Margins**: Profit 10.1%, Op 11.8%, Gross 49.2%
🎯 **EPS Beat Streak**: 8/8 with avg. surprise of +34.7%
🔮 **Consensus Target**: \$252.03 (+9.4% upside)
📌 AWS + AI + Cost control = 🔥 upside setup
🟢 **Score: 9/10**
---
### 📊 OPTIONS FLOW SIGNAL
💰 **High OI**: \$232.50, \$240, \$247.50 calls
📈 **Call/Put Ratio**: Bullish Skew
🛡️ **Put Hedging** ≠ Bearishness
📉 Expected Move: \~5%
⚖️ **Gamma Bias**: Bullish above \$240
🟢 **Score: 8/10**
---
### 📉 TECHNICAL SETUP
📍 Price: \$231.01
📈 20D MA: \$226.21 (Support)
📉 RSI: 66.71 (momentum building)
🔒 Resistance: \$242.52 (watch for breakout)
🟢 **Score: 8/10**
---
### 🌐 MACRO TAILWINDS
🧠 AI & Cloud Momentum 🚀
💹 Consumer spending rebound
🔧 Regulatory risk mitigated via diversification
🟢 **Score: 8/10**
---
## 🎯 TRADE IDEA
🟩 **AMZN 08/01 \$247.50 Call**
💸 Entry: \$0.86
🎯 Target: \$2.58 (200%)
🛑 Stop: \$0.43 (50% loss)
⏰ Entry: **July 30 — Pre-close**
📏 Max Risk: \$86
💰 Max Reward: \$258
🧠 IV Crush Defense: Exit 2H post-ER
---
## ⚡️ WHY THIS WORKS
✅ 8-straight beat streak
✅ Fundamentals + Technicals = aligned
✅ Flow + Macro confirm direction
📈 Setup = asymmetrical upside
---
🎯 Tag your earnings sniper crew
📈 #AMZN #EarningsTrade #OptionsFlow #AmazonStock #CloudAI #OptionsStrategy #EarningsPlays #TradingView #SwingTrade #CallOptions #VolatilityTrade #EarningsMomentum
Amznlong

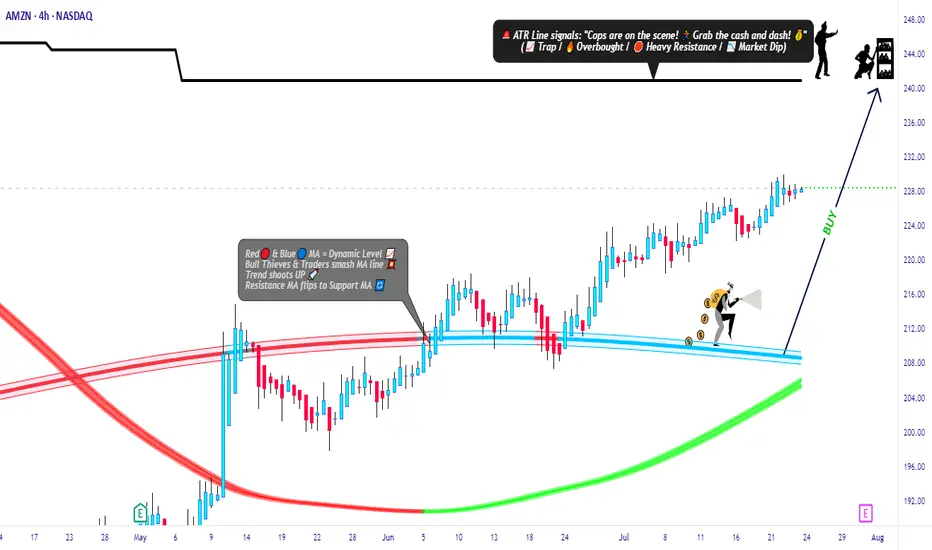
Amazon Market Robbery Blueprint – Swing/Scalp Long Setup🟨💣 “AMZN Market Heist Blueprint – Bullish Robbery in Progress 🚨💼💸” 💣🟨
By Thief Trader – Rob the Market with Precision
🌍 Hello World! Hi, Hola, Ola, Bonjour, Hallo, Marhaba!
🤑💰 Calling all Money Makers & Market Robbers – get ready to execute the next bullish heist on AMAZON.COM, INC (NASDAQ: AMZN), powered by our signature Thief Trading Style™ – where technical precision meets psychological warfare.
🔥 Plan Summary:
Based on our fundamental & technical intel, we’re eyeing a long entry into AMZN. The target? 💥The High-Risk ATR Police Barricade Zone – a zone flooded with liquidity, overbought conditions, fakeouts, and bear traps. It's where most traders get caught – but we walk in with a blueprint.
🟩 Entry Zone – “The Vault Is Wide Open!” 💼📈
🕰 Entry timeframe: 15min / 30min (preferably after confirmation or rejection wick)
💵 Buy Limit Orders: Place multiple layered entries (DCA-style) near recent swing lows/highs. Wait for breakout confirmation; no blind orders before breakout!
Thief Note: This isn’t spray-and-pray – this is sniper-mode. Scope, place, execute.🎯
🛑 Stop Loss – “SL is the Escape Route!”
📍 SL below recent 4H candle wick swing low (around 219.00 – adjust based on your risk/margin size).
Important: Only place SL after breakout; not before. Risk per order must match your lot strategy.
🎯 Target – “Grab the Bag or Escape Before the Alarms!”
💸 Target Zone: 240.00
🧠 Smart robbers know when to bail early – use a trailing SL to lock gains. Exit before reversal or heavy volume shift.
👀 Scalper Alert – “Only One Way – LONG!”
If you’re a quick thief with a fat bag, hit-and-run with a Long scalp. If you’re running lean, swing with the crew. Watch the PA and news timing. Trailing SL = insurance policy.
📊 Why Bullish? Here’s the Background:
🔍 Macro Drivers
💼 COT Report
🌍 Geo-political Influences
🧠 Sentiment Score
📈 Index Correlation
🔮 Intermarket Signals
💹 Institutional Positioning
All lights flashing green for short-to-midterm bullishness, but keep checking real-time updates.
⚠️ Risk Alert – News Triggers Can Blow Your Cover 🚨
🗞 Avoid trading near major news releases – they cause volatility spikes.
🧲 Always protect gains with trailing stops and don’t over-leverage your ammo.
💖 Support the Robbery – Hit BOOST 🔥
Smash that 💥BOOST💥 button if you ride with the Thief Trading Crew!
Let’s build this into the #1 robbery squad on TradingView.
Make money. Protect profits. Trade like a bandit – with a plan. 💼📈🏆
🔔 Stay Tuned for the Next Robbery Mission 🔔
Another heist plan dropping soon. Until then, rob smart, rob safe, and rob rich.
– Thief Trader™ | Rob The Market. Not Your Wallet.
AmazonAmazon needs small correction and further push up towards 235 level.
Disclosure: We are part of Trade Nation's Influencer program and receive a monthly fee for using their TradingView charts in our analysis.
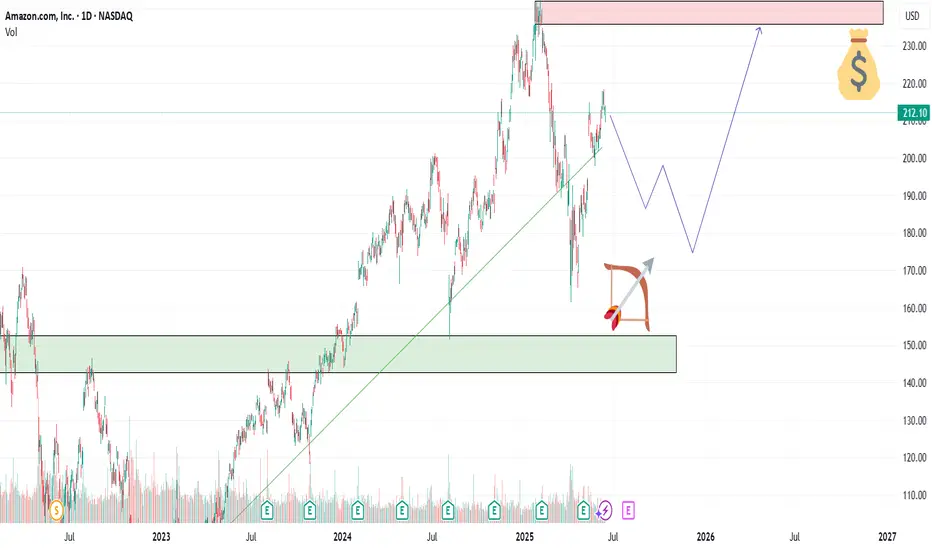
AMZN — Accumulation Zone or Just a Healthy Pullback?📦Amazon (AMZN) is offering an interesting opportunity after a healthy correction from its 2025 highs. With continued AWS expansion and aggressive investment in AI infrastructure, the fundamentals remain solid — but short-term volatility opens the door for strategic entries.
🎯 Entry Points
🔹 $194 – First key support, ideal for early buyers
🔹 $187 – Strong technical congestion zone
🔹 $169 – Deep value zone with higher risk/reward potential
💰 Profit Targets
✅ TP1: $210 – First resistance and psychological level
✅ TP2: $227 – Last swing high area
✅ TP3: $241+ – Full recovery path if momentum holds
🧠 Strategy Insight
This setup suits a swing trade horizon (30–60 days). Scaling into the position and adjusting stops under $160 offers a risk-managed approach. The upcoming earnings on July 31, 2025 could be the trigger for a major move — watch AWS growth numbers and forward guidance closely.
⚠️ Disclaimer: This analysis is for educational purposes only. It is not financial advice. Always do your own research and manage risk accordingly.
AMZN: A Power Move for the Smart Trader | The Rebound Play?🚀 AMZN 2025 Trade Plan
After an early 2025 rally to $240+, Amazon (AMZN) has pulled back sharply to around $167, opening the door to what could be one of the most attractive rebound setups of the year.
With AWS still growing strong and net income nearly doubling in 2024, the fundamentals are on Amazon’s side. Add to that bullish analyst outlooks pointing to $226–$253 this year, and we might just be looking at a golden entry zone.
📌 Entry Points:
Start building a position at $167
Add more if it dips toward $160 or $151 (52-week low)
🎯 Profit Targets for 2025:
First stop: $210
Next: $226
Final push? $240+
This setup blends technical recovery with strong financials and long-term bullish sentiment. Patience, discipline, and solid risk management are key as AMZN finds its footing.
⚠️ Disclaimer: This is not financial advice. All trading involves risk. Always do your own research and consult with a licensed financial advisor before investing.

AMAZONAmazon has a great potential to head up towards 230 level.
Disclosure: We are part of Trade Nation's Influencer program and receive a monthly fee for using their TradingView charts in our analysis.

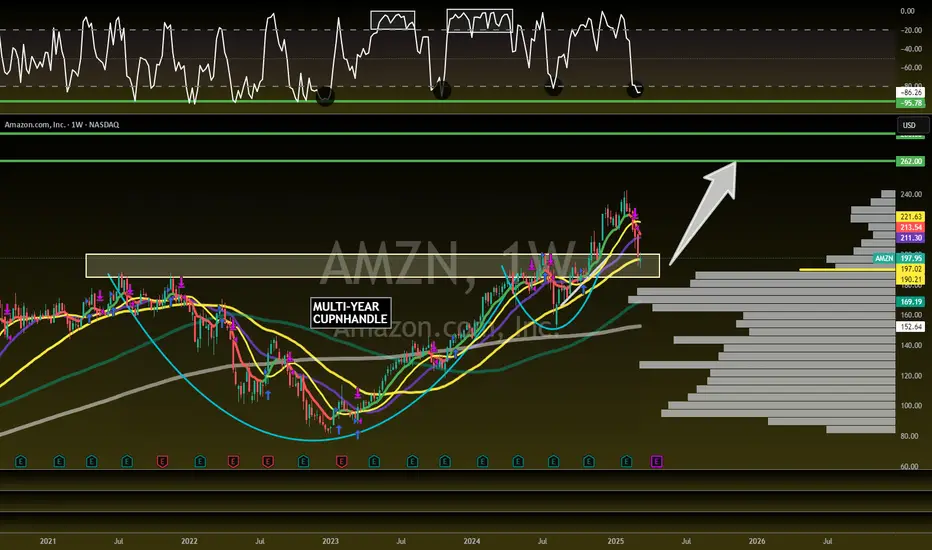
Amazon is the FULL PACKAGE! 62% UpsideNASDAQ:AMZN - H5_W Trade Setup: 🚨
Confirmed CupnHandle Retest =
🎯$262 🎯$280
📏MM: $310
- Multi-Year CupnHandle
- Massive weekly volume shelf
- Green Support Beam on Wr%
- Undervalued MOAT Company
Not financial advice

Amazon is about to DELIVER! 32% UpsideNASDAQ:AMZN
Great Risk/Reward here!
Confirmation of Retest = 🎯$262
- Right at CupnHandle Retest area
- Volume Shelf Support
- 50WMA
- Wr% Green Support Beam
Not financial advice
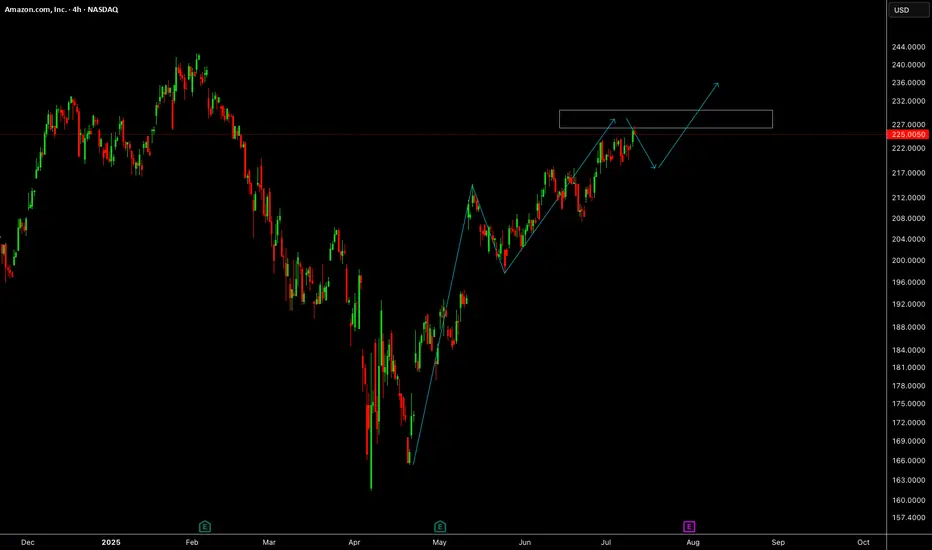
Amazon (AMZN) Stock Analysis & ForecastAmazon (AMZN) Stock Analysis & Forecast
The U.S. stock market has experienced a notable downturn recently, and Amazon (NASDAQ: AMZN) is no exception. Currently trading at $228, I am closely monitoring the stock for a potential pullback to $220, where I plan to enter.
Entry Strategy
My entry point of $220 is based on a confluence of key technical levels:
An ascending trendline indicating ongoing bullish momentum.
A horizontal support level, reinforcing this area as a strong demand zone.
Target & Exit Strategy
If fundamental catalysts align in my favor, my price target (TP) will be the all-time high (ATH) zone around $240, with the potential to extend beyond.
As always, risk management remains a priority—trade cautiously and adapt to market conditions.

amazon stock in the next dayswhere to get amazon stock with the best prices ???
will amazon stock go up in the next days?\
amazon is a great stock that we must have
you can get this stock and see the stop we must have and get in our stock

Amazon (NASDAQ:$AMZN) Slides 4% Amidst Cloud Growth SlowdownAmazon (NASDAQ: AMZN) shares slid nearly 4% in pre-market trading on Friday, as investors reacted to a slowdown in the company's cloud growth and a subdued sales forecast for the current quarter. The dip comes despite strong performance in Amazon's retail segment and a broader technical breakout that suggests the stock may be poised for a significant upward move in the coming months. Let’s dive into the technical and fundamental factors driving Amazon’s current market dynamics and why this dip could be a buying opportunity for long-term investors.
Cloud Growth Slowdown Weighs on Sentiment
Amazon Web Services (AWS), the company’s cloud computing division and a key profit driver, reported a 19% year-over-year revenue increase to $28.79 billion for the quarter. While this growth is impressive, it fell slightly short of analyst expectations of $28.87 billion, according to LSEG data. This miss has raised concerns about the competitive pressures AWS faces from rivals like Microsoft Azure and Google Cloud, as well as emerging low-cost competitors such as China’s DeepSeek.
Technical Outlook
From a technical perspective, Amazon’s stock chart tells an intriguing story. As of Friday’s pre-market trading, AMZN was down 2.78%, but the stock recently broke out of a falling trend channel, signaling a potential reversal of its previous downtrend. While the stock has yet to capitalize on this breakout, the current dip could be interpreted as a "shakeout" before a significant upward move.
Key technical indicators support this bullish thesis:
- Relative Strength Index (RSI): The RSI remains strong at 60, indicating that the stock is neither overbought nor oversold and has room to climb.
- Moving Averages: AMZN is trading well above its 50-day, 100-day, and 200-day moving averages, a sign of strong underlying momentum and bullish sentiment.
This technical setup suggests that the pre-market dip may be a temporary pullback rather than the start of a sustained downtrend. For traders and investors, this could present an attractive entry point.
Strong Revenue and Earnings Growth
Amazon’s financial performance in 2024 has been impressive, with revenue reaching $637.96 billion, a 10.99% increase compared to the previous year’s $574.79 billion. Earnings surged by 94.73% to $59.25 billion, reflecting the company’s ability to scale profitability even as it invests heavily in growth areas like AI and cloud infrastructure.
The company’s 12-month forward price-to-earnings (P/E) ratio of 37.3 is higher than peers like Alphabet (22.7) and Microsoft (30.1), but this premium is justified given Amazon’s diversified business model, dominant market position, and long-term growth potential.
Analyst Sentiment: Strong Buy Rating
Wall Street remains overwhelmingly bullish on Amazon. According to 43 analysts, the average rating for AMZN stock is a "Strong Buy," with a 12-month price target of $254.3, representing a 6.48% upside from the latest price. At least seven brokerages raised their price targets following the earnings report, bringing the median target to $260.
Analysts are optimistic about Amazon’s ability to navigate near-term challenges and capitalize on long-term growth opportunities in AI, cloud computing, and e-commerce. The company’s heavy investments in AI infrastructure, while weighing on margins in the short term, are expected to pay off handsomely in the coming years.

AMAZON - Next day delivery of GAINS!NASDAQ:AMZN 📦
🔹Green H5 Indicator
🔹9ema Bullish Cross
🔹Bull Flag
🔹Bullish Wr%
🔹Volume Shelf Launch
🎯$233🎯$243 before March! ⏲️
Not financial advice

Amazon’s Stock Stuck in a Downhill Slope or Ready to Escape ?Amazon's stock price movement on a 4-hour timeframe, presenting a descending channel pattern. This pattern is often associated with bearish sentiment, as it reflects a market structure characterized by lower highs and lower lows, signaling a consistent effort by sellers to dominate price action.
Currently, the price is trading near the upper boundary of the channel, which acts as a dynamic resistance level. Historically, such resistance zones within descending channels tend to attract selling pressure, reinforcing the bearish outlook. If the price fails to break above this resistance and shows rejection signs (e.g., long wicks or bearish candlesticks), it could confirm a continuation of the downtrend, targeting the lower boundary of the channel as the next support level.
It is crucial to monitor this resistance area closely, as a breakout above the channel could shift the sentiment from bearish to bullish. For such a breakout to be credible, it must be accompanied by strong volume and decisive candlestick patterns, such as a bullish engulfing or a breakout gap. In that scenario, the price could invalidate the descending channel and initiate a reversal, targeting higher resistance levels.
Additionally, the broader market context and fundamental factors should be considered. If the stock is supported by positive catalysts or market sentiment, it could strengthen the likelihood of a breakout. Conversely, weak sentiment or negative news could intensify the bearish momentum, leading to further downside.
The chart currently reflects a bearish bias due to the descending channel structure. However, the key to determining the next move lies in the price action and volume near the upper resistance line, which will decide whether the pattern continues or reverses.

Amazon: Ready to Explode in 2025! 40% UPSIDECHARTURDAY - NASDAQ:AMZN Ready to Explode in 2025!
A great fundamental and technical setup for 2025!
-Multi-year CupnHandle with successful retest and we haven't realized the measured move yet
-Green H5 indicator
-Volume shelf w/ free space
-Williams CB is thriving
Pulled back to 9ema and previous resistance to flip into support and bounced.
🎯$231🎯$280 🎯$310
Not financial advice

Amazon - The +150% All Time High Breakout!Amazon ( NASDAQ:AMZN ) is hugging the previous all time high:
Click chart above to see the detailed analysis👆🏻
Amazon has been moving sideways for almost four years, consolidating between support and the previous all time high. After retesting the resistance over and over again, it is just a matter of time until Amazon will break the previous all time high and start its next major bullish cycle.
Levels to watch: $190, $500
Keep your long term vision,
Philip (BasicTrading)

AMZN at an all-time high: To be continued?AMZN reaches a new all-time high of $225.8, positioning itself at the upper boundary of an ascending channel that began on January 6, 2023, when it hit a low of $83.07. This channel, nearing its two-year milestone, has developed in five waves, as outlined by the Elliott Wave Theory:
Wave 1
Period: January 4, 2023 - September 14, 2023
Movement: $81.43 to $145.86 (+79%)
Wave 2
Period: September 14, 2023 - October 26, 2023
Movement: $145.86 to $118.35 (-19%)
Wave 3
Period: October 26, 2023 - July 8, 2024
Movement: $118.35 to $201.20 (+70%)
Wave 4
Period: July 8, 2024 - August 5, 2024
Movement: $201.20 to $151.61 (-25%)
Wave 5 (in progress)
Estimated period: August 5, 2024, to today
Projected movement: $151.61 to a range of $226.00 - $231.85 (+49% to +53% projected)
Key Questions for Caution on AMZN
Will it surpass the channel's upper boundary, setting new all-time highs?
Will it retrace to a dynamic support level within the channel (ranging between $201 and $195)?
Will it break below the ascending channel, signaling the start of a higher-degree correction?
Our opinion is for educational purposes only and should not be considered a recommendation to buy or sell. Before making any investment, consult with your financial advisor.

BEZOS AND EX-BEZOS ARE GIVING YOU A EARLY GIFT ON AMAZON!BEZOS AND EX-BEZOS ARE GIVING YOU A EARLY GIFT ON AMAZON! NASDAQ:AMZN
- HIGHFIVESETUP still intact
- Creating Support on Wr%
- Retesting Ascending triangle and CupnHandle breakout
- Measure move on both is to $300+
- Cheap on a DFCF model
Have you been buying more Amazon?
NFA

Amazon (AMZN) Long Side Analysis: Staying Bullish with CautionHey Again Folks!
Just wanted to share some thoughts on Amazon (AMZN) — I’m still leaning on the 🔵 long side here, but keeping a close eye on a few key levels.
Right now, AMZN is sitting around the $206-210 range, and it’s getting close to that resistance up at $213 🟢. This has been an important level before, so I’m watching to see if we can push through it with some strength 💪.
If we get a strong breakout above $213 🔥, I think the next target to watch is around $236 📈. That area lines up with previous highs and could be the next stop if this momentum keeps up. But if we hit resistance and start pulling back, I’ll be watching the lower boundary of the channel and especially the $190 zone for support 🛠️.

$AMZN IS ABOUT TO EXPLODE! BUY NOW OR FOMO LATERNASDAQ:AMZN
💥 NASDAQ:AMZN IS ABOUT TO EXPLODE! 💥
I first called out NASDAQ:AMZN on October 21st as it was setting up for a huge move and CupnHandle breakout. Here's 3 reasons to not miss this investing or trading opportunity. Price targets at the end.
1.) HIGH FIVE SETUP (Check the numbers below and you will see. 1-Breaking out of cupnhandle & symmetrical triangle pattern. 2-Volume profile gap from a volume shelf. 3-Uptrending MACD. 4-Higher Highs on RSI. 5-Uptrending Stoch. (trend).
2.) #Amazon margins and FCF are growing rapidly and will continue this uptrend heading into the holiday season with a RESILIENT AMERICAN CONSUMER.
3.) It's a BUY according to the fundamentals especially when valuing this company according to it's Discounted Cash Flow (DCF).
Intrinsic Value: $250
🎯PT1: $231 (Symmetrical triangle measured move)
🎯PT2: $310 (Multi-year CupnHandle Measure Move)
Are you a shareholder? or Are you trading this name?
I'm done for the day! Going to be with my wife on her birthday and go trick or treating with my boys. Thanks for all the support, much love!
LIKE l FOLLOW l SHARE
HAPPY HALLOWEEN!
#Earnings
NFA

AMAZON | AMZN , Jeff is back? While Jeff Bezos, fiancée Lauren Sánchez have star studded engagement party on his $500M yacht Amazon has just reported its Q2 2023 earnings result, EPS of 65 cents is not comparable on YoY basis nor to consensus due to the company booking some gains related to its Rivian Automotive, Inc (RIVN) investment. Revenue of $134.3 billion beat consensus by about 2% while showing a YoY jump by nearly 11%. As an immediate reaction, the stock is up nearly 8% after-hours, although this can turn on a dime.I wrote in my preview that Amazon still remains a revenue story and to pay attention to Q2's actual revenue and Q3's revenue guidance. Amazon hit it out of the park on both counts, with Q2 revenue showing an 11% jump and Q3 guidance of $138 billion to $143 billion, easily upping the consensus of $138.29 billion.
As a direct effect of the company reining in on its expenses, Amazon's Free Cash Flow ("FCF") in Q2 2023 improved to almost $8 billon compared to -$23.5 billion in Q2 2022. Headcount is now down 4% YoY.Advertising, which I've highlighted as the next growth driver in many of my past articles, was up 22% YoY. But, more importantly, resumed its upward trajectory on a quarterly basis. Advertising services revenue showed continuous QoQ improvement until the first blip in Q1 2023. Whether Q2's upsurge is a new trend remains to be seen, but it is encouraging that Q2 did not follow Q1 down. I am also glad that my prediction that advertising will cross $10 billion in sales came true.It appears like retail has finally stopped bleeding profusely to avoid wasting all the gains from AWS and Advertising. In my view, retail is just their medium to sell their ecosystem, and this is acceptable to me.
Heading into earnings, Amazon stock was almost into the oversold territory with a Relative Strength Index ("RSI") of 37. Revenue beat and guidance should help the stock garner more analyst support in the upcoming days, and I fully expect the stock's almost-oversold conditions to be in the stock's favor as it has plenty of room upwards technically. The after-hours move has also helped the stock clear all of the commonly used moving averages.AWS's revenue and operating income appeared to be on a perennial, mid-double-digit growth trajectory until recently. However, Q2 saw AWS' sales increase by "just" 12% while operating income fell by more than 5%. It is in this context that advertising services becomes even more important. While $22 billion is strong, it fell well short of the $25 billion I predicted, as the company aims to cross $100 billion in 2023 AWS revenue.
The stock was already up 50% YTD heading into earnings and the run appears set to continue. I am not complaining as a long, but it shouldn't surprise anyone to see the stock pullback from the highs given the market's shaky behavior the last few days.
Overall, Q2 results are much better than Q1, and that shows in the stock's performance, at least as shown in the after-hours price movement. However, Amazon has never been a single quarter or single year story for me. Amazon's ecosystem is enough reason for me to continue believing in the company long-term. The ability to leverage multiple products and services across the entire organization is not something any company can build overnight. In fact, even Amazon has taken nearly 30 years to be the company that it is today

AMZN 50%+ UPSIDE!!! CUP N HANDLE PATTERN! BREAKDOWN BELOW:NASDAQ:AMZN #Earnings #BlackFriday
I PRESENT TO YOU: 🎁
🔜 THE NEXT 3T MKT CAP COMPANY
Behold the beautiful CUP 🍵& Handle 👌#chartpatterns #trading #tradingstrategy #Stock
This tea is going to taste delicious when we finally break over $201.20. NASDAQ:AMZN has been a laggard and it's time for them to play a little catch up! 🧧
Not much explaining needed with this one...Cup n Handle breakout means we are going to the measured move destination of...🥁🥁🥁....$310.69 ‼️‼️‼️
CATALYST: 😼
✔️Continued AWS growth and dominance!
✔️Stellar holiday quarter (best quarter of ea. year)
✔️MONEY PRINTER (ATH Free Cash Flows (FCF)
✔️Better margins and #3 player in Ad space!
NASDAQ:AMZN is a 17% in my LT portfolio. Also, I have several options plays on this name. Gonna be a fun ride! 🎢
Like and follow for more great charting and stock talk!
Not financial advice 🖖 NASDAQ:QQQ AMEX:SPY AMEX:IWM NASDAQ:BIVI

$AMZN, Bullish Towards $195Hey ya'll,
The chart above highlights Amazon ( NASDAQ:AMZN ) on the daily timeframe.
I've added #thestrat indicator, MACD, and RSI indicators.
I've marked the Fibonacci price points from low (Aug 28) to high (Sep 24).
Normally, I would've gotten in at the 0.618 fib retracement ($179.02) or the 0.5 fib ($182.15) but I would still take a 3+ week out options contract.
If price goes above Fri, Oct 7th high of day (HOD) @ $187.60, but 1 strike out of the money.
If price opens below Fri, Oct 7th's HOD, wait for it to either reversal at the previous low of day (LOD) or at whatever point.
Entry: $187.61 (above prev daily high)
Target: $190.86 (Fri, Sep 27 open price)
SL: $185.13 (tight under 0.382 fib)
R:R = 1:1.32
MACD = curling up
RSI = curling up, low 50s
Potential Contracts:
$190c 11/15 @ $8.00 (ITM)
$185c 11/15 @ $10.55 (1 OTM)

AMZN may form a wedge on the daily chart.NASDAQ:AMZN reclaimed the daily 50 SMA last week and is trading into the August high supply. If it gets rejected in this area, a retest of the lower trendline would correspond to the daily 50 SMA, and other converging demand zones including the .618 retracement level from the all-time high to the August low. If demand is held in this area, it may be a good long entry point ahead of the wedge breakout. Alternatively, if price builds above the August high, it is likely to retest the all-time high.
