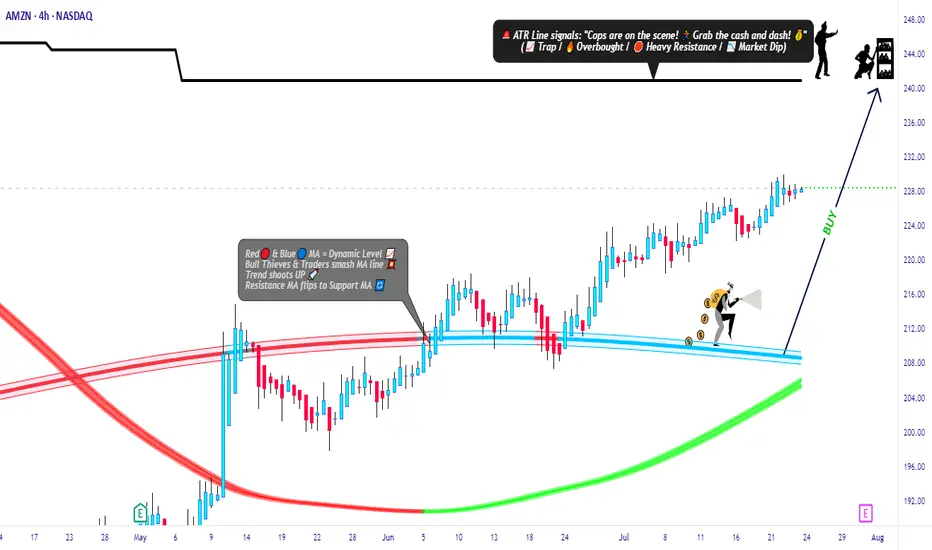
Amazon Market Robbery Blueprint – Swing/Scalp Long Setup🟨💣 “AMZN Market Heist Blueprint – Bullish Robbery in Progress 🚨💼💸” 💣🟨
By Thief Trader – Rob the Market with Precision
🌍 Hello World! Hi, Hola, Ola, Bonjour, Hallo, Marhaba!
🤑💰 Calling all Money Makers & Market Robbers – get ready to execute the next bullish heist on AMAZON.COM, INC (NASDAQ: AMZN), powered by our signature Thief Trading Style™ – where technical precision meets psychological warfare.
🔥 Plan Summary:
Based on our fundamental & technical intel, we’re eyeing a long entry into AMZN. The target? 💥The High-Risk ATR Police Barricade Zone – a zone flooded with liquidity, overbought conditions, fakeouts, and bear traps. It's where most traders get caught – but we walk in with a blueprint.
🟩 Entry Zone – “The Vault Is Wide Open!” 💼📈
🕰 Entry timeframe: 15min / 30min (preferably after confirmation or rejection wick)
💵 Buy Limit Orders: Place multiple layered entries (DCA-style) near recent swing lows/highs. Wait for breakout confirmation; no blind orders before breakout!
Thief Note: This isn’t spray-and-pray – this is sniper-mode. Scope, place, execute.🎯
🛑 Stop Loss – “SL is the Escape Route!”
📍 SL below recent 4H candle wick swing low (around 219.00 – adjust based on your risk/margin size).
Important: Only place SL after breakout; not before. Risk per order must match your lot strategy.
🎯 Target – “Grab the Bag or Escape Before the Alarms!”
💸 Target Zone: 240.00
🧠 Smart robbers know when to bail early – use a trailing SL to lock gains. Exit before reversal or heavy volume shift.
👀 Scalper Alert – “Only One Way – LONG!”
If you’re a quick thief with a fat bag, hit-and-run with a Long scalp. If you’re running lean, swing with the crew. Watch the PA and news timing. Trailing SL = insurance policy.
📊 Why Bullish? Here’s the Background:
🔍 Macro Drivers
💼 COT Report
🌍 Geo-political Influences
🧠 Sentiment Score
📈 Index Correlation
🔮 Intermarket Signals
💹 Institutional Positioning
All lights flashing green for short-to-midterm bullishness, but keep checking real-time updates.
⚠️ Risk Alert – News Triggers Can Blow Your Cover 🚨
🗞 Avoid trading near major news releases – they cause volatility spikes.
🧲 Always protect gains with trailing stops and don’t over-leverage your ammo.
💖 Support the Robbery – Hit BOOST 🔥
Smash that 💥BOOST💥 button if you ride with the Thief Trading Crew!
Let’s build this into the #1 robbery squad on TradingView.
Make money. Protect profits. Trade like a bandit – with a plan. 💼📈🏆
🔔 Stay Tuned for the Next Robbery Mission 🔔
Another heist plan dropping soon. Until then, rob smart, rob safe, and rob rich.
– Thief Trader™ | Rob The Market. Not Your Wallet.
Amznsetup
Shoulders to the Sky: Amazon’s Breakout Journey BeginsOverview
Name: Amazon.com, Inc
Ticker Symbol: AMZN
Exchange: NASDAQ
Founded: 1994
Headquarters: Seattle, Washington, USA
CEO: Andy Jassy (as of 2025)
Sector: Consumer Discretionary / E-commerce & Cloud Computing
About
Amazon is a global e-commerce and cloud services powerhouse. It dominates online retail while also operating AWS (Amazon Web Services), one of the world’s leading cloud computing platforms. Other segments include advertising, logistics, streaming, AI hardware (Alexa), and physical retail.
Fundamentals
Earnings: Amazon has consistently beaten revenue expectations with strong growth in AWS and advertising segments.Revenue: Q1 2025 revenue topped $154.8B, up 13% YoY, with solid margins.Outlook: Management has raised guidance for Q2 citing AI integration in AWS and retail efficiency gains.
Technicals
Inverted Head and Shoulders Pattern confirmed on the daily chart — a strong bullish reversal signal.
Price has broken above the neckline (~$213–$215) with volume confirmation.
Golden Cross forming on short-term MAs — bullish signal.
RSI is around 64, suggesting momentum remains but is nearing overbought.
MACD is bullish with widening divergence — supports potential continuation.
📌 Support Zones: $202, $199
📈 Resistance / Target Zones: $217 (short-term), $235 (TP), $242 (extension)
💡 My Take
AMZN is showing bullish continuation out of a textbook inverted head and shoulders — typically a strong reversal setup after a downtrend. We’ve seen the neckline break with follow-through, and volume patterns support the move.
While the RSI shows slight overbought conditions, this could lead to a short consolidation before another leg up toward $235–$242. With macro tailwinds from cloud and advertising sectors, AMZN is positioned well for a strong Q3 rally.
Position
Type: AMZN 235 Call
Expiry: July 11, 2025
Quantity: 7
Average Cost Basis: $1.00
Last Price: $0.69
Purchase Date: June 12, 2025
Total % Gain/Loss: –30%
Despite current drawdown, I remain optimistic about AMZN's momentum. The technical setup is strong, and short-term weakness is likely just healthy consolidation. I'm holding through July with my eyes on the $235 target.

AMZN LONG/SHORT SET UP(Amazon) If $160.00 holds we can see $200
if we break below$160.00 we could see $140-$120
LONG TRADE
Entry 1 $175.00
Entry 2 $165.00
Stop loss $155.00
Take profit 1- $195.00
(Close 33%)
Take profit 2- $215.00
(Close 66%)
Take profit 3-$230.00

AMZN Trade PlanLooking to buy AMZN at market price, with additional entries at 187 and 179 for better positioning.
🎯 Profit Target: 210 - 215
Stay disciplined, manage risk, and let the trade develop! 📈📊
⚠️ Disclaimer: This is not financial advice. Always do your own research and trade responsibly! 💡

Amazon’s Stock Stuck in a Downhill Slope or Ready to Escape ?Amazon's stock price movement on a 4-hour timeframe, presenting a descending channel pattern. This pattern is often associated with bearish sentiment, as it reflects a market structure characterized by lower highs and lower lows, signaling a consistent effort by sellers to dominate price action.
Currently, the price is trading near the upper boundary of the channel, which acts as a dynamic resistance level. Historically, such resistance zones within descending channels tend to attract selling pressure, reinforcing the bearish outlook. If the price fails to break above this resistance and shows rejection signs (e.g., long wicks or bearish candlesticks), it could confirm a continuation of the downtrend, targeting the lower boundary of the channel as the next support level.
It is crucial to monitor this resistance area closely, as a breakout above the channel could shift the sentiment from bearish to bullish. For such a breakout to be credible, it must be accompanied by strong volume and decisive candlestick patterns, such as a bullish engulfing or a breakout gap. In that scenario, the price could invalidate the descending channel and initiate a reversal, targeting higher resistance levels.
Additionally, the broader market context and fundamental factors should be considered. If the stock is supported by positive catalysts or market sentiment, it could strengthen the likelihood of a breakout. Conversely, weak sentiment or negative news could intensify the bearish momentum, leading to further downside.
The chart currently reflects a bearish bias due to the descending channel structure. However, the key to determining the next move lies in the price action and volume near the upper resistance line, which will decide whether the pattern continues or reverses.

AMZN: Are We Heading to $247 or Taking a Quick Dip First? Hey Mindbloome Family, here’s my take on Amazon (AMZN) right now:
1️⃣ If we break above $233, I think we’ll see a strong move up to $246–$247.
2️⃣ If we don’t break just yet, we could see a pullback to one of these levels first:
$225
$221
$215
From there, I’m still looking for a bounce back up to $246.
3️⃣ If we break below $215, that’s when we’ll need to pause and reassess the plan.
Wellness Tip: Don’t underestimate a good night’s sleep. Trading with a clear, rested mind makes all the difference—you’ll see the charts more clearly and make better decisions.
What’s your take—do we break through to $247, or are we dipping first? Let me know! If you want to chat more or dive deeper into this setup, check out my profile or send me a DM.
KRIS/MINDBLOOME EXCHANGE
TRADE WHAT YOU SEE

BEZOS AND EX-BEZOS ARE GIVING YOU A EARLY GIFT ON AMAZON!BEZOS AND EX-BEZOS ARE GIVING YOU A EARLY GIFT ON AMAZON! NASDAQ:AMZN
- HIGHFIVESETUP still intact
- Creating Support on Wr%
- Retesting Ascending triangle and CupnHandle breakout
- Measure move on both is to $300+
- Cheap on a DFCF model
Have you been buying more Amazon?
NFA

$AMZN IS ABOUT TO EXPLODE! BUY NOW OR FOMO LATERNASDAQ:AMZN
💥 NASDAQ:AMZN IS ABOUT TO EXPLODE! 💥
I first called out NASDAQ:AMZN on October 21st as it was setting up for a huge move and CupnHandle breakout. Here's 3 reasons to not miss this investing or trading opportunity. Price targets at the end.
1.) HIGH FIVE SETUP (Check the numbers below and you will see. 1-Breaking out of cupnhandle & symmetrical triangle pattern. 2-Volume profile gap from a volume shelf. 3-Uptrending MACD. 4-Higher Highs on RSI. 5-Uptrending Stoch. (trend).
2.) #Amazon margins and FCF are growing rapidly and will continue this uptrend heading into the holiday season with a RESILIENT AMERICAN CONSUMER.
3.) It's a BUY according to the fundamentals especially when valuing this company according to it's Discounted Cash Flow (DCF).
Intrinsic Value: $250
🎯PT1: $231 (Symmetrical triangle measured move)
🎯PT2: $310 (Multi-year CupnHandle Measure Move)
Are you a shareholder? or Are you trading this name?
I'm done for the day! Going to be with my wife on her birthday and go trick or treating with my boys. Thanks for all the support, much love!
LIKE l FOLLOW l SHARE
HAPPY HALLOWEEN!
#Earnings
NFA

Amazon’s Next BIG Move: Can It Bounce to $207 from Key Support?If Amazon holds strong at $194.31, it could be setting up for a run to $207.30. This level is both a potential target and a great take-profit zone if the bounce holds. Let’s break down what to watch for as this setup unfolds!"
Trade Setup Details:
Support Level at $194.31
Right now, $194.31 is acting as a solid foundation. If Amazon finds buyer interest here, it could kick off a new upward move.
Target Zone: $207.30
If the support holds, $207.30 is the next target. This level is likely to see some selling pressure, making it an ideal area for profit-taking on a successful bounce.
Beginner Tip
Keep an eye on how Amazon reacts around $194.31. Look for strong buying signals (like a bullish candle) before entering, and consider setting your take-profit level around $207.30 to capture gains if the bounce holds.
Happy Trading
Kris/ Mindbloome Trading
Mindbloome Exchange

AMZN 50%+ UPSIDE!!! CUP N HANDLE PATTERN! BREAKDOWN BELOW:NASDAQ:AMZN #Earnings #BlackFriday
I PRESENT TO YOU: 🎁
🔜 THE NEXT 3T MKT CAP COMPANY
Behold the beautiful CUP 🍵& Handle 👌#chartpatterns #trading #tradingstrategy #Stock
This tea is going to taste delicious when we finally break over $201.20. NASDAQ:AMZN has been a laggard and it's time for them to play a little catch up! 🧧
Not much explaining needed with this one...Cup n Handle breakout means we are going to the measured move destination of...🥁🥁🥁....$310.69 ‼️‼️‼️
CATALYST: 😼
✔️Continued AWS growth and dominance!
✔️Stellar holiday quarter (best quarter of ea. year)
✔️MONEY PRINTER (ATH Free Cash Flows (FCF)
✔️Better margins and #3 player in Ad space!
NASDAQ:AMZN is a 17% in my LT portfolio. Also, I have several options plays on this name. Gonna be a fun ride! 🎢
Like and follow for more great charting and stock talk!
Not financial advice 🖖 NASDAQ:QQQ AMEX:SPY AMEX:IWM NASDAQ:BIVI

Amazon - Why is there no resistance?NASDAQ:AMZN broke out of a long term consolidation phase and is starting a massive rally.
Every major consolidation is followed by a major breakout. And if the overall trend is bullish, a bullish breakout is more likely to happen. Last month Amazon finally broke above a multi year resistance level and is now heading back to the top of the rising channel formation. If we actually get a retest of the breakout level, you can then simply enter a long position.
Levels to watch: $180, $380
Keep your long term vision,
Philip - BasicTrading

Sharing AMZN chart from the TTR We are short as of high of the Sharing AMZN chart from the TTR
We are short as of high of the day
AMZN reports after the close
The price has re-tested the broken ending diagonal channel from below, a bearish signal by itself.
I will take one lotto put. Implied volatility for AMZN stock is about 8% in either direction

AMZN has topped - Apr 18 2024AMZN got a perfect weekly topping candle, followed by a bearish engulfing candle (one more day to confirm)
Watch for a dip below the 150 level.
Im going to short it very soon, will post it live when I do

🌟📈 AMZN: Amazon on Olympus's Peak!Traders, brace yourselves for an epic showdown with Amazon! 🌟📈
🔍 Critical Juncture:
We're witnessing a pivotal moment as Amazon stands at the summit of Olympus. The level at $188.11 has proven its mettle twice before. Will lightning strike thrice? The stakes have never been higher!
💡 Adventure in the Jungle:
Embark on a thrilling journey through the Amazonian jungle of trading! With a potential 27% journey to the first buy zone, are you ready for the wild ride ahead?
🔥 Join the Expedition:
Venture forth and share your thoughts on this daring expedition! Are you prepared to navigate the treacherous terrain of the market? The jungle drums are beating, and the adventure awaits!
💬 Your Quest Awaits:
What's your strategy for tackling this Amazonian challenge? Share your insights and embark on this exhilarating quest with fellow traders! The path to glory awaits those bold enough to seize it!
🎁 Discover the Treasure:
Remember, the most insightful comment could unlock a treasure trove of prizes! So don't hesitate—join the expedition and stake your claim to riches in the jungle of trading! 🏆💰

Good time to invest in AMZN stocksWeekly AMZN chart looks great, possibly a 55% upside in the next few months. I'll follow it for sure and a great time to invest and stock up on Amazon.

Amazon (AMZN) Technical Analysis and Trade Idea#AMZN has demonstrated a robust bullish trend, recently leaving a notable price gap between 167 and 162. Given the extended move, a retracement back into this gap appears likely as the market seeks equilibrium before March.
Potential Trade Setup:
- Entry: Consider a short position near the current range high.
- Stop Loss: Employ a stop loss 1.5x the Average True Range (ATR) on the daily (1D) timeframe.
- Rationale: This setup targets potential overextension and aligns with the anticipated price rebalancing.
Important Disclaimer:
This analysis reflects my personal market interpretation and does not constitute financial advice. Always conduct your own independent research and thorough risk assessment before making any trading decisions.

AMZN Potential INV HSIf AMZN is able to show enough strength to break and hold above 154.36 then she can see a follow through on the current bullish momentum.

Amazon -> Continuation TradeMy name is Philip, I am a German swing-trader with 4+ years of trading experience and I only focus on price action and market structure 🖥️
I am trading the higher timeframes because this allows me to massively capitalize on the major market swings and cycles without getting caught up in the short term noise.
This is how you build real long term wealth!
In today's anaylsis I want to take a look at the bigger picture on Amazon.
After the recent rejection away from the lower support trendline of the rising channel I do now expect a short term correction back to the $105 level. Then we could see an inverted head and shoulders pattern which indicates more upside potential and eventually new all time highs.
- - - - - - - - - - - - - - - - - - - -
When the market moves where, and how, and if - these are all unknown.
The only thing which you can control is your risk.
- Philip Basic Trading -
Keep the long term vision🫡

Amazon is an opportunity to buyHello traders. There is a great investment opportunity in Amazon shares. With a downtrend break. And break the ascending triangle pattern. Likewise, breaking the resistance at level 104. These are all factors confirming the strong entry of buyers into this giant stock .Note: If you like this analysis, please give your opinion on it. in the comments. I will be happy to share ideas. Like and click to get free content. Thank you

Should You Buy AMZN Now??Technical Analysis:
- AMZN is still doing a WXY medium term correction in blue
- In the short term AMZN is finishing wave ((3)) in black of ((5)) waves to complete wave (X) in blue
- We expect that the correction will be finished at around
70 when wave ((II)) in black is also completed
- H1 and H4 right side is up
Technical Information:
- Don't buy AMZN now
- If you're either a swing or position trader, you can buy when the correction WXY is completed around 70

Amazon Potential H & S Amazon - NASDAQ:AMZN
- Reaching into over bought levels
- A pull back from current levels would not surprise
- A pull back could form a head & shoulders pattern
- A break out above OBV would be ideal, should this
occur this week that will change the outlook.
Rejection from over bought levels and the OBV resistance line (which has consistently rejected price since 2020) seems probable.
On the flip side we have a bullish MACD cross on the monthly timeframe which could mean we just need a little more time to mount.
All of the above leans me towards the H&S idea, short term pull back and continuation.
If the H&S played out there would be a great opportunity to trade specific levels outlined with good actionable stop loss / low risk profile. At present there is a high risk of rejection. This is not guaranteed. Just more probable at present. I'll be observing for now....but I would love to get exposure but on my own terms with less risk.
PUKA

Amazon -> Finally BullishHello Traders,
welcome to this free and educational multi-timeframe technical analysis .
On the weekly timeframe you can see that Amazon stock is currently breaking above a major previous weekly structure area exactly at the $105 level which is now turned support.
You can also see that over the past months, Amazon has been creating a solid double bottom, weekly market structure and moving averages are also very bullish, so I am now just waiting for a retracement and then I do expect more continuation towards the upside.
On the daily timeframe you can see that with today's candle, Amazon stock is perfectly breaking above a major previous daily resistance area at the $112 level which is now turned support so I am now just waiting for a retest and then I am looking to get long on Amazon.
Thank you for watching and I will see you tomorrow!
You can also check out my previous analysis of this asset:

190 Target The AD is showing an Ascending Triangle, buy the dipsAMZN wants to retest the supply zone, and this is confirmed by the AD showing an Ascending Triangle pattern to $190, which Is spot on near the previous supply zone
