#Btc | #UsdtBitcoin is in a triangle on the 15-minute time frame and the price is breaking the support area of 28178~28279.
In case of failure of this support zone, the next support is 27312~27389.9
Currently, it is not logical to take a long position and you should wait for safer areas to take a long position
Analyse

#XAUUSD This pair #XAUUSD has reached to a strong weekly resistant zone and I think we have faced a downtrend for deeper prices...
In Daily uptrend also we need a correction wave!
All of that tell us a short time downtrend, is coming! 😉

ES Overnight Breakdown Continuation?Will ES continue to break down the main channel support? If we do not hold 4150, I believe we will see a much needed cool off and a main channel retest around ~4120.
I played a short overnight for 20 points for a measured move of yesterdays leg. I believe we will see a small bounce to retest the uptrend, then see continuation down to the main channel as we have lost a bit of steam.

#BTC | #Usdt#Btc | #Analyse | 1D | #NUM_A24
Bitcoin is in a bullish channel on the daily time frame
Currently, the midline of the support channel and a strong daily static resistance is located in the region of 32707~31245.
The daily momentum is upward and the trend is also upward
As we said in the previous analysis
If the price rises to the resistance areas that we specified in the chart, you can look for sales setups

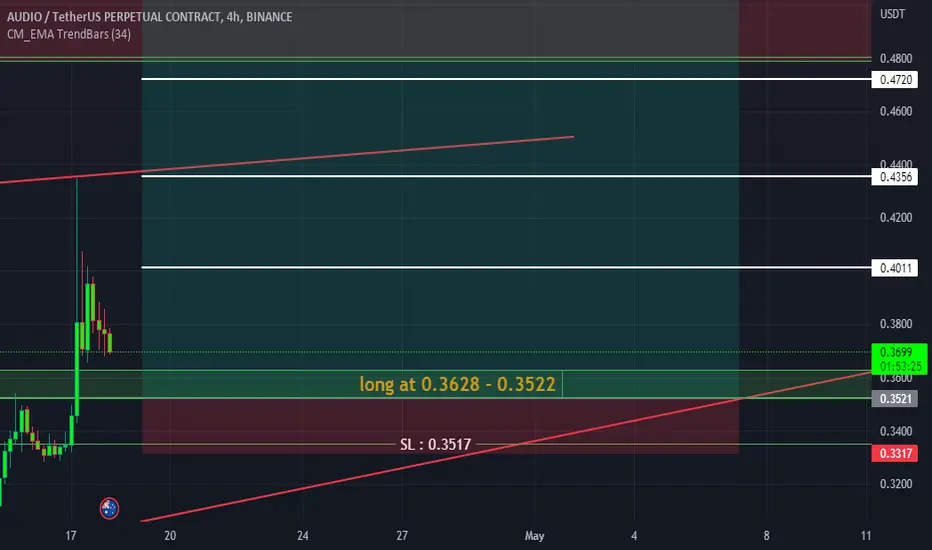
Audio breakout has confirmed now it will fill the gapAUDIO LONG
Hello Guys. Check out the Audio buying setup. Audio breakout is confirmed but we have a strong chance to catch a Almost 40% profit. it will defiantly fill the fear value gap and that point you will enter and sit in Rocket. it may take more than a week to achieve our last target but it will achieve for sure.
Entry: 0.3628 - 0.3522
Stop loss: 0.3517 (6.36% Loss)
Target 1: 0.4011 Spot (14.27% Profit) Future 20x Leverage (285.4% Profit)
Target 2: 0.4356 Spot (23.56% Profit) Future 20x Leverage (471.2% Profit)
Target 3: 0.4720 Spot (33.72% Profit) Future 20x Leverage (674.4% Profit)
Target 4: 0.5117 Spot (45.15% Profit) Future 20x Leverage (903% Profit)
This will make our week!
NIFTY ANALYSIS - 18/04/2023BUY ABOVE - 17740
SL - 17710
TARGETS - 17900,18000,18120
SELL BELOW - 17660
SL - 17700
TARGETS - 17600,17570,17500
Trade Safe & Happy Trading Guys
This is only for educational purpose so TAKE YOUR OWN RISK REWARD

BTC In the following weekIn order to reach higher numbers, we must move to the 24000 range and if we don't lose this range, move upwards.
stay with me

XAUUSD GOLD makes a small technical pullback. It may be directed to the upward support line, from which the growth will continue.

#Btc | #UsdtBitcoin has an upward momentum in the one-hour time frame
But the trend line is trying to go down
The liquidity of the market is low and you have to wait for the market maker to give direction to the market

Gold Bulls are Back on Monday Here We Analysis Gold D1 AND H4 ANALYST MARKT IN correction It retracw back to 2000.00 and make bullish Candle we Can buy till 2046 and last Monthly High was 2067
But keep in mind first we loking for weekly closing that is not good so wait for Monday opening Thanku

Nasdaq Next Movement ?The stock market faces a crucial test next week, which will help determine the Fed’s next policy move , bank crisis developments will also be in focus amid lingering fears over the health of US regional banks. My opinion Nasdaq will keep his bullish move

US30 WEEKLY OUTLOOKUS30 has made a successful REJECTION on KEY SUPPORT LEVEL which act as current RESISTANCE LEVEL
We look to take sell positions in the week ahead provided we get a closure bellow the current support level
Our trading room will be actively Trading this pair throughout the week ahead
Follow to stay up to date

BREAKDOWN ANALYSIS PETROL 17/03/2023dear traders petrol was rejected from wekkly support it may correct this move ana retest previous ressistance
follow my chart and respect the zone of range price
trade safe

Filecoin forecast #FilusdtIt seems that the price is moving towards the liquidity zone
It's hard to predict right now, but I expect such price movement in the coming hours
I will update the analysis when we reach that area

Is That The Gold Price Next Movement ?After the silicon valley collapse , dollar index goes down to 103$ levels , and the gold metal takes the high to 1914 and expected to reach 1918 . So my opinion the gold have reached the overbought on high timeframes , so the gold metal should do a retest to the Friday closed zone and after that we will look at the next point .

BTCAll right... So much to look at, where do you want me to start?
My opinion first and then the signals? Sounds great!
Corrections are normal and we've been saying that any type of retrace or correction can be taken as an opportunity to buy-in, rebuy, and reload.
We see a correction intensifying due to bad news, market sentiment, or whatever... The correction is just running its course.

XAUUSDXAUUSD price has coming some importance area ,"Gold holdings in China as part of the total reserves are still very low, so there is probably room for further purchases down the road,” he said Giovanni Staunovo, an analyst at UBS Group AG.
China bought around $1650/oz compared to $1787 today.
What's still not clear is where the rest of the Q3 gold buying came from; the World Gold Council reported that central banks had bought 400 tons of gold.
In other gold-bullish news this week, Credit Suisse analyst Zoltan Pozsar went on a bit of a tangent in a note and suggested Russia could start selling oil for gold.

gold analysis Gold faces a strong resistance area and it is expected to rebound from it to the support area between 1847 to 1842

Idea Technically the price is magnitized by a fair value gap rebalancing our price so we have a healthy price action

The End of downtrend in AUDCHFI believe that the bullish trend is over in AUDCHF after a long time and at least it can touch the price of 0.63000 in the next 2 weeks.
However This is just my personal opinion and do not use it as a trading signal
FX:AUDCHF

Will The Gold Hit 1840 Before The End Of The Week ?Tuesday was as I expected , The Gold Metal breaks the support zone I have made , Rsi shows the oversold volume on the 4 hours timeframe , so for me tomorrow will be positive for the gold , so the fed powrell speech will affect negatively dollar index and push the gold metal up

SnxUsdtsnx dar yek sagfe gemateh garar darad ba in hal emkan resedan be gemat 3.51$ momken ast albateh mogavemat 3.30$ shaded mohkam ast va ehtemal zyad ke dar in gemat rezesh ta tp1 = 2.80$ va tp2 = 2.60 $
::::::::: nazar shoma chee hast

1:7 RR XAU/USD oanda next week predactionTechnically, gold's price is also influenced by various technical indicators and chart patterns, which can provide valuable insights into the direction of the market. These include moving averages, support and resistance levels, and trend lines.
To conduct a detailed analysis of gold, it's essential to consider all these factors and use a combination of fundamental and technical analysis. This can help you gain a better understanding of the market dynamics and make informed decisions about your investments.
finnaly,
