3278-3320 key position is mainly high sell low buyAt present, gold rebounded after falling back to 3287, and fluctuated around 3300 in the short term. Pay attention to the support area of 3278-3283 below. If it does not break this area, you can still try to go long in the short term. After all, from a technical point of view, the decline during the day is a correction and adjustment to the previous rise.
From the 4-hour chart, the upper short-term focus is on the suppression of the 3316-3320 area, and the lower focus is on the support of 3278-3283. In terms of operation ideas, continue to maintain the interval strategy of "high-altitude and low-multiple", rely on key positions to sell high and buy low, and wait patiently for effective signals before entering the market. If the structure or rhythm of the market changes, the strategy will be adjusted in time and notified separately.
Analyse

Spot gold fell below the 3330 mark
📌 Driving events
The trend of gold prices this week needs to focus on the following three major risk events:
First, the confrontation between Israel and the Houthis intensified this week. On May 25, the Houthis used hypersonic missiles to attack Israel's Ben-Gurion International Airport for the first time, resulting in the interruption of airport operations. Israel subsequently launched a retaliatory air strike. Iran has made it clear that it "will not give in on uranium enrichment activities" and warned that it will take hundreds of alternatives if it is sanctioned
Second, although the Trump administration's threat to impose a 50% tariff on the European Union has been postponed to July 9, the market is still concerned about it. If the trade war escalates, it may lead to increased global economic uncertainty, which will in turn boost the safe-haven demand for gold. However, the repetition of tariff policies may also trigger changes in market risk preferences and have a two-way impact on gold prices.
Third, record-breaking air strikes in the Russian-Ukrainian conflict Russia launched the largest air strike since the war on Ukraine on May 26, launching 355 drones and 9 cruise missiles, and many parts of Ukraine suffered heavy losses. The attack has heightened market concerns about geopolitical risks, pushing gold prices higher in the short term. However, due to expectations of a prolonged conflict, market demand for safe-haven assets may gradually weaken. Technically, gold has performed strongly at support levels near $3,330.
📊Commentary Analysis
This week, gold prices will remain highly volatile under the intertwined influence of multiple risk events. Investors need to remain vigilant and flexibly adjust strategies to respond to market changes. Analyze the market, make plans, and manage risk.
💰Strategy Package
In terms of operations, investors are advised to pay close attention to the situation in the Middle East and the progress of Trump's tariff policy. In the short term, short selling can be carried out in the range of $3,330-3,305, with a target of around $3,290-3,280. Profits can be taken in batches, and a light position can be taken long after breaking through $3,310, with a target of $3,360-3,380. Profits can be taken in batches, and medium- and long-term investors can make layouts on dips, taking advantage of geopolitical risks and the trend of a weak dollar, and gradually establish long positions.
⭐️ Note: Labaron hopes that traders can properly manage their funds
- Choose a lot size that matches your funds
- Profit is 4-7% of the capital account
- Stop loss is 1-3% of the capital account
Gold hits around 3280, please go long in the short term
📌 Driving Events
Gold prices fell more than 0.50% on Monday as demand for safe-haven assets decreased after U.S. President Donald Trump announced a postponement of tariffs on the European Union. Trading activity remained subdued as the U.S. and UK markets were closed for public holidays. As of this writing, the gold/dollar exchange rate was around $3,294. Trump issued a statement on Sunday, postponing the date of the 50% tariff on EU goods to July 9, and market sentiment improved. As a result, gold prices came under pressure and fell after a sharp rise of 4.86% last week (the strongest weekly performance since early April)
📊Commentary Analysis
Focus on the support level of 3285/80. If this area is touched for the first time, go long
💰Strategy Package
🔥Selling area: 3345-3350 SL 3355
TP1: $3333
TP2: $3325
TP3: $3308
🔥Buying area: $3280-$3285 SL $3275
TP1: $3312
TP2: $3330
TP3: $3345
⭐️ Note: Labaron hopes that traders can properly manage their funds
- Choose a lot size that matches your funds
- Profit is 4-7% of the fund account
- Stop loss is 1-3% of the fund account
Gold plummeted? Here comes the latest analysis.Today, the gold market continued its downward trend. It failed to break through the key resistance level of $3,365 in the early stage, and then fell under pressure. It is a normal price adjustment for the Asian market to break through the previous support level. The current price fluctuates around the strong support of $3,300. Coupled with several news to be released in the United States, the price trend is full of uncertainty. In this period of time, I don’t think it is suitable for shorting.
From the 4-hour chart, gold has insufficient upward momentum. After failing to break through the upward resistance level for a long time, it began to decline.
In the market last week, the price has always fluctuated between $3,330 and $3,365. In the narrow range of fluctuations, once a new trend appears, whether it is upward or downward, it may accelerate the price fluctuation range in a very short time; this is an instant release after accumulating energy. This is why the Asian markets suddenly started to move downward.
From the current market situation, the bulls are under great pressure, which is completely different from the strong upward pattern last week. At present, the trend of gold is more dominated by weak fluctuations.
Based on the current trend, we still follow the strategy of high-altitude and low-volume trading in our operations.

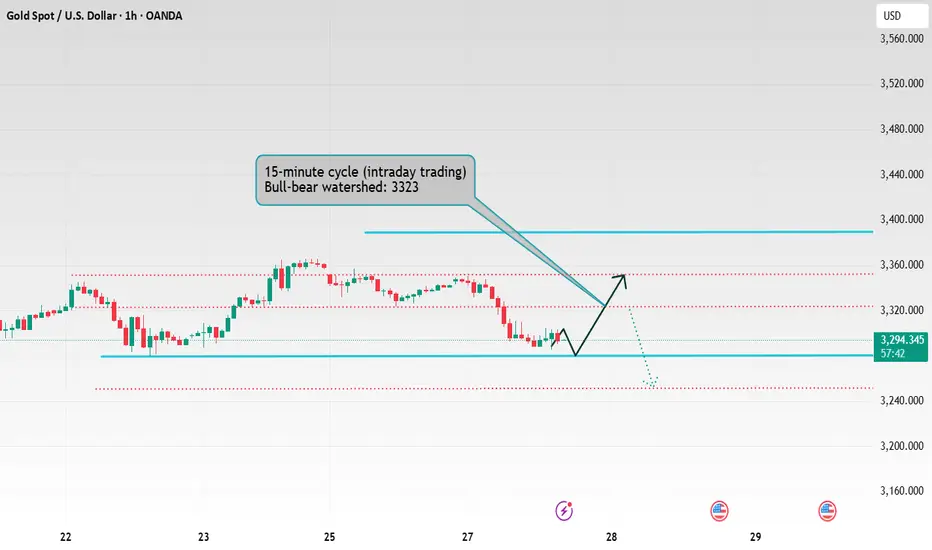
How will the short-term trend of gold develop?From a technical perspective, the overall volatility is limited. In the near future, the upper side is under pressure from the trend line, and the lower side is affected by the 4-hour middle track support. The overall trend is maintained in the range of 3365-3322. The current monthly line is approaching its closing, and the short-term market is temporarily in a high-level oscillation stage. In the 4-hour cycle, the price range is gradually narrowing, waiting for a directional breakthrough. The lower support focuses on the 3325-3320 middle track position and the previous top and bottom conversion support of the 3308 line; the upper pressure focuses on the 3352 and 3365 areas. After a slight high opening, it weakened. The overall idea is still to treat it as a wide range of fluctuations. It is recommended to be long and short in operation, and adjust the strategy after breaking through.
Operation suggestion: Go long near 3330-3323, and the target is 3340 and 3352;
If the pressure near 3352 is not broken, consider shorting, and the target is to fall back to the 3330 line.

Short term is still dominated by short positions!Although the easing of trade tensions in the short term has led to a correction in gold prices, the three core factors supporting the strength of gold still exist: expectations of loose global monetary policy, rising geopolitical risks, and the long-term weakening trend of the US dollar. In particular, the market expectation that the Federal Reserve may maintain loose monetary policy will continue to provide momentum for gold to rise.
From the daily chart, the price of gold has shown a clear upward trend since this year. Although there have been several corrections in the middle, the bulls still control the medium and long-term market. After the previous rise in the H4 cycle, it is not so strong now. Instead, it is a volatile trend. The Bollinger band is closed, and the trend strength still needs market stimulation to rise again.
The 1-hour moving average of gold has begun to turn, so the rising strength of gold bulls has been suppressed. The high point of the 1-hour rebound of gold has been getting lower and lower, and the low point has also begun to fall. The 1-hour gold has begun to fluctuate downward. The downward trend of the gold rebound is suppressed near 3340. Gold rebounds near 3340 and can still be shorted.

Gold continues to fluctuate. Interval analysis.Market analysis:
Gold opened slightly lower on Monday and fell to around 3331 before rebounding. After being blocked near 3357, it began to fluctuate and fall. The lowest point in the European session fell to around 3324, and then the market stopped falling and fluctuated and rose. The US session continued to rise, and the daily line closed with a small negative line with a lower shadow.
Gold showed a big positive trend last Friday, and closed negative on Monday for adjustment. The current 5-day moving average and the 10-day moving average form a golden cross and continue upward. This moving average pattern shows a certain bullish momentum. In the short term, focus on the support of the 5-day moving average, which is currently around 3330. When the price is above this moving average, the market fluctuates mainly on the strong side.
The upper resistance level first looks at around 3365, which is the high point of last Friday. Before the price does not break through this resistance level strongly, the volatile market will remain.
On the whole, today's focus will be on the support of the 3330-3326 area below, and the focus will be on the resistance near 3365 above.
Operation strategy:
Short at rebound near 3365, stop loss at 3375, profit range 3345-3330
Long at retracement near 3326, stop loss at 3316, profit range 3350-3370

GBPCHF: Long Setup – Bounce from Trendline + EMA CrossThe price has bounced from the lower boundary of the ascending channel and confirmed a bullish reversal after EMA cross. Current momentum supports a long position.
📌 Entry: Market buy (current price ~1.1142)
🎯 Targets:
TP1: 1.1291 – minor resistance
TP2: 1.1394 – upper channel border
🛡️ Stop-loss: Below 1.1090 (under channel + EMAs)
This setup favors continuation of the bullish trend after liquidity grab and structure shift.

Going long on pullbacks remains the mainstream.Fundamentals: Risk aversion is still the mainstream in the current market; risk aversion funds and risk aversion sentiment are still dominant in the gold market; although risk aversion and bullish sentiment have weakened at the war and trade war levels; the overall global fundamentals have not returned to their original state; behind various small fundamentals, there is still the possibility of triggering various risk events
Gold continued to rise on Friday due to the rise in risk aversion caused by tariffs, and the price of gold continued to rise to around 3365, and the daily line closed with a full big positive line again. If gold can successfully break through and stabilize in the 3360-3365 range in the future, the bull market is expected to regain its dominant position.
From the perspective of the 4-hour cycle, the price of gold continues to rise based on the unilateral moving average. Although there is a temporary divergence in the current indicators, in terms of form, the price of gold has achieved a short-term break. Next Monday, it is necessary to focus on the support strength of the 3345-3335 position, and the upper pressure range is maintained at 3365-3375. Do not blindly chase the rise before successfully breaking through and stabilizing. In terms of operation strategy, it is recommended to wait for the opportunity to step back, buy on dips, and continue to be bullish on gold prices. If gold can continue its strong performance next week, it is expected to test the previous high of 3430-3440 again.

Gold can be shorted near 3365-3370 in the US market
📌 Driving Events
Gold prices fell about 0.48% on Thursday, retreating from a two-week high of $3,345 and falling below the key $3,300 level. Although U.S. Treasury yields retreated from intraday highs, the renewed strength of the U.S. dollar still pushed gold prices down. The pressure on gold intensified after the U.S. House of Representatives passed President Trump's budget proposal, which is now submitted to the Senate for final approval. At the time of writing, XAU/USD was trading at $3,289, down 0.83% on the day. Although the market sentiment has rebounded slightly, it remains fragile after Moody's recently downgraded the U.S. sovereign debt rating. The fiscal package approved by the House of Representatives is expected to increase the national debt ceiling by a staggering $4 trillion, which has exacerbated concerns about long-term fiscal sustainability.
📊Comment Analysis
Gold is now facing strong resistance and buying power is weakening.
💰Strategy Package
🔥Sell Gold Zone: 3365- 3370 SL 3375
TP1: $3350
TP2: $3335
TP3: $3320
⭐️ Note: Labaron hopes that traders can properly manage their funds
- Choose the number of lots that matches your funds
- Profit is 4-7% of the fund account
- Stop loss is 1-3% of the fund account

Plan ahead Sell high and buy low to take the lead.Yesterday, the technical side of gold rose first and then fell. We directly arranged 3327 long orders to take profit and exit at 3340. After further accelerating to break through the 3345 mark, it fell under pressure and fell rapidly. We also successfully shorted at 3341, and the target successfully reached 3330-20. The European session continued to fall and broke through the 3300 mark and continued to fall to around 3280 to stabilize and rebound. We went long at 3280, and the target was 3300-3306. The daily K-line closed at a high and fell back to oscillate in the middle. The overall gold price was suppressed and oscillated at the 3345 mark in the short term. Yesterday's three orders also reached the take-profit target as expected.
From the 4-hour market analysis, today's upper short-term resistance is around 3315-3320. If the upper pressure 3315-3320 is not broken, shorting can also be done. Focus on yesterday's high pressure of 3345. The support level below is still 3280-3275. If it breaks down, pay attention to 3255-3250. Continue to rely on this range to maintain the main tone of high-altitude low-multiple cycles during the day. Observe more and move less in the middle position, be cautious in chasing orders, and wait patiently for key points to enter the market.
Operation suggestions:
1. Go long when gold falls back to 3285-3275, and look up to 3300 and 3315.
2. Go short when gold rebounds to 3340-3345, and look down to 3325 and 3315.

Dangers and opportunities for gold? Trend change?In early Asian trading, spot gold fluctuated in a narrow range and is currently trading around $3,300. After rising in the first three trading days of this week, gold prices briefly hit a two-week high of $3,345 in Asian trading on Thursday, then fell sharply and finally closed around $3,294. This rapid change hides the fierce struggle between the strengthening of the US dollar, the turmoil of US bonds and geopolitical changes.
The rebound of the US dollar is the biggest pressure for the rise in gold prices.
Another major pressure on the gold market comes from the sharp fluctuations in US bond yields. The 30-year US bond yield hit a 19-month high, reflecting the market's deep concerns about the $3.8 trillion in new debt. The cold auction of $16 billion in 20-year US bonds on Wednesday further confirmed the judgment that the demand for sovereign bonds is undergoing structural changes.
The current gold market is being pulled by multiple forces. In the short term, the technical rebound of the US dollar and the selling of US bonds do pose pressure. But in-depth analysis shows that the pressure of currency depreciation brought by the $3.8 trillion fiscal expansion, the safe-haven demand caused by the damaged credit of US debt, and the risk of stagflation are three factors that are building long-term support for gold.
I think the shadow of global bond market turmoil will become a potential factor for the bullish gold market.
There are relatively few economic data during Asian trading hours. The focus should be on the annualized total number of new home sales in the United States in April after seasonal adjustment and the speeches of Federal Reserve officials, as well as news related to the geopolitical situation and the international trade situation.
I will also analyze the latest international news and its impact on gold prices for you as soon as possible.
Short-term operation strategy:
First rise: short near 3345, stop loss 3255, profit range 3280-3270.
First fall: long near 3275, stop loss 3265, profit range 3300-3310.

XAUUSD Bull flag/ Break out or rejectionCurrently on the 4hour chart I have notice a bull flag forming, we are currently in a critical phase where price may break out to the upside or be rejected to anywhere as low as 3235 or even lower.
If price is rejected this could be the final leg down before we break out of the bull flag.

Gold bulls push prices to around 3355
📌 Driving events
Gold prices rose more than 0.50% and held above the $3,300 mark, driven by renewed safe-haven demand and rising geopolitical tensions in the Middle East. As of writing, gold/USD is trading around $3,317, rebounding from an intraday low of $3,285.
Market sentiment remains fragile, with US stocks falling into negative territory and US Treasury yields slightly higher. All eyes are on the upcoming vote on President Trump's tax reform plan. According to estimates by the Congressional Budget Office (CBO), the plan could lead to an approximately $3.8 trillion expansion of the US national debt. Uncertainty about the fiscal outlook continues to stimulate demand for gold as a defensive asset.
📊Comment Analysis
Gold price recovery is good, pay attention to the 3358 price area, adjust downward, and continue to accumulate funds around 3300
💰Strategy Package
🔥Sell gold area: 3358-3360 SL 3365
TP1: $3350
TP2: $3337
TP3: $3322
🔥Buy gold area: $3284-$3276 SL $3270
TP1: $3300
TP2: $3320
TP3: $3340
⭐️ Note: Labaron hopes that traders can properly manage their funds
- Choose the number of lots that matches your funds
- Profit is 4-7% of the fund account
- Stop loss is 1-3% of the fund account

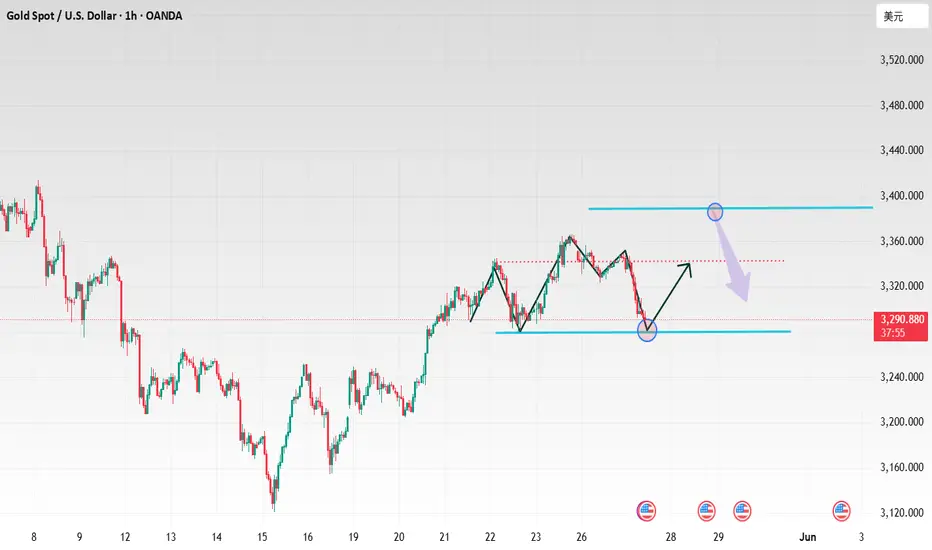
The unilateral offensive is fierce: the bulls have clear goalsGold is performing strongly sideways. We are in the same rhythm as yesterday and continue to maintain bullishness. Gold broke through the key resistance of 3280 on Tuesday and then rose strongly. It is currently above the area near 3330. The technical side shows that the bullish trend continues. The next target may point to the high of 3400. After rising continuously on Monday and Tuesday, it slightly adjusted back to around 3285 on Wednesday and stabilized before rising again. The daily line closed positive and stood firmly on the middle track. The Bollinger band opened upward, and the upper track pressure was at 3400, suggesting that the medium-term upward space is open. The Bollinger band opened significantly, the moving average was arranged in a bullish pattern, and the upward momentum was strong. Short-term support focuses on the moving average at 3315. If the correction does not break this position, the trend long order can follow up. If the key resistance of 3350 is effectively broken, it will further open up the upward space.
Gold operation suggestions: continue to go long after stepping back to 3320-3315, with a target of 3350. If it rises to around 3350 without breaking, you can arrange short-term short orders, with a target of 3330.

Is the gold price far from 3,400?Information summary:
The trade war is a continuous war, and it has just begun. During Trump's four years in office, trade conflicts will continue to occur. Trade conflicts are means, not ends. The goal of the United States is to transfuse blood to its own economy through trade negotiations.
In addition, US inflation fell to a historic low of 2.3% in April. The Federal Reserve has not cut interest rates on the grounds that inflation will rebound. The Federal Reserve can't hold on for long. Cutting interest rates is the only antidote to boost the economy, and it is also a special medicine.
Next, once the Federal Reserve releases the wind of interest rate cuts, the market's risk aversion will be ignited again. In June, 6 trillion US bonds will mature. Regardless of the result this time, market sentiment will be worried, which is the key to driving price fluctuations.
Market analysis:
The 1-hour gold price broke through yesterday's high of $3,320. The previous pressure formed a new top-bottom conversion position, and the strong market was only a small correction in the middle. There is no need to worry about whether it will peak, but there must be a standard for judging the peak; this standard is: breaking the support position before the last decline, and the second rebound does not set a new high.
Operation strategy:
Go long when the price falls back to around $3,330, stop loss at $3,320, and profit range at $3,365-3,380.

Grasp the core strategy of trend tradingGold continues to be bullish and will go to the area near the gap of 3325. At that time, the short-term may be blocked and fall back. If it breaks, look at the area near 3340-3345. In the 4H cycle, relying on the moving average to support the rising stage, and the Bollinger is in an open state, there is still room to see above. The support for the fall back is to pay attention to the top and bottom of the small cycle of 3285, followed by the low point of 3274, but there will not be too much retracement in the strong position. In terms of operation, the main fall back is long, and gradually look at 3325 and 3345. Shorting can only be entered at key points, and fast in and out without fighting.
Operation suggestion: Go long on gold near 3285-74, look at 3315 and 3325! If it is extremely strong, go long on the support of 3298-3295!

Gold breaks upward, space opens up
📌 Driving events
Internationally, US media reported that US intelligence agencies found that Israel was preparing to attack Iran's nuclear facilities, and gold and crude oil both soared in the short term.
Recently, the Iran nuclear talks and the Russia-Ukraine talks were carried out simultaneously, and the market risk aversion sentiment fluctuated greatly
📊Comment analysis
While the medium and long-term outlook continues to be bullish on gold's performance this year, short-term operations are mainly based on news. Pay attention to light positions and maintain flexibility in short-term operations.
💰Strategy Package
🔥Buy Gold Zone: 3310-3315 SL 3307 Scalping
TP1: $3318
TP2: $3325
TP3: $3330
🔥Sell Gold Zone: 3354-3356 SL 3361
TP1: $3345
TP2: $3332
TP3: $3320
🔥Buy Gold Zone: $3252 - $3250 SL $3245
TP1: $3260
TP2: $3270
TP3: $3280
⭐️ Note: Labaron hopes that traders can properly manage their funds
- Choose the number of lots that matches your funds
- Profit is 4-7% of the fund account
- Stop loss is 1-3% of the fund account

My Learning and analysis on GOLD (XAUUSD)Hello Community,
I have shared everything as per my learning. Maybe, it is right or wrong. It doesn't matter have rough idea about Gold (XAUUSD). Please, Do not consider it's as your learning. I am beginner and just tracking my trading journey.
Have a Good Trading day ahead.
Comment down your thoughts below. Always inspired to learn.
Thanks.

Gold Trends and Trading StrategiesThe gold market continued to fluctuate yesterday, and the price was repeatedly under pressure at the key position of 3250. At the weekly level, gold prices tried to rebound after bottoming out on Friday, but the upper short-term moving average formed technical suppression, and the daily line closed with a cross star with long upper and lower shadows, and the long-short game was fierce. From a technical perspective, the 4-hour chart shows a descending channel pattern. The price rebounded after testing the lower track of the channel many times, but it has never effectively broken through the 3250 central axis suppression. The hourly chart shows that the market maintains a rhythm of shock correction. The current daily line has two Yins and one Yang, but it has not effectively broken the previous low. It is expected that the bottoming and rebounding mode may continue today. In terms of operation, it is recommended to pay attention to the 3260-3200 range, and rely on the upper and lower edges of the channel to implement a high-altitude low-multiple strategy.
Gold operation suggestions:
1. Short near the rebound of 3247-3252, target 3230-3220.
2. Go long near the retracement of 3206-3215, target 3230-3245.

Gold bottomed out and rebounded, US market ideas!
📊Comment analysis
During the European and American markets, the market rebounded to 3249. Before the rebound, it was mentioned that the first resistance today was around 3251, followed by the defense point of 3265. As expected, gold plunged slightly near the resistance level of 3251, and fell to 3227 at its lowest.
💰Strategy package
Short at the current price of 3239-40, add shorts near 3242 and 3245, stop loss 3253 target 3200-3165
⭐️ Note: Labaron hopes that traders can properly manage their funds
- Choose the number of lots that matches your funds
- Profit is 4-7% of the fund account
- Stop loss is 1-3% of the fund account

Gold Price Trading Around 3,200 Points
📌 Gold Information
Gold (XAU/USD) is recovering from recent losses, trading around $3,230 per troy ounce during Asian trading hours on Monday as investors seek safe haven assets amid growing concerns about the US economic outlook and fiscal sustainability. The rebound follows Moody's decision to downgrade the US credit rating by one notch, from Aaa to Aa1, citing growing debt and the burden of interest payments. This follows previous downgrades by Fitch and Standard & Poor's in 2023 and 2011, respectively. Moody's now forecasts that the US federal debt will surge to around 134% of GDP by 2035 from 98% in 2023, due to ballooning debt servicing costs, expanding entitlement programs, and shrinking tax revenues - all of which have heightened investor concerns and provided new support for gold prices.
📊Comment Analysis
Gold price fluctuated around 3200 at the beginning of the week. There was not much news and it continued to go sideways.
💰Strategy Package
⭐️Set gold price:
🔥Sell gold area: 3259-3261 SL 3266
TP1: $3250
TP2: $3240
TP3: $3230
🔥Buy gold area: $3192 - $3190 SL $3185
TP1: $3200
TP2: $3210
TP3: $3220
⭐️ Note: Labaron hopes that traders can properly manage their funds
- Choose the number of lots that matches your funds
- Profit is 4-7% of the fund account
- Stop loss is 1-3% of the fund account

Moody's downgrades US credit rating, will gold be affected?Information summary:
At about 4:43 pm on Friday (the last minute before the market closed), Moody's downgraded the US sovereign credit rating from AAA to Aa1 on the grounds of "surge in debt and fiscal out of control", ending the US's last "top credit" title among the three major rating agencies.
Perhaps considering reducing the impact, Moody's announced this news after the US stock market closed. But at this time, gold, foreign exchange and other markets still have more than ten minutes of trading time. The 10-year US Treasury yield once rushed from 4.44% to 4.49%, the US dollar index fell, and gold rushed up.
The downgrade is a super-class data, which may cause gold to rebound in stages, but not continuously. If nothing unexpected happens, after the adjustment, gold may continue to retreat in a trend.
Technical analysis:
Next week, gold may rebound in stages to 3330-3340. Then there may be a trend decline again, and I estimate that it may test around 2950 below. As for why it went to 3330-40, here is an analysis:
I think the current gold trend is very similar to the holiday trend in Asia from May 1st to 5th. It also fell sharply, then bottomed out and rebounded, and then stretched up again. I also drew it in the picture, which is basically consistent with the current trend. If the next market trend is copied from the previous paragraph, then I think it should test the 3330-40 point.
