British Pound can little grow and then drop to buyer zoneHello traders, I want share with you my opinion about British Pound. If we look at the chart, we can see how the price started to grow inside an upward channel, where it at once broke the 1.3280 level. In the channel, it rose to the resistance level, which coincided with the seller zone, after which it rebounded and fell to the support line of the channel. Later, GBP rose to the seller zone and dropped, breaking the resistance level and exiting from the upward channel. Then the price entered to wedge and then made an impulse up, breaking the resistance level, and rose to the resistance line of the wedge. After this movement, it turned around and started to decline. Soon, it broke the 1.3580 level one more time and fell more. But later it turned around and rose to the 1.3580 resistance level, which coincided with the resistance line of the wedge. Then it dropped to the support line of the wedge, breaking the support level, but soon it backed up and rose back to the resistance line of the wedge pattern. Now I expect that the British Pound can continue to decline inside the wedge, and reach the buyer zone, breaking the support level. For this case, I set my TP at 1.3245 points, which coincided with the buyer zone. Please share this idea with your friends and click Boost 🚀
Disclaimer: As part of ThinkMarkets’ Influencer Program, I am sponsored to share and publish their charts in my analysis.
Analysis

#BTC #BTCUSD #BTCUSDT #BITCOIN #Analysis #Eddy#BTC #BTCUSD #BTCUSDT #BITCOIN #Analysis #Eddy
I have identified the important supply and demand zones of the higher timeframe for you.
This analysis is based on a combination of different styles, including the volume style with the ict style.
Based on your strategy and style, get the necessary confirmations for this analysis to enter the trade.
Don't forget about risk and capital management.
The responsibility for the transaction is yours and I have no responsibility for your failure to comply with your risk and capital management.
💬 Note: This is just a possibility And this analysis, like many other analyses, may be violated. Given the specific circumstances of Bitcoin, it is not possible to say with certainty that this will happen, and this is just a view based on the ICT style and strategy with other analytical styles, including the liquidity style. (( The fall of Bitcoin may not change the trend of altcoins and money will move out of Bitcoin and into altcoins, and we will see altcoins grow. ))
Be successful and profitable.

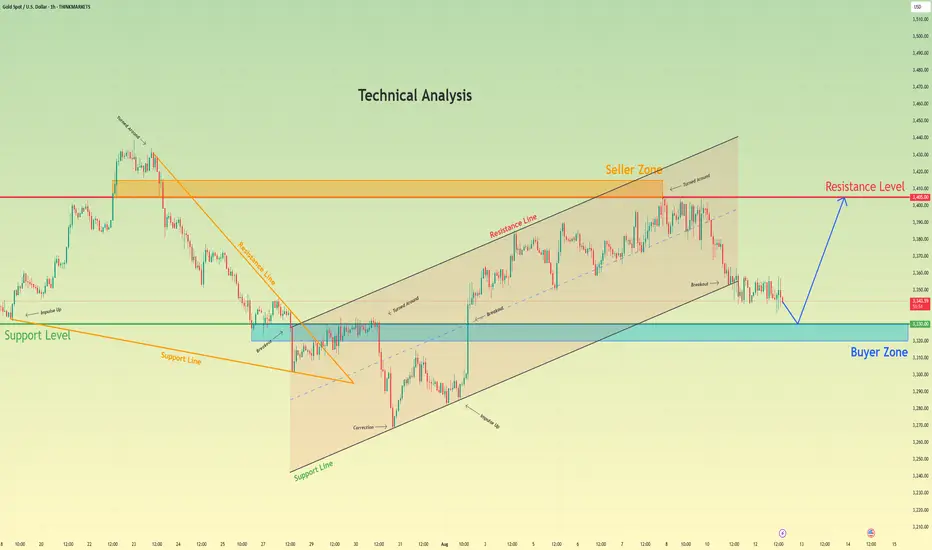
Gold may bounce from support level and rise to resistance levelHello traders, I want share with you my opinion about Gold. The technical narrative for gold has fundamentally shifted from bearish to bullish following a significant breakout from a prior downward wedge. This powerful upward rebound signaled a clear change in market control, invalidating the previous downtrend and establishing a new, constructive market structure. This new structure has taken the form of a well-defined upward channel, which has been guiding the price action higher through a series of impulsive and corrective waves. Currently, the asset is undergoing a natural corrective phase after recently testing the upper resistance line of the channel. This downward correction is guiding the price towards a critical confluence of support located around the 3330 level. This area is significant as it represents the intersection of the channel's ascending support line and a strong horizontal buyer zone. The primary working hypothesis is a long scenario, based on the expectation that buyers will step in to defend this key support confluence and maintain the integrity of the upward channel. A confirmed bounce from this area would likely initiate the next impulsive leg higher within the trend. Therefore, the tp is logically set at the 3405 resistance level, as this represents a full rotation back to the top of the channel and aligns with the major seller zone. Please share this idea with your friends and click Boost 🚀
Disclaimer: As part of ThinkMarkets’ Influencer Program, I am sponsored to share and publish their charts in my analysis.
GOLD DUMPS $50 – LIQUIDITY ZONE AHEAD | CPI IN FOCUS! GOLD DUMPS $50 – LIQUIDITY ZONE AHEAD | CPI IN FOCUS!
📌 MARKET RECAP
Gold kicked off the week with a sharp $50 drop, breaking multiple key trendlines and nearby support levels in quick succession.
Main drivers behind the move:
Profit-taking after the recent strong rally.
Stronger USD expectations ahead of CPI data (forecast +0.1% vs previous).
Geopolitical factors – Ukraine–Russia ceasefire talks approaching their conclusion, adding to risk-off sentiment.
🧐 WHAT’S NEXT?
If CPI comes in strong → USD strengthens → Gold could slide further into the 333x – 330x liquidity zone.
If CPI disappoints → USD weakens → Gold may quickly bounce back toward the 337x key level (previous breakdown area) for a retest before deciding direction.
🎯 MMFLOW GAME PLAN
1️⃣ BUY SCALP
📌 Entry: 3331 – 3329
📌 SL: 3325
📌 TP: 3335 – 3340 – 3345 – 3350 – 3360 – 3370 – 3380
2️⃣ BUY ZONE
📌 Entry: 3310 – 3308
📌 SL: 3304
📌 TP: 3314 – 3318 – 3322 – 3326 – 3330 – 3335 – 3340 – 3350 – 3360 – ???
3️⃣ SELL SCALP
📌 Entry: 3363 – 3365
📌 SL: 3370
📌 TP: 3360 – 3356 – 3352 – 3348 – 3344 – 3340
4️⃣ SELL ZONE
📌 Entry: 3376 – 3378
📌 SL: 3382
📌 TP: 3372 – 3368 – 3364 – 3360 – 3355 – 3350 – 3340
⚠️ RISK NOTE
CPI is a potential game-changer – even a small deviation from forecasts can trigger a massive one-way move.
Always keep an eye on AD-marked Key Levels on the chart before pulling the trigger.

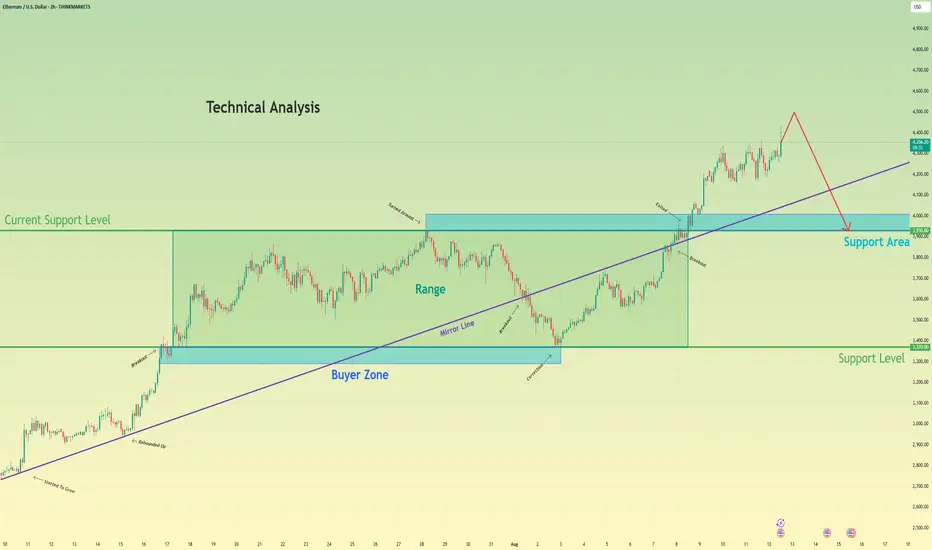
Ethereum will rise a little and then drop to support levelHello traders, I want share with you my opinion about Ethereum. Following a sustained upward trend, Ethereum entered a prolonged consolidation phase, forming a wide range between the buyer zone near 3370 and local resistance. Throughout this period, a key ascending mirror line provided consistent support, underpinning the bullish market structure and allowing for accumulation before the next major move. Recently, a decisive breakout from the top of this range occurred, propelling the asset to a new local extremum and confirming the strength of the buyers. However, the price action following this breakout has shown signs of potential exhaustion, with momentum appearing to wane at these elevated levels. The primary working hypothesis is a short, corrective scenario, which anticipates that after a potential final push to a new high, the price will undergo a sharp reversal. A key component of this thesis is the expected break of the main ascending mirror line, an event that would signal a significant shift in short-term market dynamics and confirm that sellers are taking control. Therefore, the tp for this anticipated downward move is logically placed at the 3930 level. Please share this idea with your friends and click Boost 🚀
Disclaimer: As part of ThinkMarkets’ Influencer Program, I am sponsored to share and publish their charts in my analysis.
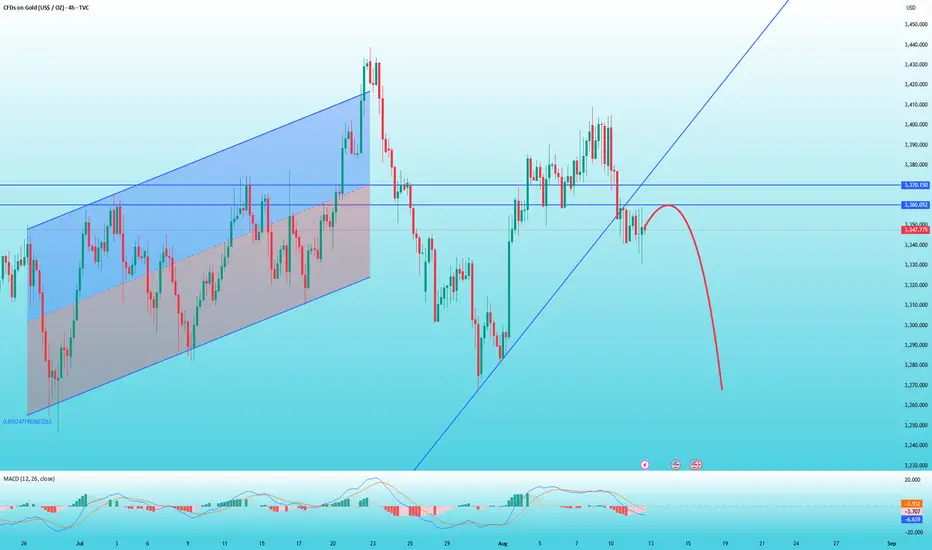
Gold rebound is weak, beware of further declineThe CPI data released this week was lower than market expectations, which is considered positive news. However, since it was the same as the previous reading, gold prices only rebounded briefly before entering another period of volatile consolidation.
From the 4-hour chart, gold prices have already broken through support levels. If they fail to break back above 3370 in the short term, they may continue to test the bottom.
Gold's rebound is weak in the short term, and it's trending downward. The K-line indicator is showing a bearish pattern, and the MACD indicator has formed a death cross.
Therefore, if you want to trade short, wait for a rebound around 3360. Set a stop-loss at 3370, with a target of 3340 and then 3330.
S&P 500 Bearish Pennant Signals Potential Downside MoveThe S&P 500 Index (SPX) is forming a bearish pennant pattern on the 30-minute chart, suggesting possible continuation of the recent downtrend. Price action is consolidating within converging trendlines after a sharp drop, with a breakdown below support near 6,360 potentially opening the door to further declines toward the 6,300 level. Traders should watch for confirmation with increased selling volume.
Pattern Structure: Price has made a steep drop, then entered a short consolidation bounded by converging trendlines (lower highs and higher lows).
Bias: This setup often signals a continuation of the prior trend — in this case, downward.
Trigger Level: A decisive break below the pennant’s lower support (around 6,360) could confirm the bearish signal.
Target Zone: If the breakdown occurs, the measured move could aim toward the 6,300–6,280 range, matching the height of the prior drop.
Risk Factor: A false breakout is possible, especially if broader market sentiment shifts bullish suddenly.
In short: The chart suggests sellers remain in control, and the next move hinges on whether support at ~6,360 holds or breaks.

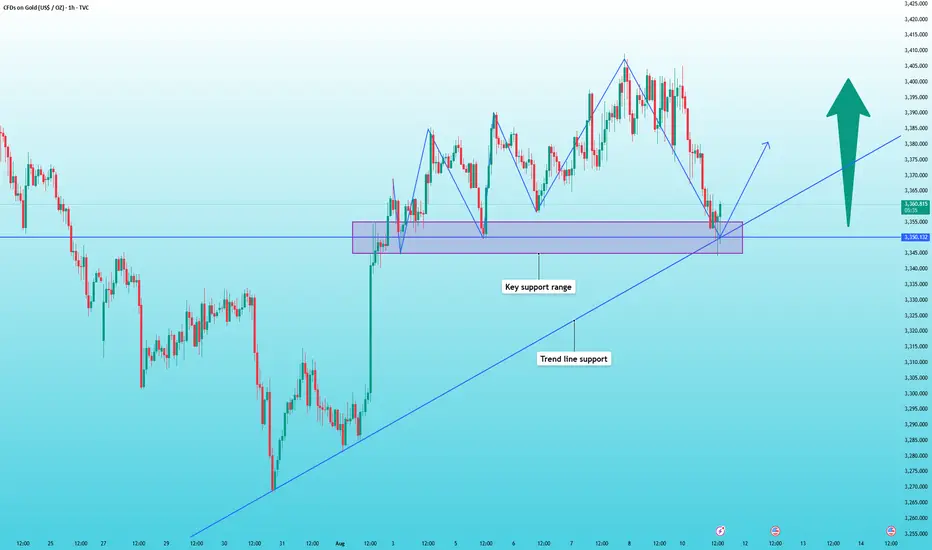
Gold Price Eyes Bullish Rebound After Triangle BreakoutGold (XAU/USD) is showing signs of a potential upward reversal after bouncing from the $3,350 support zone. The earlier symmetrical triangle (A-B-C-D) breakout led to sideways consolidation before a retracement. Price action now suggests bullish momentum could target $3,385, with strong support holding near $3,340. A break above the short-term resistance could confirm the rebound toward higher levels.
1. Symmetrical Triangle Breakout – The A-B-C-D pattern indicated price compression, followed by an upside breakout, showing bullish bias.
2. Support Zone – Strong support is established around $3,340–$3,350, holding despite recent selling pressure.
3. Retracement Phase – Price pulled back after peaking near $3,400, creating a lower-high sequence.
4. Bullish Reversal Signal – Recent bounce from support suggests buyers are stepping back in.
5. Upside Target – Immediate resistance lies near $3,385; a break above could lead toward the $3,400 zone.
6. Risk Factor – Failure to hold above $3,340 could open the door for further downside correction.

Analysis for the CPI News
Good Morning Traders,
Here is my analysis for the CPI News, as you seen the waterfall of gold, price has filled the FVG according to the D1 time frame, there is SSL, the price can hit the SSL and can fly during the news impact, here is our trade entry, Stop loss and Target.
Good Luck Mates!!

GBPUSD SELL SETUPI EXPECT THE PRICE Will fall as we have bearish flag has been broken
and we have down trend and we have supply

THE CHART DOESN'T LIE: A NEW DAWN FOR ETHEREUM
🔍 TECHNICAL ANALYSIS
1. The long-term downtrend , which lasted approximately 3.5 years, has been **broken on the monthly chart**, signaling a confirmed breakout (BO).
2. The horizontal resistance level at 4045 USDT is a critical zone. This is expected to act as the next stop following the breakout. A clear breach of this level could potentially lead to **more aggressive upward movements**.
Note: We do not consider the all-time high at 4631 USDT to be a major resistance, as it previously acted not as a strong sell zone but rather as a **momentum acceleration point**. With the entry of new investors and resulting FOMO (Fear of Missing Out), we anticipate minimal resistance around this level.
3. Since its launch in 2016, the **MACD indicator** has issued three **buy signals** on the monthly timeframe:
* Two resulted in strong bull runs .
* One led to a ** 60% rally **.
* Currently, a new bullish crossover is forming.
4. The RSI indicator has historically provided clear insight into when rallies may begin to slow. In particular, the 88 level and above has marked overbought territory, which could be a suitable area for gradual profit-taking .
5. Important Fibonacci-based accumulation zones are located between 3262 and 2697 USDT.
🧠 FUNDAMENTAL ANALYSIS
1. Smart Contracts
Ethereum is a programmable blockchain that enables the execution of smart contracts—automated agreements without intermediaries.
🧠 Example: “If Team A wins, send payment automatically.”
2. Decentralized Application Platform (dApps)
Ethereum empowers developers to build dApps whose data is stored across the network, not on centralized servers—making it resistant to censorship.
3. Foundation of DeFi and NFT Ecosystems
* Most DeFi platforms (lending, staking, earning interest) are built on Ethereum.
* Roughly 80% of NFTs originated on Ethereum (OpenSea, Bored Ape, CryptoPunks, etc.).
4. Approval of Spot Ethereum ETFs (U.S.)
* Following Bitcoin ETFs, some Ethereum spot ETFs have been approved.
* This has **opened the door to institutional investment**, creating **upward price pressure**.
5. ETH 2.0 Upgrade & Staking
* Ethereum transitioned from Proof of Work to Proof of Stake, making the network more sustainable and scalable.
* Users can now stake ETH to earn passive income.
6. Enterprise Adoption
* Corporations such as Visa and JPMorgan are testing Ethereum’s infrastructure.
* Use cases: payments, data storage, contract management.
7. Favorable Regulatory Shifts Support Altcoins
* U.S. laws like GENIUS and CLARITY have laid a framework for stablecoins.
* This has increased institutional interest in **infrastructure coins** like Ethereum and Solana.
8. Capital Rotation into Altcoins
* While Bitcoin consolidates between \$115K–\$118K, capital is flowing into altcoins.
* Tokens like XRP, DOGE, BONK, PEPE, HYPE have surged.
* XRP is particularly favored due to its enterprise use case, with price targets of \$4–\$6 being speculated.
9. Growth in Futures and Institutional Trading
* CME Group data shows growing open interest in Solana and XRP futures.
* ETH farms also reflect strong institutional interest, as companies begin to hold crypto assets under treasury models.
10. Risks to Monitor
* Potential downward pressure may come from **Fed rate decisions**, **ETF inflows/outflows**, *miner selling, or regulatory actions (e.g., MiCA).
* Altcoins remain volatile and sensitive to regulation.
💹 IN SUMMARY – Key Accumulation Zone:
3262 – 2697 USDT
We haven't provided detailed Ethereum analysis in a while, as both technical and fundamental structures often require time to form. In short: not all assets are worth analyzing until they are.
"Wealth does not come from the number of trades, but from the patience to wait for the right trade." – Bull Investment
⚠️ DISCLAIMER:
Maintain proper capital and risk management to protect your psychology during market corrections.
This analysis is for educational purposes only and does not constitute financial advice. Making decisions based on this commentary may lead to losses.
Avoid following unverified tips and rumors.

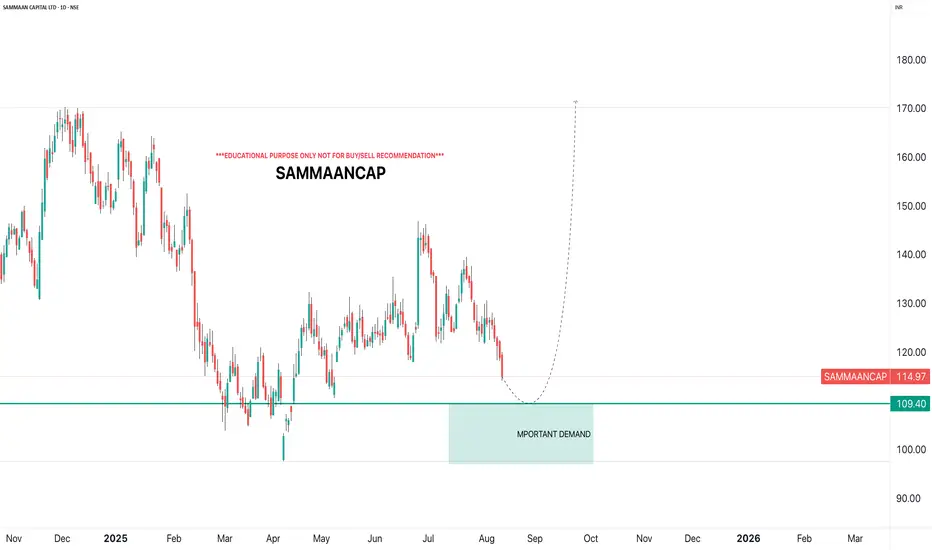
SAMMAANCAPi Observed these Levels based on Price Action and Demand & Supply which is my own Concept "PENDAM CONCEPTS"... Please don't take any trades based on this chart/post... Because this chart is for educational purpose only not for Buy or Sell Recommendation... Thank Q
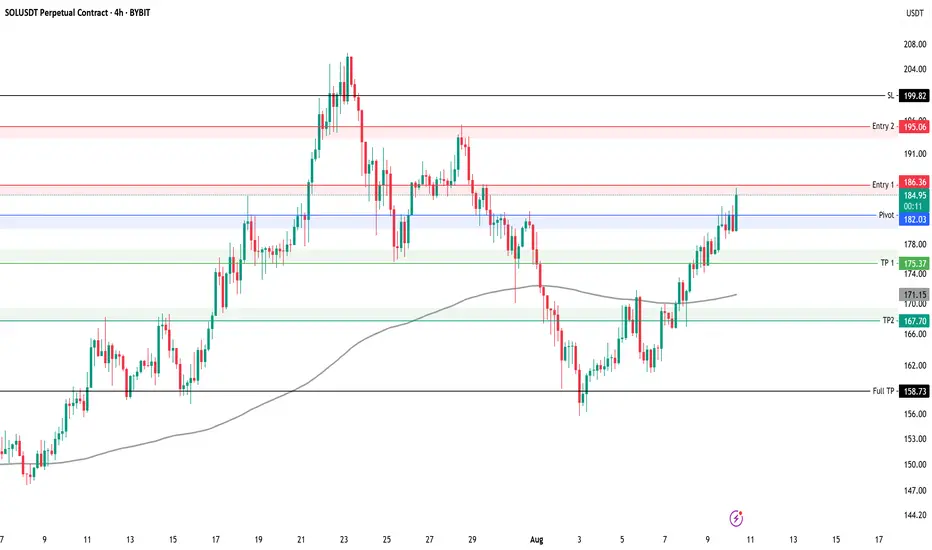
SOLUSDT Short Key levels to watch for SOLUSDT 4H
We have taken first entry on this setup using 0.5% risk
Risk per entry 0.5%
Entry 1: 186
Entry 2: 195
TP 1: 175
TP 2: 167
Full TP: 158
SL: 199
Always manage your own risk. None of the above is financial advice.
ETHUSDT ShortThese are the key areas we are looking for on ETH 4H
Risk per entry 0.25%
Entry 1: 4250
Entry 2: 4450
TP 1: 3900 or Pivot 4050
TP 2: 3620
Full TP: 3320
SL: 4580
Always manage your own risk. None of the above is financial advice.

U.S. Slaps 39% Tariff on Swiss Gold BarsU.S. Slaps 39% Tariff on Swiss Gold Bars, Shaking the Global Bullion Market
By Hirad Aryanejad – Macroeconomic & Gold Markets Analyst
---
The United States has moved to impose a 39% tariff on imports of one-kilogram and 100-ounce gold bars from Switzerland — a shock decision that could ripple across the global bullion market.
In a letter dated July 31, 2025, the U.S. Customs and Border Protection (CBP) reclassified these widely traded bullion products — critical to the Comex futures market — as “semi-manufactured”, making them subject to duties.
Previously, they were classified as “unwrought, nonmonetary gold” , exempting them from earlier tariff rounds.
---
A Blow to the World’s Largest Refining Hub
The decision follows former President Donald Trump’s broader tariff package on all Swiss goods, announced after rejecting Switzerland’s proposal for a 10% tariff in exchange for \$150 billion in U.S.-bound investment.
Switzerland — the world’s largest gold refining hub — exported roughly $61.5 billion in gold to the U.S. over the 12 months ending June 2025. The new tariff could add nearly $24 billion in duties.
Christoph Wild, President of the Swiss Association of Manufacturers and Traders of Precious Metals, called the ruling “another blow” to Swiss-U.S. gold trade, warning that exports may become “economically unviable”.
---
Market Reaction: Record Gold Prices
The ruling triggered an immediate market shock. Gold futures in New York surged past $3,500 per troy ounce, hitting a record $3,534 on August 8, before pulling back slightly.
Analysts say the rally was driven by both the tariff announcement and gold’s safe-haven appeal amid escalating trade tensions and geopolitical uncertainty.
Some traders described the CBP’s decision as “shocking” and possibly mistaken, predicting legal challenges ahead. The lack of clarity has already caused certain shipments to freeze in transit.
---
The Critical Role of Switzerland in Bullion Logistics
Global bullion trade depends on a triangular supply chain:
Raw gold refined in Switzerland Cast into kilo bars for the U.S. market or 400-ounce bars for London Delivered to satisfy Comex contracts and central bank reserves
This logistical network is now under threat. UBS strategist Joni Teves has questioned whether U.S. gold futures trading can remain viable if tariffs on deliverable products persist.
The Swiss Precious Metals Association noted that the CBP’s clarification applies to all 1kg and 100oz gold bars imported into the U.S. not only those from Switzerland — raising the stakes for global trade flows.
---
Negotiations and Uncertainty Ahead
Switzerland continues to negotiate with Washington to reduce the tariff burden, but uncertainty remains.
The White House is reportedly preparing a clarification on the bullion tariffs that could determine whether the market stabilizes or faces prolonged disruption.
Until then, gold industry players — from major banks to refining houses — are bracing for further volatility, both in pricing and physical supply chains.
---
Keywords: gold market news, Swiss gold bars, U.S. gold tariffs, Comex gold futures, bullion trade, Switzerland gold exports, precious metals refining, gold price surge, macroeconomic analysis.
Gold support has been confirmed, buy with confidenceThe most anticipated outcome for the gold market this week is tomorrow's CPI data. After today's pullback during the Asian and European trading sessions, the current price has reached support levels. Before the CPI release, I believe volatility will be minimal, with a high probability of limited fluctuations.
The chart shows that 3350 is a key support level. After several hours of testing, 3350 has stabilized, so we can buy at this level, with the initial target being 3360, followed by 3380.
XAUUSD ( GOLD ) Sideways Grind – Big Move LoadingPrice is still ranging between $3,368.41and $3,343.41. The D1 open sits near $3,347, acting like a pivot. Trades inside the box are possible but riskier due to quick fades and wicky candles.
Bullish plan (need confirmation)
Trigger: A clean 30min close above $3,368.41 (body close, not a wick).
Targets: The marked level at $3,377.34. If momentum is strong, trail stops and let it run.
Bearish plan (cleaner if we lose the box)
Trigger: 30min close below $3,343.41.
Targets: $3,337.49 first. If sellers keep control, trail for extra downside.
Management: Scale out at $3,337.5, protect the rest.
Range scalp (only if you accept higher risk)
Fade the edges:
Short near $3,368 on clear rejection; target mid ($3,356–3,358), SL just above the rejection high.
Long near $3,343–3,345 on a strong rejection wick; target mid, SL just below the lows.
Keep size smaller; this chop flips fast.
What would confirm the break
Strong 30m candle bodies through the level (not just spikes).
What invalidates
Breakout that closes back inside the range on the next candle → likely a trap; exit and reassess.
Multiple long wicks through the level with no follow through.
Bottom line: I’m patient inside $3,343–$3,368. I’ll act on a 30m close. Upside focus above $3,368.41 toward $3,377.34; downside focus below $3,343.41 toward $3,337.49.

Gold Trading Strategy XAUUSD August 13, 2025Gold Trading Strategy XAUUSD August 13, 2025:
Gold prices recovered slightly, currently trading around $3,351/oz, positive US inflation data for July has reinforced market expectations that the US Federal Reserve (FED) will cut interest rates in September, while a weaker US dollar has boosted gold's appeal.
Fundamental news: Data from the US Bureau of Labor Statistics showed that the Consumer Price Index (CPI) increased 2.7% year-on-year in July, lower than the expected 2.8% and unchanged from June. Core CPI increased 3.1% year-on-year and 0.3% month-on-month, the largest increase in six months.
Technical analysis: The sideways range of 3,340 - 3,360 has not been broken yet. The MAs are showing signs of moving sideways, showing the tug-of-war between buyers and sellers. RSI H1 has started to move towards the buy zone, RSI H4 is heading towards the average line. There is a high possibility that gold price will have a correction according to RSI of H4 and increase strongly again.
Important price zones today: 3340 - 3345, 3365 - 3370 and 3385 - 3390.
Today's trading trend: SELL.
Recommended orders:
Plan 1: SELL XAUUSD zone 3367 - 3369
SL 3372
TP 3364 - 3355 - 3345.
Plan 2: SELL XAUUSD zone 3387 - 3389
SL 3392
TP 3384 - 3374 - 3364 - 3345.
Plan 3: BUY XAUUSD zone 3340 - 3342
SL 3337
TP 3345 - 3355 - 3365 - 3385 - OPEN.
Wish you a safe, successful and profitable trading day.💗💗💗💗💗

GOLD ON FIRE – 3358 WALL ABOUT TO CRACK, 337x NEXT STOP!📌 Market Overview
Following the CPI release, Gold is showing strong buying momentum, with a clear aim to break the 3358 resistance and push quickly towards the 337x zone – a key equilibrium level where SELL pressure is expected to react.
Price bounced sharply from the 333x area back into the 335x range. If 3358 breaks, there’s a high probability we will test 337x within the day, triggering SELL volume.
Today’s market is expected to be relatively quiet, with no major news scheduled. The daily range could stay around 35–40 dollars.
With the current bullish momentum, the preferred strategy is to wait for price to retest early BUY support zones around 334x to catch the next upside wave in line with the primary trend.
🎯 Key Trading Zones
🔹 BUY ZONE
Entry: 3338 – 3336
SL: 3332
TP: 3342 – 3346 – 3350 – 3355 – 3360 – 3370 – 3380
🔹 SELL ZONE
Entry: 3375 – 3377
SL: 3382
TP: 3370 – 3365 – 3360 – 3355 – 3350 – 3340
📊 Key Levels
Resistance: 3358 – 3365 – 3376
Support: 3342 – 3337 – 3330 – 3310
⚠ Risk Note
No major economic releases today, so intraday moves may rely heavily on technical reaction points. Watch MMFLOW Key Levels closely – a break of 3358 could accelerate the move to 337x, while holding below may trigger short-term pullbacks.

CADCHF SELLSI entered a sell on CADCHF that I didn’t share earlier. The reason behind the trade was that price mitigated a Daily inefficiency, which caused the 4H bullish structure to flip. After the flip, price pulled back into a well-defined 4H supply zone. I waited for confirmation on the 15-minute timeframe, and once the structure shifted there, the entry was triggered. Price has returned to the entry area, but the trade remains valid as long as the structure is intact. I'm aiming for a nice swing move if price cooperates, and I’ll definitely take partials at the first significant low.

Fundamental Market Analysis for August 11, 2025 GBPUSDThe Bank of England (BoE) cut its key interest rate by 25 basis points (bps) last week, as expected, bringing the base rate down to 4%, its lowest level since 2023. However, the narrow 5-4 vote indicated greater resistance to rate cuts than expected by the markets, prompting traders to reduce their bets on aggressive easing by the BoE.
In addition, traders are also factoring in the likelihood that the US central bank will cut interest rates at least twice before the end of this year.
Meanwhile, expectations for a dovish Fed policy were confirmed by comments from Fed Governor Michelle Bowman on Saturday, who said that three interest rate cuts would likely be appropriate this year. Bowman added that the clear weakening of the labor market outweighs the risks of future inflation. This, in turn, should limit the decline of the GBP/USD pair.
The latest US consumer inflation data will be released on Tuesday, while preliminary UK second-quarter GDP data and the US producer price index (PPI) will be released on Thursday. These important data points should provide significant momentum to spot prices and help determine the next phase of the directional movement.
Trading recommendation: BUY 1.3490, SL 1.3410, TP 1.3570

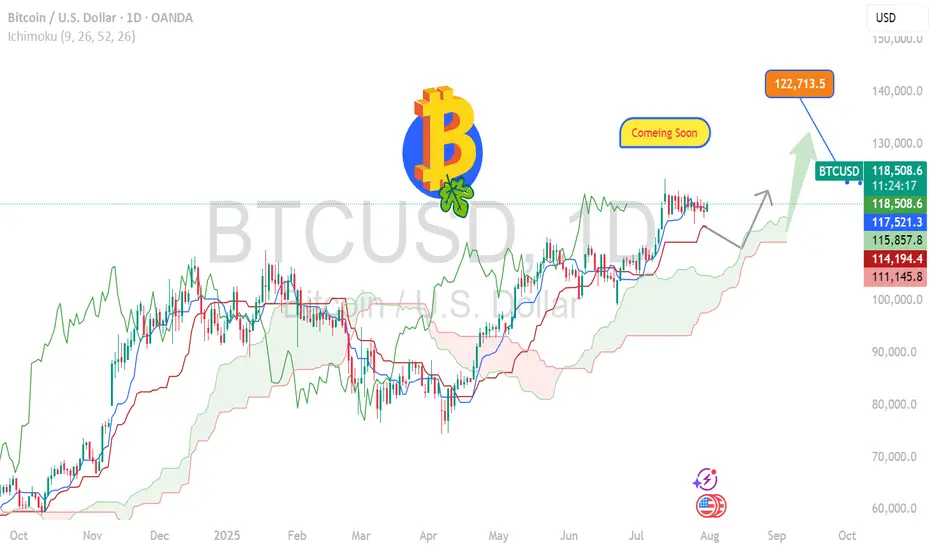
BITCOIN- Charging Towards 122k Momentum Building BTC/USD Long Setup – Targeting 122K 🔥
Bitcoin is holding strong above 118500, signaling bullish momentum.
✅ Price broke key resistance & forming higher lows.
🟢 Current structure favors buy-side continuation with next major target at 122000.
Support Zones:
🔹 117800 – intraday bullish retest
🔹 116500 – strong demand zone
Resistance Ahead:
🔸 120200 – short-term reaction
🔸 122000 – major target
🚀 Expecting bullish wave continuation.
If momentum sustains above 118K, 122K breakout highly probable!
#BTC #Bitcoin #CryptoSetup #BTCUSD #CryptoTrading #BTC122K #ChartAnalysis #BullishBreakout
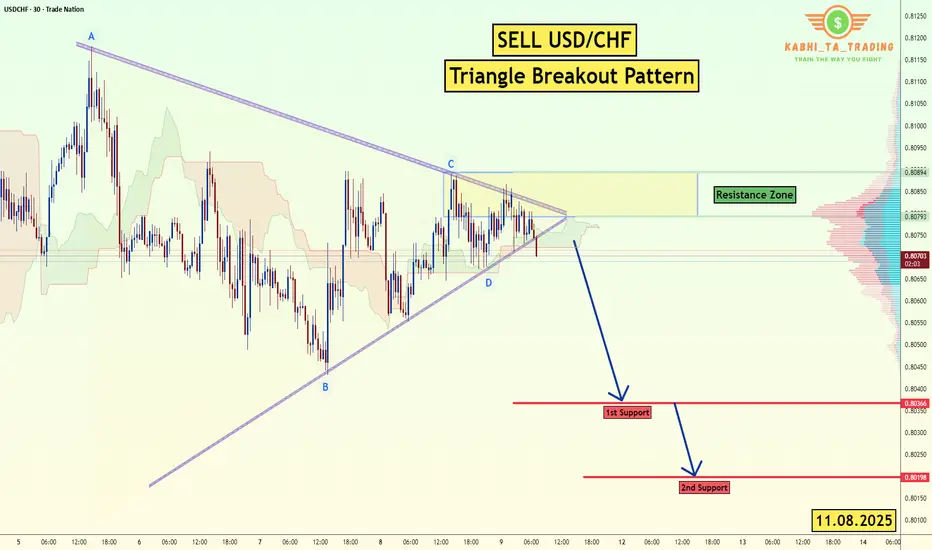
USD/CHF - Triangle Breakout (11.08.2025)The USD/CHF Pair on the M30 timeframe presents a Potential Selling Opportunity due to a recent Formation of a Triangle Breakout Pattern. This suggests a shift in momentum towards the downside in the coming hours.
Possible Short Trade:
Entry: Consider Entering A Short Position around Trendline Of The Pattern.
Target Levels:
1st Support – 0.8036
2nd Support – 0.8019
🎁 Please hit the like button and
🎁 Leave a comment to support for My Post !
Your likes and comments are incredibly motivating and will encourage me to share more analysis with you.
Best Regards, KABHI_TA_TRADING
Thank you.
Disclosure: I am part of Trade Nation's Influencer program and receive a monthly fee for using their TradingView charts in my analysis.