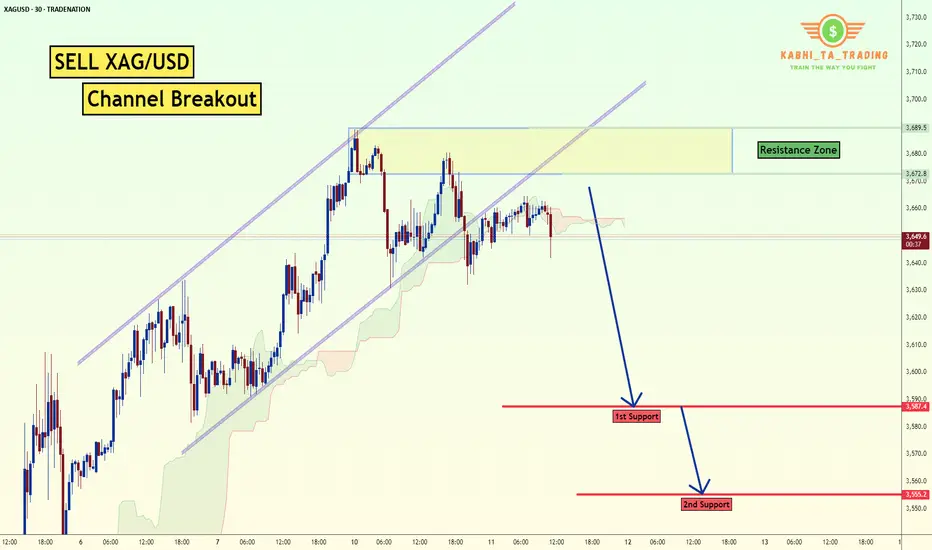
XAG/USD - Channel Breakout (11.06.2025) The XAG/USD Pair on the M30 timeframe presents a Potential Selling Opportunity due to a recent Formation of a CHannel Breakout Pattern. This suggests a shift in momentum towards the downside in the coming hours.
Possible Short Trade:
Entry: Consider Entering A Short Position around Trendline Of The Pattern.
Target Levels:
1st Support – 3587
2nd Support – 3555
🎁 Please hit the like button and
🎁 Leave a comment to support for My Post !
Your likes and comments are incredibly motivating and will encourage me to share more analysis with you.
Best Regards, KABHI_TA_TRADING
Thank you.
Disclosure: I am part of Trade Nation's Influencer program and receive a monthly fee for using their TradingView charts in my analysis.
Analysis
Gold Extends Gains Post-CPI | All Eyes on PPI for the Next Move XAUUSD – Gold Extends Gains Post-CPI | All Eyes on PPI for the Next Move
🌍 Macro Pulse: CPI Sparks Momentum, But Will PPI Sustain It?
Gold surged following softer-than-expected US inflation data on Tuesday, with the CPI rising just 0.1% MoM and 2.4% YoY—both below forecasts. This triggered a broad sell-off in the USD, a pullback in Treasury yields, and a renewed appetite for non-yielding safe havens like gold.
Markets are now increasingly pricing in a rate cut by the Fed in September, adding further fuel to the rally. However, Wednesday’s US PPI data could either reinforce this bullish sentiment or reverse it sharply.
📉 Technical Landscape – H1 & H4 View
🔹 Trend Bias
The bullish structure remains intact, with price carving out higher highs and higher lows since the 3312 level. The recent breakout above 3370 confirms bullish momentum.
🔹 Price Channels
Gold continues to track within a defined ascending channel. A potential retest of the lower trendline near 3345–3350 could provide a dip-buying opportunity.
🔹 EMA Structure
The price trades comfortably above the 13, 34, 89, and 200 EMAs.
Short-term EMA crossovers are supportive of continued upside.
🔹 Critical Resistance Ahead: 3392 – 3395
A key technical zone combining Fibonacci extension levels and recent rejection wicks. A decisive break or rejection here will set the tone for the next 48 hours.
🧠 Market Psychology & PPI Scenarios
The market is currently optimistic, but still cautious. The PPI report due later today will likely serve as the next directional trigger:
If PPI prints below estimates → reinforces disinflation narrative → potential breakout above 3,400 with upside targets towards 3,420+.
If PPI comes in hot → raises concerns about sticky input costs → possible short-term reversal or consolidation.
Expect volatility to spike during the New York session.
🎯 Today’s Tactical Trade Setups – 12 June
🟢 Buy Zone: 3324 – 3322
Stop Loss: 3318
Take Profit Targets: 3330 – 3334 – 3338 – 3342 – 3346 – 3350
🟢 Buy Scalp Zone: 3337 – 3335
SL: 3330
TPs: 3341 – 3345 – 3350 – 3354 – 3360 – 3370 – 3380
🔴 Sell Zone: 3392 – 3394
Stop Loss: 3398
Take Profit Targets: 3388 – 3384 – 3380 – 3375 – 3370 – 3360 – 3350
✅ Final Take
Gold bulls are in control, but the PPI data will likely dictate whether momentum continues or stalls. With key resistance just ahead and macro risk on the table, this is not the time to trade blindly.
🧭 Strategy Tip: Let price confirm the reaction to PPI. Don’t pre-position into volatility. Play the breakout or the fade—but wait for clarity.

Gold Coiling in Rising Wedge Ahead of CPI: Breakout Imminent?XAUUSD – Gold Coiling in Rising Wedge Ahead of CPI: Breakout Imminent?
Gold (XAUUSD) is compressing within a well-defined rising wedge pattern on the 1H chart, signaling that a decisive move is near. With the U.S. CPI report due on June 12th, traders should prepare for volatility driven by macroeconomic catalysts. Whether gold breaks higher or reverses depends on how the market digests inflation data.
🌍 Macro Backdrop: All Eyes on Inflation
📌 U.S. CPI (June 12): A softer-than-expected reading could revive Fed rate cut expectations and send gold higher. A hotter-than-expected CPI could strengthen the U.S. dollar and Treasury yields, putting pressure on gold.
📌 U.S.–China Trade Sentiment: Diplomatic progress in trade talks reduces safe-haven demand in the short term, weakening gold's defensive appeal.
📌 DXY & Bond Yields: A breakout in DXY or a sharp rise in U.S. bond yields post-CPI may lead to a corrective leg lower in XAUUSD.
📈 Technical Overview – Multi-Layered Structure
Pattern: Gold is forming a rising wedge between higher lows and converging highs, typical of breakout scenarios.
Fibonacci Levels (retracement from 3,400 to 3,296):
0.382: 3,336 – intermediate support
0.618: 3,360 – significant resistance, near current swing highs
Moving Averages:
Price is currently above EMA34 and EMA89
Struggling below EMA200 (red), which acts as dynamic resistance
FVG Liquidity Zone: An open Fair Value Gap between 3,360 – 3,374 could act as a magnet before any reversal.
🎯 Trade Strategy Scenarios
🟢 Buy Scenario – Bounce from Support Zone
Entry: 3314 – 3312 | Stop-Loss: 3308 | Take-Profit: 3318, 3322, 3326, 3330, 3335, 3340
Ideal if CPI comes in lower than expected or aligns with a bullish technical rejection from wedge support.
🔴 Sell Scenario – Rejection from Resistance Zone
Entry: 3374 – 3376 | Stop-Loss: 3380 | Take-Profit: 3370, 3366, 3362, 3358, 3352, 3348, 3340
Valid if price taps into the upper liquidity zone (3,374–3,394) and fails to break, especially on CPI surprise to the upside.
🧠 Tactical Conclusion
A dovish CPI → favors BUY setup off lower wedge support
A hawkish CPI → favors SELL near upper resistance and liquidity zones
📌 The market is compressing and gearing up for a breakout. Patience is key — wait for confirmation at key zones and manage risk precisely.

Gold (XAU/USD) Intraday Outlook – 12 June 2025Current Price: ~$3,373 (intraday) –
Gold is holding near recent highs after a sharp rally. Bullish momentum has improved markedly, fueled in part by favorable fundamentals (soft US CPI and geopolitical tensions lifting safe-haven demand)
On the charts, the short-term trend is upward, with buyers firmly in control following a breakout above prior resistance.
4H Trend & Key Levels
4H chart highlighting break of structure, demand (green) and supply (red) zones, and key intraday levels. Note the major demand zone that held around 3,214 (green) and the supply zone near 3,284 (red) which was a focal resistance. The 50% retracement of the prior day’s range (blue line near 3,274) acted as intraday resistance in that earlier session
Such annotations show where institutional activity likely set support (demand) and resistance (supply) areas. On the 4-hour chart, gold’s momentum is strongly bullish. The recent surge to 3375 pushed price above its 10-day moving average and widened the upper Bollinger Bands on both H1 and H4 – signs of a powerful uptrend. This came after gold cleared a major resistance around the $3,350 zone, which had capped prices earlier. With that barrier broken, the next upside target on the higher time frame is the $3,400 level (a notable psychological and technical hurdle)
In fact, it can be projected that a clean breakout above the ~3,380/3,390 zone could open the path toward $3,403 and even $3,430 in extension
Reflecting the next supply areas or Fibonacci extension targets above. Support levels on the 4H are stepping up as the trend rises. Previously, $3,320 (the last day’s high in late May) turned from resistance into support after the breakout. Now, immediate support is seen around $3,345–3,350, which corresponds to the top of the recent consolidation and roughly the 38.2% Fibonacci retracement of this week’s rally
Below that, the $3,330–3,335 zone (around the 61.8% retracement of the rally) is a secondary intraday support area
These levels also align with prior demand zones and the previous day’s lows, making them likely zones where buyers might step in on dips. Overall, as long as gold holds above the mid-$3,300s, the 4H bias remains bullish. The 4H structure shows higher highs and higher lows, and technical signals (price above short-term EMAs and an improving RSI) reinforce the short-term bullish outlook
Educational Note: In an uptrend, old resistance often becomes new support. Here $3,350 was a major resistance in the past and could serve as support if prices pull back. Traders also watch Fibonacci retracement levels within the up-move for potential bounce points – for gold, the 35-50% retracement zone of the latest swing (approximately $3,350 down to $3,330) is viewed as an attractive “buy-the-dip” area intraday.
On the 1-hour chart, gold has been oscillating upward within a rising channel. After each push higher, it has formed brief consolidations or bull flags that resolved to the upside.
For example, after the strong push to ~3375, price coiled in a classic bull flag pattern, hinting at momentum building for another breakout. This pattern of consolidation after a rally shows healthy bullish behavior – buyers pausing before continuing the move. Higher lows (HL) and higher highs (HH) are clearly present, indicating a steady uptrend structure on the 1H
In fact, gold’s price action has been “taking out liquidity then taking out highs and creating new highs,” leaving no sign of bear control so far. This means each time the price dips and grabs some stop-loss liquidity from weak longs, it quickly reverses and surges to a fresh peak – a hallmark of a strong trend supported by larger players. From an SMC perspective, we can spot where institutional traders may be active. Recently, gold retested a major demand zone in the low $3,300s and rocketed higher. Specifically, price dipped to about $3,297 (just below a prior support), which appears to have been a liquidity grab (fake-out) below the obvious support level
Smart money often drives price briefly below such a level to trigger stop-losses, then buys into that liquidity. Indeed, a strong bullish rejection off $3,297-3,300 occurred, indicating aggressive buying (accumulation) by big players at that historical support
This confirmed a solid demand zone, and bulls defended it vigorously – a clear sign that institutional demand underpins that area. After the fake-out and bounce, gold quickly resumed making higher lows, confirming the uptrend’s resumption. Now, the focus shifts to the overhead supply zone. Gold is trading just below $3,380–3,390, a zone that previously acted as major intraday resistance.
In past attempts, price sharply sold off from this area, suggesting it’s a pocket of supply (sell orders) or profit-taking for institutions. This makes $3,380-$3,390 a key decision point: if bullish momentum is strong enough to drive a clean break through this supply, we could see a swift move higher (as mentioned, targets in the low $3,400s become viable)
However, if gold struggles and prints bearish signals (e.g. aggressive wick rejections or a change in character to lower lows on 15m/1H) near 3380-3390, it may indicate that sellers are defending this zone again, potentially causing a pullback. Traders are watching closely to see if smart money will cap the price here or let it run. It’s worth noting that intraday liquidity has built up around certain levels. Minor equal highs around $3,375-3,377 were taken out earlier (as gold hit a weekly high of ~$3,377) ,and now liquidity might reside just above $3,390 (at buy stops of breakout traders) and below $3,340 (sell stops of longs). The path of least resistance intraday appears upward unless those lower support levels start breaking. As long as gold remains inside this rising structure, the bias is to buy dips rather than sell rallies. Only a clear break below the $3,337–3,340 support (recent range floor) would hint at a short-term trend shift down. Until then, bulls are in charge. Educational Note: Order blocks and supply/demand zones are areas where price saw a sharp move, indicating institutional orders. In gold’s case, an H1 demand block near $3,300 (origin of the recent rally) is such an area – price dipped into it and then launched higher
Conversely, the $3,380-$3,390 area is a supply zone from which price fell previously.
Watching price behavior at these zones (e.g. strong rejection vs. breakthrough) gives clues: a heavy rejection implies continued range or reversal, while a breakthrough suggests a new leg of trend.
Trade Setups
Buy on Dip (Bullish Setup):
If gold retraces into the $3,345–3,355 support zone, consider a long entry near ~$3,350 (a key Fibonacci support & prior breakout level)
A suggested stop-loss is just below $3,335 (to stay under the 61.8% retracement and recent swing low). Target the $3,375 area for partial profits, and $3,385–3,390 if momentum continues. This buy-on-dips approach aligns with the prevailing uptrend – as one analyst noted, “Gold below 3350 is an opportunity to buy on dips”
(Rationale: You’re buying at support in an uptrend, aiming for a retest of the highs.)
Sell Near Resistance (Bearish Setup):
If gold rallies toward the $3,390–3,400 zone but shows rejection (stalling candles or a bearish reversal pattern) at that resistance, one can consider a short entry around ~$3,395. Place a tight stop-loss above $3,405 (just beyond the major resistance). Target a pullback to about $3,370 first, and $3,350 on an extended drop. This trade fades a possible near-term top in case the supply zone holds. For instance, a suggested plan from another analyst was to “sell around 3397–3400” with stops above 3409, looking for a move back to the mid-$3,300s
(Rationale: You’re selling at an identified supply zone, expecting a short-term correction.)
Breakout Scenario:
For traders who prefer momentum plays, watch $3,380 on the upside and $3,340 on the downside. A 1H candle close beyond $3,380 with strong volume would confirm a breakout – you could then target ~$3,405 and above (trail stops as it goes)
Conversely, a drop below $3,340 might signal a bearish intraday reversal, opening downside targets near $3,315 and $3,300
If trading the breakout, ensure confirmation (no fake-outs) – wait for a retest if possible, and then ride the move. (This scenario is only for when price definitively exits the current range.)
Remember: The intraday trend is bullish, so lean toward long setups unless key supports break. Keep it simple – trade the price action you see. Gold can be volatile, so it's wise to use stop losses and not over-leverage. Happy trading! 📈✨

PIXEL 1D. High-Risk, High-Reward Setup. Here's the Play. 06/11BINANCE:PIXELUSDT
Entry opportunity for the bold.
EP (Entry Point): 0.04215$ – 0.04020$
TP (Take Profit):
1️⃣ 0.14072$
2️⃣ 0.16076$
SL (Stop Loss): 0.02280$ or according to your personal risk management.
❗️No stop loss on spot — manage accordingly.
DYOR. Always know your risk.

HelenP. I Gold may bounce from trend line to resistance levelHi folks today I'm prepared for you Gold analytics. After observing this chart, I see that the price tried to grow to the resistance level first, but failed and dropped to the support level, which coincided with the buyer support zone. After this correction movement, XAU rebounded up and then dropped below the support level, breaking it. But soon, price turned around and made impulse up, breaking the 3265 level, after which it continued to move up to the resistance level. When Gold reached this level, it entered to resistance zone, where it turned around at once and made a strong movement down to the trend line, breaking two levels. Also then it started to trades inside a triangle, and soon turned around from the trend line and made a strong impulse up. Price broke the 3265 support level one more time, rose a little more, and then made a correction. After this, price continued to move up and soon reached the 3395 resistance level, after which it turned around and fell to the trend line, which is the support line of the triangle as well. Recently, it started to grow, so I expect that XAUUS will correct to the trend line and then continue to move up to the resistance level. That's why the 3395 resistance level is my current goal. If you like my analytics you may support me with your like/comment ❤️
Disclaimer: As part of ThinkMarkets’ Influencer Program, I am sponsored to share and publish their charts in my analysis.

Bitcoin will rise from support level and exit from wedgeHello traders, I want share with you my opinion about Bitcoin. This chart shows how the price rebounded from the current support level and then turned around and rebounded up. Price broke the 109000 level, coinciding with a support area, and then traded near this level for some time. Later price turned around and started to decline inside a downward channel, where it soon broke the 109000 level, reached the resistance line, and continued to fall next. Bitcoin fell to the support line of the channel, which coincided with the 103000 support level and buyer zone, after which it rebounded up. Then BTC exited from channel and later entered to upward wedge, where it at once made a correction movement from the resistance line to the support line, breaking the 103000 level. But soon, price made an impulse up, breaking the support level one more time. Next, it rose to the current support level, broke it too, and now trades inside the support area. In my mind, BTC can rebound from the support level and rise to the resistance line of the wedge. Then it can break this line, thereby exiting from the wedge and continuing to move up; therefore, I set my TP at 112000 points. Please share this idea with your friends and click Boost 🚀

Dollar Index Eyes FVG Breakout Ahead of CPIDXY 11/06 – Dollar Index Eyes FVG Breakout Ahead of CPI | Reversal Risk After 100.31?
The US Dollar Index (DXY) continues to consolidate within a rising channel on the H2 timeframe, with price tightening just ahead of a key macro event — the US CPI report. DXY is now approaching a critical Fair Value Gap (FVG) zone, where liquidity hunts and potential reversals become highly probable.
🌐 MACRO OUTLOOK & MARKET SENTIMENT
📌 US CPI (June 12):
The main macro driver for DXY this week.
A hotter-than-expected print → strengthens the Fed’s hawkish stance → DXY likely to spike.
A weaker-than-expected CPI → boosts rate cut expectations → downside pressure on DXY.
📌 Risk Sentiment:
Institutions are readjusting their exposure ahead of CPI and FOMC. This has caused DXY to hover near EMA89 — a sign of indecision.
📌 Cross-asset Flows (Bonds & Gold):
Treasury yields are stable, but surprises in CPI could lead to capital rotation between gold and USD, increasing volatility in XAUUSD and DXY simultaneously.
📈 TECHNICAL ANALYSIS
Trend Structure:
DXY is following a clean ascending channel on H2, with higher lows respecting the lower trendline.
EMA Confluence (13–34–89–200)
Price is consolidating near EMA89 and below EMA200 (99.40), forming a neutral short-term bias.
A clean breakout above EMA200 could trigger acceleration into the FVG zone.
Key FVG Zone (H2):
99.63 – 100.31 is an unfilled Fair Value Gap.
This zone may act as a magnet for price before any meaningful rejection or breakout.
Potential Reversal Area:
A rejection at 100.31 could trigger a sharp pullback toward the liquidity zone around 98.68.
🧠 STRATEGIC OUTLOOK
CPI will set the tone for DXY’s mid-term trend.
Watch the 99.63 – 100.31 FVG zone for liquidity sweeps and potential rejection.
Wait for confirmation, not prediction — especially in macro-sensitive environments.

Baby Doge is ready for a pumpBaby Doge is ready for a pump, but I feel it needs to form an inverse head and shoulders pattern and experience a price surge.
Set a buy order.

Bitcoin: Firm supports, play the breakout or dip ahead of CPI__________________________________________________________________________________
Technical Overview – Summary Points
__________________________________________________________________________________
Structurally bullish momentum across all timeframes. No bearish divergence or signs of capitulation detected.
Major supports: 108,291.5; 106,743.9. Key resistances: 109,997.81; 111,949.
Normal volume, robust buying dynamics without climax, no excess in the flows.
Risk On / Risk Off Indicator : “ Strong Buy ” signal from 1D to 1H; only M15 is neutral (micro-consolidation).
No exhaustion or massive profit-taking behaviour. ISPD DIV neutral across all timeframes.
__________________________________________________________________________________
Strategic Summary
__________________________________________________________________________________
Overall bias: Structurally bullish, strong momentum, no imminent major reversal. Possible consolidation ahead of US CPI.
Risk zones: 109.9k–111.9k (historic resistance), key macro event June 11 (CPI).
Catalysts: US inflation figures (CPI), Fed speeches, low implied BTC option volatility.
Action plan: Buy on retracement towards 108.2k/106.7k, or confirmed breakout >111.9k; technical stops below 108.2k & 106.7k; trim risk before CPI if actively managing.
__________________________________________________________________________________
Multi-Timeframe Analysis
__________________________________________________________________________________
1D: Approaching historic resistance, “very strong” trend, no weakness detected.
12H/6H/4H: Strong buying pressure, full indicator alignment, close to a break/rejection at 110–111k.
2H/1H: Persistent intraday momentum, no bearish alert, moderate to dynamic volumes (notably 2H).
30min: Healthy trend, buying pressure, no sign of topping out. Squeeze scenario possible if broken.
15min: Neutral phase, micro-consolidation with supported volume, swift resumption possible post-break resolution.
Risk On / Risk Off Indicator: Strong Buy on all timeframes except 15min (neutral/short pause).
ISPD DIV: Neutral everywhere, environment supports bullish trend continuation.
Volumes: Normal to moderate, no distribution alert or bull trap detected.
__________________________________________________________________________________
Strategic Recap
__________________________________________________________________________________
Primary trend: Structurally bullish, strong multi-timeframe confluence.
Key signal: Accumulation on support, breakout/extension to be considered only on significant volume.
Opportunity: Entry on technical pullback (108.2k/106.7k) or confirmed breakout (>111.9k), swing target 115.4k
Critical risks: US CPI release, extended resistance, hidden volatility
Risk management: Stop below 108.2k/106.7k, reduce cash risk ahead of macro events as needed.
Summary: As long as 108.2k-106.7k support holds, pullbacks are buying opportunities. Strong conviction for upside if 111.9k is broken. Anticipate volatility around US CPI.
__________________________________________________________________________________

THE USD CAD PAIR USD/CAD 1H Chart – Busy with Levels but the Bias is Clear 📊✨
Multiple confluences pointing to bullish intent: trendline support, key demand zones, and clean higher lows. Despite the clutter, price is respecting structure. Watching for a clean break above recent highs to ride the buy-side liquidity sweep. Eyes on 1.38+ 📈
#ForexTrading #USDCAD #SmartMoney #TechnicalAnalysis"

BITCOIN chart updated Bitcoin Buy Signal Triggered ₿🚀
BTC showing strong bullish momentum after holding key support.
Entered long position on breakout above short-term resistance with volume confirmation.
Higher lows forming a solid base — structure favors continued upside.
Targeting the next resistance zone around , with stop loss below recent swing low.
Watching closely for follow-through and potential scaling opportunities.
Market sentiment improving — let's see if the bulls can take control.
#Bitcoin #BTCUSD #CryptoTrading #BuyTheDip #BreakoutTrade #CryptoSetup #BullishBias #PriceAction #TechnicalAnalysis"**

Fundamental Market Analysis for June 11, 2025 GBPUSDThe GBP/USD pair continues to decline to around 1.34750 during Wednesday's Asian trading session. The pound sterling (GBP) is weakening against the US dollar (USD) due to a weaker UK employment report. Later on Wednesday, attention will shift to the US Consumer Price Index (CPI) for May.
The ILO unemployment rate in the UK rose to 4.6% in the three months to April from 4.5% previously, the British Office for National Statistics said on Tuesday. The figure was in line with expectations. Meanwhile, the change in the number of applicants for unemployment benefits in May was 33,100, compared with -21,200 previously (revised from 5,200), which is below the consensus of 9,500.
In addition, average earnings excluding bonuses in the UK rose 5.2% year-on-year (3M YoY) in April, compared with a revised 5.5% increase in the previous reading. The market forecast was 5.4%. Average earnings including bonuses rose 5.3% over the same period after accelerating to a revised 5.6% in the quarter to March. The data fell short of the forecast of 5.5%.
These figures indicate that the UK labor market is losing momentum under pressure from tax increases and the minimum wage hike by the government. This, in turn, may put some pressure on the pound sterling in the near term. “This gradual slowdown in wage growth may reassure the Bank of England after inflation unexpectedly jumped to its highest level in more than a year last month,” said Paige Tao, an economist at PwC UK.
Trading recommendation: SELL 1.34800, SL 1.35100, TP 1.34100

Oil's Volatility Meets Fed's Patience: A Path to 1.3643?USDCAD – Oil's Volatility Meets Fed's Patience: A Path to 1.3643?
🌍 Macro Landscape: Diverging Monetary Paths & Oil's Influence
The USDCAD pair is currently navigating a complex environment shaped by diverging central bank policies and the significant influence of crude oil prices. While the Federal Reserve is signaling a "higher-for-longer" interest rate stance due to sticky inflation, the Bank of Canada (BoC) is in a more nuanced position, balancing inflation control with economic growth. This divergence creates a fundamental tailwind for the USD.
However, Canada's economy is heavily tied to commodity prices, especially crude oil. Recent volatility in oil markets can exert significant pressure on the Canadian dollar. If oil prices remain subdued or face downward pressure, it could exacerbate the CAD's weakness against the USD, amplifying the impact of policy divergence.
🏦 Central Bank Policy Divergence: Fed's Firmness vs. BoC's Caution
Federal Reserve: FOMC members continue to signal patience on rate cuts. Recent inflation data (PCE, CPI) shows persistent price pressure, particularly in the services sector, reinforcing the Fed's hawkish bias. This suggests the USD may retain its strength as higher rates attract capital.
Bank of Canada: The BoC, while having taken aggressive steps previously, might be more cautious in its future rate decisions. Any dovish undertones or hints at pausing rate hikes could weaken the CAD. Conversely, a resurgence in inflation or stronger economic data could prompt the BoC to maintain a firm stance.
This policy divergence, coupled with external factors like commodity prices, creates a fertile ground for significant moves in USDCAD.
🌐 Capital Flows: Safe-Haven Dynamics and Commodity Impact
Global capital flow models indicate a shift towards the US dollar as a preferred safe haven amidst geopolitical tensions and global economic uncertainties. While Gold remains a traditional hedge, the USD's yield advantage makes it an attractive destination for institutional capital.
For CAD, its sensitivity to commodity prices means that capital flows are heavily influenced by the outlook for global growth and energy demand. A softening global economic outlook could lead to reduced demand for commodities, weighing on the CAD, and potentially driving inflows into USD-based assets.
📊 Technical Structure: Channel Breakdown & Bearish Momentum Towards 1.3643
On the H1 chart (as observed from the provided image):
Price Channel: USDCAD has been trading within a clear ascending channel. However, the price recently broke below the lower boundary of this channel, suggesting a potential shift in momentum from bullish to bearish.
Moving Averages: The price has moved below the EMA 13 – 34 – 89. This bearish alignment (EMA "fan-out formation" in reverse) confirms a short-term bearish momentum is building. The 200 EMA (red line) is currently acting as a key resistance level, near the prior support turned resistance.
Key Resistance (Sell Zone): The region around 1.36989 (aligning with previous support and possibly a Fibonacci retracement level) is now acting as a crucial resistance. Any retest of this zone, especially with bearish candlestick patterns, could offer selling opportunities. The 200 EMA reinforces this zone as a strong overhead barrier.
Key Support (Target Zone): The price is projected towards 1.36431. This level aligns with a strong prior support and also coincides with the Fibonacci Extension 1.382 level from a previous swing, making it a high-probability target for bearish moves. A bounce from 1.36734 (a mid-channel support or Fibonacci level) could offer a temporary reprieve, but the overall technical structure points to the lower target.
🎯 Trade Strategy Recommendations
Scenario 1 – Sell the Pullback (Preferred):
Entry: 1.3685 – 1.3695 (retest of broken channel line/resistance near 1.36989, possibly confluence with 200 EMA).
Stop-Loss: 1.3720 (above recent swing high/channel top).
Take-Profit: 1.3673 (initial target) → 1.3643 (main target) → 1.3620.
Scenario 2 – Breakout Momentum Sell (if price consolidates below 1.3673):
Entry: 1.3670 (break below 1.36734 with strong bearish momentum).
Stop-Loss: 1.3690.
Take-Profit: 1.3643 → 1.3620.
⚠️ Key Events to Watch:
US PCE Price Index (upcoming data): If hotter-than-expected, this would reinforce the Fed’s hawkish tone and lift USD.
Canadian CPI (upcoming data): Cooler-than-expected inflation could prompt a more dovish stance from the BoC, weakening CAD.
Crude Oil Inventory/News: Any significant news or data regarding global oil supply/demand can directly impact CAD.

Storm Ahead? Key Level Breakout or Dangerous Reversal!USD/JPY: Storm Ahead? Key Level Breakout or Dangerous Reversal!
Overview:
The USD/JPY pair stands at a crucial crossroads, with technical signals indicating the potential for significant volatility in the near term. Will the Yen regain its footing, or will pressure from the USD continue to push the pair to new highs? This analysis delves into technical, fundamental, and macroeconomic factors to outline potential scenarios and identify key trading zones.
Detailed Technical Analysis:
Primary Trend: The USD/JPY chart clearly shows a short-term uptrend, supported by an ascending trendline (dashed line on the chart) and upward-sloping moving averages (MA). Trend analysis is considered the most important area of technical analysis, and is key to determining the general direction of a security. However, the price is approaching strong resistance zones, suggesting potential selling pressure. Technical analysis is a trading tool used to evaluate stocks and attempt to predict their future movements by analyzing statistical data obtained from trading activity.
Key Price Levels:
Crucial Resistance Zone (SELL Zone): Around 144.894 - 145.178. This is a significant Fibonacci Extension zone (1.13 and 1.236), where the price has reacted in the past and could attract strong selling pressure. If the price breaks and holds above this zone, the uptrend will be confirmed.
Crucial Support Zone (BUY Zone): Around 143.600 - 143.750. This support zone is formed by previous lows and the ascending trendline. If the price corrects to this zone and shows reversal signals, it could be a good buying opportunity. The next support zone is around 142.800. The goal of technical analysis is to determine the buy and sell points of a stock.
Technical Indicators: The MAs (blue, orange, red) maintain a relatively consistent distance and are sloping upwards, supporting the uptrend. However, the convergence of MAs near resistance zones could signal a weakening of upward momentum.
Price Patterns: Currently, the price is forming a pattern similar to a bull flag or an ascending triangle, suggesting a potential continuation of the uptrend if it breaks upwards. Conversely, if the price fails to overcome resistance and breaks the uptrend line, a bearish reversal pattern could form. Wave analysis is a technique based on the observation that markets move in specific patterns called waves.
Relevant Fundamental and Economic Factors:
Macroeconomic Analysis (Japan): The Bank of Japan (BOJ) continues to maintain ultra-loose monetary policy, with negative interest rates and yield curve control. This exerts continuous downward pressure on the Yen. Any signal of change from the BOJ regarding policy will have a significant impact on USD/JPY.
Macroeconomic Analysis (United States): The U.S. Federal Reserve (FED) is still in an aggressive monetary tightening cycle to combat inflation. Inflation reports (CPI, PPI), employment data (NFP), and statements from FED officials will be key drivers for the USD. If U.S. inflation remains high, the FED may continue to raise interest rates, pushing USD/JPY higher. Fundamental analysis focuses on evaluating economic, political, and social factors affecting the value of a currency pair.
Upcoming Economic Events: Closely monitor inflation reports from both the U.S. and Japan, GDP data, unemployment rates, and policy meetings of the BOJ and FED. These events will act as catalysts for sharp movements.
Conclusion and Trading Recommendations:
USD/JPY is in an uptrend but approaching crucial resistance zones.
BUY
Entry: When the price breaks and closes above 145.178, confirming the uptrend continuation. Or when the price corrects to the 143.600 - 143.750 zone and shows bullish reversal candles (e.g., bullish engulfing, hammer).
Take Profit: Higher Fibonacci levels (e.g., 1.382 at 145.491 or 1.5 at 145.918).
Stop Loss: Below the nearest support zone, e.g., below 143.500 if buying at support, or below 144.800 if buying after a resistance breakout.
SELL Scenario:
Entry: When the price approaches the 144.894 - 145.178 zone and strong bearish reversal signals appear (e.g., Gravestone Doji, bearish engulfing, double top pattern).
Take Profit: Lower support levels, e.g., 143.700, 142.800.
Stop Loss: Above the resistance zone, e.g., above 145.300.
Risk Disclaimer: Financial markets always involve high risks. Always manage your capital carefully and never trade with money you cannot afford to lose. This analysis is for informational purposes only and not investment advice.

A Detailed Technical, Fundamental, and Macro AnalysisNZD/USD Trading Plan: A Detailed Technical, Fundamental, and Macro Analysis
1. Technical Analysis:
The 30-minute chart of NZD/USD highlights key price action within a well-defined channel between crucial support and resistance levels:
Resistance (0.60769): The price is testing significant resistance around 0.60769. If this level is broken, the price could continue higher, indicating further upward momentum.
Support (0.60271): A strong support level is found at 0.60271. If the price retraces and holds this level, a potential rebound could take place.
EMA (Exponential Moving Averages):
EMA 13 (Blue): Currently moving upwards, confirming a bullish short-term trend.
EMA 34 (Yellow) and EMA 89 (Red): These are trending sideways, suggesting that the market is in a consolidation phase, waiting for further signals.
2. Fundamental Analysis:
FED's Monetary Policy: The actions and statements of the Federal Reserve regarding interest rates have a significant impact on the USD. If the FED maintains or hikes rates, this could push the USD higher, putting downward pressure on NZD.
New Zealand Economic Indicators: The strength of New Zealand's economy, particularly export data, plays a vital role in supporting or weakening the NZD. Positive economic reports could support a bullish NZD.
3. Macroeconomic Analysis:
Global Risk Sentiment: Market sentiment is being influenced by global factors like trade tensions, economic growth projections, and political factors. A shift in risk sentiment, especially regarding the U.S. economy or geopolitical tensions, could lead to significant price movements in the NZD/USD pair.
4. Buy and Sell Zones:
BUY ZONE:
Entry: 0.60271 - 0.60300
SL (Stop Loss): 0.60200
TP (Take Profit): 0.60700 → 0.60769 → 0.60900
SELL ZONE:
Entry: 0.60750 - 0.60800
SL: 0.60900
TP: 0.60300 → 0.60200 → 0.60100
5. Strategy:
Buy Orders: If price consolidates at the support level of 0.60271 and shows confirmation with EMA indicators, consider a buy with a target at 0.60769.
Sell Orders: If price fails to break through the resistance at 0.60769, a sell order could be placed, targeting the 0.60271 support level.
6. Market Sentiment:
The market is highly sensitive to news and economic reports, and therefore, it is essential to remain alert to potential volatility. Any major economic release from New Zealand or U.S. Federal Reserve news could significantly influence the pair.

EURO - Price will strart to grow and exit from wedge patternHi guys, this is my overview for EURUSD, feel free to check it and write your feedback in comments👊
Price entered to wedge pattern and at once dropped below $1.1455 level, breaking it and then some time traded below.
It continued to decline and in a short time reached $1.1220 level and broke it, after which fell to support line.
Then price started to grow and soon broke $1.1220 level one more time, after which made a retest and continued to grow.
Euro rose to $1.1420 points and then corrected to support level, after which turned around and rose to resistance level.
Recently price reached resistance level, but then it bounced and started to decline, and now it continues to fall.
I think that Euro can decline a little more and then bounce up to $1.1550, exiting from wedge.
If this post is useful to you, you can support me with like/boost and advice in comments❤️
Disclaimer: As part of ThinkMarkets’ Influencer Program, I am sponsored to share and publish their charts in my analysis.

GOLD - Price can continue to fall to bottom part of flatHi guys, this is my overview for XAUUSD, feel free to check it and write your feedback in comments👊
Some days ago price grew inside a rising channel, where it reached $3050 level and then broke it.
After this, price reached resistance line of channel and then made a correction to support line and then made an upward impulse.
Next, price exited from channel and continued to grow to $3430 level and even rose higher, but soon turned around.
Price made a fake breakout of this level and then started ot trades inside a flat, where it fell to bottom part.
Also, it made a gap, and later Gold started to grow to a resistance area, and when it reached this area, it bounced down.
At the moment, I expect that Gold will grow to resistance area and then drop to $3135 bottom part of flat.
If this post is useful to you, you can support me with like/boost and advice in comments❤️
Disclaimer: As part of ThinkMarkets’ Influencer Program, I am sponsored to share and publish their charts in my analysis.

HelenP. I Gold may break support level and continue to move downHi folks today I'm prepared for you Gold analytics. Observing this chart, we can see how the price reached support 2, which coincided with the support zone and tried to break it, but failed and dropped below. Then Gold turned around and made an impulse up, broke firstly 3125 level first and then reached support 1 and broke it too. After this movement, Gold continued to grow and reached the trend line, after which it started to decline inside a triangle pattern, where it first fell below support 1, making a first gap. Next, Gold tried to back up, but failed and dropped to support 2, after which it started to grow. In a short time, XAU rose to support 1, broke it, and some time traded between this level. Not long time ago, it rose to the trend line, which is the resistance line of a triangle as well, and then fell to the resistance zone. So, I expect that XAUUSD will break the support level and then continue to fall, thereby exiting from triangle too. For this case, I set my goal at 3225 points. If you like my analytics you may support me with your like/comment ❤️
Disclaimer: As part of ThinkMarkets’ Influencer Program, I am sponsored to share and publish their charts in my analysis.

1,505% from $0.20 to $3.21 on massive 1+ Billion volume $KLTOWOW 🤯 1,505% from $0.20 to $3.21 on massive 1+ Billion shares traded 🚀 NASDAQ:KLTO
I sent out 2 Buy Alerts for everyone to get paid nicely ✅
This will trigger more runners, premarket already got movers NASDAQ:MEGL , NASDAQ:MRIN , NASDAQ:EVGN

WILL GOLD CONTINUE ITS RALLY OR FACE A MAJOR CORRECTION? XAUUSD – WILL GOLD CONTINUE ITS RALLY OR FACE A MAJOR CORRECTION?
Gold is at a pivotal point after experiencing a significant correction following its recent rally. With the market showing mixed signals, the question now is whether gold will continue its upward trajectory or experience further corrections before breaking new highs. The current global economic climate, combined with macroeconomic factors, will be the driving forces behind gold's next move.
🌍 MACROECONOMIC OUTLOOK & MARKET SENTIMENT
US Dollar Strength: The USD has been strengthening, which has put some pressure on gold prices. However, this comes amid uncertainty in global trade relations, particularly between the US and China, which is creating mixed market sentiment. Gold remains a key asset for hedging against currency risks and geopolitical tensions.
Federal Reserve's Stance on Interest Rates: The Fed has signaled that while inflation remains a concern, it’s unlikely to cut interest rates in the near future. This could limit gold's upside potential in the short term, but the metal remains attractive due to its safe-haven status.
Geopolitical Tensions: With ongoing concerns over US-China trade talks and tensions surrounding Ukraine, investors continue to flock to gold as a hedge against political and economic instability. These external pressures continue to fuel demand for gold.
📈 TECHNICAL ANALYSIS (H1 – EMA 13/34/89/200)
Current Correction: Gold has been correcting after a strong surge, testing key support levels like 3300. On the H1 timeframe, the EMA indicators suggest consolidation and weakness, signaling that further pullbacks are possible before any potential breakout.
Technical Pattern – "Flag" Formation: Gold is forming a bearish flag pattern, indicating a temporary pause after a strong upward trend. This pattern suggests that gold might continue to trade sideways, with a breakout above key resistance levels leading to a continuation of the uptrend.
Key Resistance and Support Levels: Gold is facing significant resistance levels at 3320 and 3330, while key support levels at 3300 and 3270 will be crucial to watch in the coming sessions.
📍 KEY LEVELS TO WATCH
Resistance Levels: 3320 – 3330 – 3338 – 3350 – 3360
Support Levels: 3300 – 3270 – 3250
🧭 RECOMMENDED TRADE SETUPS
🔵 BUY ZONE: 3270 – 3272
SL: 3265
TP: 3280 → 3300 → 3320 → 3330 → 3350
🔻 SELL ZONE: 3320 – 3325
SL: 3330
TP: 3310 → 3295 → 3280 → 3265
✅ SUMMARY
Gold is currently experiencing a correction after a solid rally, but the long-term outlook remains bullish. Macro-economic factors, including the Fed’s policies and geopolitical risks, are likely to drive gold prices higher in the future. However, short-term fluctuations should be expected as the market tests key resistance and support levels.
Traders should focus on well-defined entry and exit points within these key levels and maintain a disciplined risk management strategy.

Fundamental Market Analysis for June 10, 2025 EURUSDAn Event to pay attention today:
13:00 EET. USD - NFIB Small Business Optimism Index
EURUSD:
The EUR/USD pair is struggling to capitalise on the previous day's gains and is attracting new sellers around 1.1435 during Tuesday's Asian session. The intraday decline is driven by solid demand for the US dollar (USD) and has pushed spot prices below 1.1400 in the last hour.
Friday's US non-farm payrolls (NFP) report, which showed higher-than-expected data, dampened hopes for an early interest rate cut by the Federal Reserve (Fed) this year. This, along with optimism about the resumption of trade talks between the US and China, is prompting traders to ease their bearish bets on the US dollar, which is proving to be a key factor putting pressure on the EUR/USD pair. However, as negotiations continued into a second day in London, traders may refrain from aggressive directional bets.
In addition, traders still see a rate cut by the US central bank in September as more likely. This, along with concerns about the financial health of the US government, may limit further strengthening of the US dollar and provide support for the EUR/USD pair. In contrast, the European Central Bank (ECB) hinted at the end of its rate-cutting cycle at its meeting last week. This could further benefit the single currency and help limit losses for the currency pair.
Traders may also refrain from aggressive betting ahead of this week's US inflation data release.
Trading recommendation: SELL 1.1390, SL 1.1410, TP 1.1300

USD/CAD - Channel Breakout (10.06.2025)The USD/CAD pair on the M30 timeframe presents a Potential Buying Opportunity due to a recent Formation of a Channel Breakout Pattern. This suggests a shift in momentum towards the upside and a higher likelihood of further advances in the coming hours.
Possible Long Trade:
Entry: Consider Entering A Long Position around Trendline Of The Pattern.
Target Levels:
1st Resistance – 1.3757
2nd Resistance – 1.3792
🎁 Please hit the like button and
🎁 Leave a comment to support for My Post !
Your likes and comments are incredibly motivating and will encourage me to share more analysis with you.
Best Regards, KABHI_TA_TRADING
Thank you.
Disclosure: I am part of Trade Nation's Influencer program and receive a monthly fee for using their TradingView charts in my analysis.
