Bitcoin - Showing strength as it breaks key resistance levels!Bitcoin (BTC) recently demonstrated impressive strength by bouncing off a well-known confluence zone consisting of the golden pocket and a 4-hour fair value gap (FVG) around the $100,000 level. This technical area has historically acted as a reliable support and once again proved its significance, offering a solid foundation for the current rally.
Following this bounce, BTC surged to $108,000, decisively breaking above the 4-hour FVG near $107,000. With this breakout, the previously resistant zone is now expected to flip into support, adding further confidence to the bullish outlook. This type of price action is often seen in strong uptrends, where key resistance levels are reclaimed and converted into support, providing a base for further upside.
Importantly, BTC has also managed to push through the golden pocket resistance, a critical Fibonacci retracement area closely watched by traders. This breakout, in conjunction with the 4H FVG clearance, clears the path for a potential continuation toward Bitcoin’s all-time high.
Momentum is clearly building. Buying pressure is strong, and retracements have been shallow, indicating a market dominated by demand. While this is a bullish sign, a brief pullback or bounce off the newly formed support (the 4H FVG zone) would be healthy. Such a move would allow BTC to consolidate and build strength before potentially pushing toward new highs.
Overall, the technical landscape looks increasingly favorable for BTC. As long as it holds above the reclaimed support zones, the path to retesting, and possibly surpassing, the all-time high appears wide open.
Thanks for your support.
- Make sure to follow me so you don't miss out on the next analysis!
- Drop a like and leave a comment!
Analysis

WILL EUR CONTINUE TO RALLY AHEAD OF THE IMPORTANT NFP DATA?EUR/USD – WILL EUR CONTINUE TO RALLY AHEAD OF THE IMPORTANT NFP DATA?
📈 EUR/USD IS AT A CRITICAL POINT AHEAD OF KEY ECONOMIC DATA
Amid the ongoing pressure on the US Dollar and macroeconomic factors supporting the Euro, EUR/USD might continue its short-term bullish trend. However, key data such as US CPI and central bank meetings could determine the direction for this currency pair moving forward.
🌍 Macroeconomic Overview & Market Sentiment
USD & DXY: The US Dollar continues to weaken due to signals from the Federal Reserve (Fed) that they are not in a hurry to cut interest rates. DXY has fallen below the 99 level, with macroeconomic factors showing a continued bearish trend for the USD.
Eurozone: The ECB (European Central Bank) is maintaining a slightly tight monetary policy. However, the Eurozone economy is showing signs of recovery, with positive data from the region.
US Economy: Forecasts for the US labor market data could impact the USD and lead to volatility in the EUR/USD pair. All attention is on the reports from the US this week.
📊 Technical Analysis (H1 – H4 – D1)
EMA 13/34/89/200: The EMA indicators on the H1 and H4 timeframes support the current bullish trend for EUR/USD in the short term. In particular, the EMA 13 and EMA 34 are crossing above the EMA 200, signaling a strong upward trend.
Wave Structure: EUR/USD is currently in a corrective wave after testing the strong resistance level at 1.1450. A recovery signal is emerging around the support level at 1.1380, which could present a buying opportunity in the short term.
Fibonacci Expansion: The Fibonacci extension levels at 1.1470 and 1.1490 could be the next targets if EUR/USD breaks through the 1.1400 resistance zone.
⚡ Key Levels to Watch
Resistance: 1.1450, 1.1470, 1.1490, 1.1500
Support: 1.1380, 1.1350, 1.1320, 1.1300
🧭 Trading Scenario
🔵 BUY ZONE: 1.1380 – 1.1365
SL: 1.1340
TP: 1.1420 → 1.1450 → 1.1470 → 1.1490
🔻 SELL ZONE: 1.1450 – 1.1460
SL: 1.1475
TP: 1.1420 → 1.1400 → 1.1370 → 1.1350
✅ Summary
EUR/USD is currently in a short-term bullish trend and could continue to rise if the support at 1.1365 holds. However, key economic data from the US, especially CPI and central bank meetings from the Fed and ECB, could impact the next direction for this pair. Traders should keep an eye on important support and resistance levels to identify safe trading opportunities.

Will the Trend Explode or Continue to Retrace? XAUUSD Trading Plan - Will the Trend Explode or Continue to Retrace? 🔥
📉 Current Situation:
Gold is currently undergoing a retracement after a strong increase at the beginning of the week. The market is being influenced by macroeconomic factors like the US-China trade negotiations and fluctuations in the US dollar. Gold may either continue its retracement or break out of the current price range.
🔧 Technical Analysis:
🔶 Key Levels:
🔶 Support Zone: 3,276.121 - 3,289.874. These zones are crucial in confirming the strength of the bullish trend.
🔶 Resistance Zone: 3,345.715, 3,363.845. If these levels are broken, gold could continue to rise sharply.
📊 Technical Indicators:
The Exponential Moving Averages (EMA) 13, 34, and 89 support the short-term bullish trend.
The trendline shows that the bullish trend is intact, but a slight correction may happen in the short term.
💼 Fundamental and Macro Analysis:
The US-China trade negotiations are the key drivers of market sentiment. If the negotiations yield positive news, gold could continue to rise. However, if concerns arise about tariffs or failed talks, gold could face pressure.
Key US economic indicators, such as PMI, GDP, and NFP, will play a crucial role in shaping the direction of the US dollar, and thus, the price of gold.
🎯 Trading Plan:
🔶 Buy Zone:
Entry Zone: 3,289.874 - 3,276.121
Stop Loss (SL): 3,269.000
Take Profit (TP):
TP 1: 3,302.000
TP 2: 3,317.000
TP 3: 3,327.000
TP 4: 3,340.000
🔶 Sell Zone:
Entry Zone: 3,345.715 - 3,363.845
Stop Loss (SL): 3,370.000
Take Profit (TP):
TP 1: 3,327.000
TP 2: 3,310.000
TP 3: 3,300.000
TP 4: 3,289.000
⚠️ Key Points to Watch:
🔒 Strong Support Zone: 3,289.874 represents a key support zone. If the price breaks below this level, we could see gold approach 3,276.121.
🔓 Strong Resistance Zone: 3,345.715 - 3,363.845 is the key resistance zone. If broken, gold could continue to rise to 3,380.000 or higher.
📈 Market Psychology:
Gold is in a retracement phase after a significant rise, but both technical and fundamental factors suggest that the bullish trend may continue. It is essential to closely monitor signals from the US-China trade negotiations and economic news affecting the US dollar.
💥 Conclusion:
Gold is in a retracement phase after a strong increase, but technical and fundamental factors indicate that a bullish recovery could be on the horizon. Prepare your trading plans based on key support and resistance levels.
📌 Good luck and happy trading to all!

Fundamental Market Analysis for June 9, 2025 USDJPYThe Japanese Yen (JPY) is rising at the start of the new week, reacting to upward revisions to Japan's first quarter GDP data. This comes amid signs of rising inflation in Japan and confirmation of bets that the Bank of Japan (BoJ) will continue to raise interest rates, which in turn provides a slight boost to the JPY. In addition, a modest decline in the US Dollar (USD) is putting some downward pressure on the USD/JPY pair during the Asian session.
For now, the Yen appears to have broken a two-day losing streak against its US counterpart, although traders may refrain from aggressive directional bets ahead of key US-China trade talks in London. In addition, stronger-than-expected US jobs data released on Friday dampened hopes that the Federal Reserve (Fed) will cut interest rates soon this year, which could serve as a tailwind for the dollar and limit USD/JPY pair losses.
Trade recommendation: SELL 143.85, SL 144.85, TP 141.85

Platinum's Quiet Ascent: What Drives Its New Value?Platinum, often operating in the shadow of gold, has recently experienced a significant surge in value, reaching multi-year highs and capturing considerable investor attention. This resurgence is not arbitrary; it stems from a complex interplay of industrial demand, tightening supply, evolving geopolitical dynamics, and a notable shift in investment sentiment. Understanding these underlying forces becomes crucial for investors seeking to decipher the trajectory of this vital industrial precious metal.
A primary catalyst for platinum's price rally is its strong industrial utility, particularly within the automotive sector, where it remains indispensable for catalytic converters. While the rise of battery electric vehicles presents a long-term shift, the robust growth in hybrid vehicle production continues to sustain demand. Critically, the market faces persistent physical deficits, with supply consistently falling short of demand for the past two years, a trend projected to continue into 2025. Mine output struggles due to disruptions in key producing regions, such as South Africa and Zimbabwe, and secondary supply from recycling has proven insufficient to bridge the growing gap.
Geopolitics and strategic investment further amplify platinum's upward trajectory. China has emerged as a pivotal market, with a sharp rebound in demand as consumers increasingly favor platinum for both jewelry and investment amidst record gold prices. This strategic pivot by the world's largest consumer market is reshaping global platinum price discovery, supported by China's initiatives to develop new trading ecosystems and futures contracts. Concurrently, renewed investor confidence is evident in growing inflows into platinum Exchange-Traded Funds (ETFs) and robust physical buying, with anticipated lower borrowing costs also enhancing its appeal.
In essence, platinum's current rally reflects a powerful combination of tightening supply and resilient industrial demand, underscored by strategic shifts in major consumer markets and renewed investor interest. As above-ground stocks gradually deplete and the market anticipates continued deficits, platinum is poised for a sustained period of relevance, offering compelling prospects for those who recognize its multifaceted value proposition.

BTCUSDT Analysis – Pivot 103k/106k, strategy and key zones__________________________________________________________________________________
Technical Overview – Summary Points
__________________________________________________________________________________
Momentum : Bullish structure on 1D/12H (MTFTI “Up”), but short-term consolidation (1H-2H “Down”). Momentum exhaustion observed.
Key Supports/Resistances : Resistances: 105287.8 / 106743.9 / 109952.8 / 111949. Supports: 103033.3 / 100333.3 / 93337.4. Repeated rejections below 105-106k, active testing of 103-100k supports.
Volume : Normal or slightly elevated on all timeframes. No capitulation or euphoric extremes detected.
Multi-TF Behaviour : Strong sector leadership (Risk On / Risk Off Indicator = “Strong Buy” across all frames; growth stocks > market). No behavioural anomalies on ISPD DIV. High-cycle consolidation below resistance.
__________________________________________________________________________________
Strategic Summary
__________________________________________________________________________________
Overall Bias : Neutral/bullish as long as 103k/100k holds. Bullish momentum intact, but short-term caution warranted.
Opportunities : Defensive buys/technical pullbacks above 103k; scalp/range trading 103-106k.
Risk Zones : Confirmed breakdown below 100k or acceleration in LTH distribution.
Macro Catalysts : Next FOMC June 17-18; no major short-term events identified (recent neutral macro, FOMC is key for swings).
Action Plan : Prioritize strict stops (≥3%) near pivots, consistent monitoring of behaviour/volume. Avoid overexposure pre-FOMC.
__________________________________________________________________________________
Multi-Timeframe Analysis
__________________________________________________________________________________
1D : Structuring range below 109952.8-111949 resistances. Bullish HTF trend, but momentum pausing. Average volume. Risk On / Risk Off Indicator “Strong Buy”. No extreme ISPD signals (neutral).
12H – 6H : Consolidation; supports holding, no euphoric confirmation (normal volumes, ISPD DIV neutral). Sector leadership unchanged.
4H : Compression below 105287.8. Moderate volume. Defensive resumption on supports. MTFTI bullish. Dynamic risk: monitor for sell-side capitulation.
2H – 1H : Technical correction, active retest of 105k (range 103-105k). Absorption volume. MTFTI “Down”.
30min – 15min : Short-term positive bias above 103k. Risk of false break if volume remains low. Risk On / Risk Off Indicator “Buy”/“Strong Buy”.
Cross-Indicators : Market leadership confirmed: Risk On / Risk Off Indicator = Strong Buy on all frames >15min. No excess behaviour or significant divergences detected. Key ranges: 103k-105k. On-chain: heavy LTH profit-taking but no panic.
Summary : BTC market in post-cycle-high congestion phase, structurally robust, but momentum recalibrating with fewer “easy trades.”
__________________________________________________________________________________
Cross insights & on-chain summary
__________________________________________________________________________________
On-chain (Glassnode) : Top at $111.8k, correction to $103.2k by LTH profit-taking. Spot accumulation on $103.7k/$95.6k. Upside limited unless fresh buying flows return.
Macro events : Awaiting FOMC; no recent surprises. Price action and levels dominate short-term strategy.
Stops/invalidation : Swing long defended at 103k/100k (stop <100k H4). Partial short/sell below 106743.9/109952.8. Dynamic targets: 106-109.9k; extension: 111.8k if breakout on volume.
__________________________________________________________________________________
Conclusion & Actionable Plan
__________________________________________________________________________________
Market condition:
- High consolidation, ranging below major resistances.
- Long-term bullish, short-term momentum fading.
- Neutral/bullish if 100-103k holds.
- “No macro — only levels” until FOMC or volatility catalyst.
Tactical decision:
- Trade technically, stops ≥3% under supports.
- Defended buys at 103k (stop <100k), partial profit 106-109k.
- Continuous monitoring of volume/on-chain zone reaction.
- Aggressive exit/hedge below support, target 96k/83k.
__________________________________________________________________________________
100% analysis based on TradingView multi-TF, Glassnode on-chain, macro calendar and risk management.
__________________________________________________________________________________

GOLD - Price can drop to support line of triangle patternHi guys, this is my overview for XAUUSD, feel free to check it and write your feedback in comments👊
In this chart price formed a triangle pattern, where it first declined to support line and then made an impulse up.
After this, Gold broke $3165 level and, after a small correction reached and broke $3400 level too.
Then it rose to resistance line of triangle and dropped below $3400 level, breaking it one more time.
Price tried to back up, but failed and dropped more to support line of triangle, after which started to grow.
In a short time price rose to resistance line of triangle, which coincided with resistance level and area.
Now, I think that Gold can drop from resistance area to $3250 point of support line of triangle.
If this post is useful to you, you can support me with like/boost and advice in comments❤️
Disclaimer: As part of ThinkMarkets’ Influencer Program, I am sponsored to share and publish their charts in my analysis.

BUY | BrightSpring Health Services (BTSG) Current Price: $24.11
Change: +0.58 (+2.47%)
Volume: 1,529,511
52-Week Range: $17.50 – $24.50
Technical Overview:
Chart Pattern: Forming a bullish cup-with-handle pattern, indicating potential for a breakout.
Moving Averages:
50-Day MA: $22.80
200-Day MA: $21.50
Relative Strength Index (RSI): 65 – approaching overbought territory, but still within a bullish range.
Execution Plan:
Entry: $24.20
Stop Loss: $22.80
Take Profit: $26.50
Risk-Reward Ratio: 1:2
Rationale:
BrightSpring has surged approximately 38% in 2025, significantly outperforming the S&P 500. Analysts project a 269% increase in earnings per share this year, followed by 20% growth next year. The company recently sold its community living business to focus more on its pharmacy division and reduce debt.

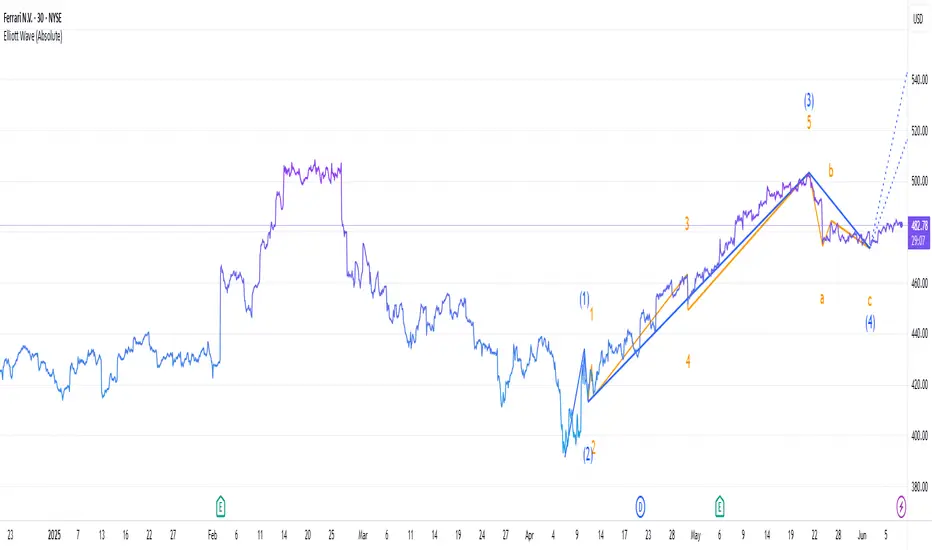
Is Ferrari's stock still bullish?Is Ferrari's stock still bullish?
Technical Outlook
Elliot Wave theory suggests a cautious bullish stance. The present correction seems to be a temporary setback, likely driven by guidance and tariff fears, but sets the stage for a potential rally to $520-$540 if support is not broken. However, risks of a deeper correction (i.e., to $420-$440) persist if pressures from the outside intensify.
The stock is currently trading above all three of its major EMA levels — daily, weekly, and monthly — that is a good technical signal. The rising daily EMA at 479.98 suggests that short-run momentum remains healthy. The weekly EMA at 461.77 provides medium-term support, while the monthly EMA at 421.08 supports the longer-term trend solidly.
Positive Sentiment Factors
Ferrari reported robust Q1 2025 results, with net revenues of €1.79 billion (up 13% YoY), an operating profit of €542 million (up 22.7%), and a net profit of €412 million (up 17%). Adjusted earnings per share were €2.30, surpassing analyst expectations of €2.28. This shows Ferrari’s strong pricing power and demand for personalized vehicles.
Analyst Sentiment: Optimism remains for Ferrari among some analysts. UBS raised its price target to $560 from $520, maintaining a Buy rating, with the new Ferrari Elettrica a major catalyst, the company said. Bernstein and RBC Capital maintained Outperform ratings on the stock at $575 and €500, respectively. Barclays upgraded Ferrari to Overweight, calling it a "safe haven" in a shaky European automotive environment.
Brand Strength and Strategic Positioning: Ferrari’s luxury brand and high demand for models like the Roma Spider, 296 GTS, SF90 XX, and Purosangue bolster its market position.
Neutral Sentiment Factors
Market and Industry Context: The broader market has been volatile due to trade developments and tariff relief rallies. Ferrari’s stock has been influenced by these macroeconomic factors, but its luxury positioning makes it less sensitive than mass-market automakers.
Formula 1 Performance: Ferrari’s underwhelming Formula 1 season, with McLaren significantly outscoring Ferrari in points poses some concern among investors. While this does not directly impact stock performance, it may indirectly affect brand sentiment among enthusiasts.
Negative Sentiment Factors
Tariff Concerns: Ferrari shares have been sensitive to Trump's U.S. tariff policies. A tariff increase would add up to $50,000 to the price of an average Ferrari, potentially cutting sales volumes in the U.S., which accounts for 28.8% of net sales. JPMorgan warned that tariff impacts might be "worse" for Ferrari, lowering the price target to $460 from $525
Conclusion
Ferrari stock has a bullish but cautious bias, supported by solid fundamentals, favorable technical momentum, and positive analyst sentiment on upcoming product releases such as the Ferrari Elettrica. Macro risks, however, including U.S. trade policy and market volatility, are still major overhangs.
EUR/USD - After taking the highs, are the lows next?The EUR/USD currency pair is moving between two important price levels. The top level is 1.1454 and the bottom level is 1.1357. This means the price is staying inside a range. Yesterday, the price of EUR/USD went above the top level of 1.1454. By doing this, it triggered many stop-loss orders from traders who were expecting the price to go down. These traders had placed their stop-losses just above this level, and the market moved up to take them out.
Current support of the 1H FVG
Now, the price is starting to go down again. It is getting closer to the lower level of the range, which is around 1.1357. There is a chance that the market will go below this level as well. If that happens, it may take out the stop-loss orders of traders who are expecting the price to go up. These traders often place their stop-losses just below the low point of the range. When the market goes below the low, it collects liquidity. In simple words, it grabs the orders that are waiting there.
Looking at the chart, we can see that EUR/USD has found some support at the 1-hour Fair Value Gap (1H FVG). This area is acting like a short-term floor for the price. If a full 1-hour candle closes below this support area, then the price will likely fall further. In that case, it may reach the bottom of the range and possibly move below it to take out more stop-losses.
Why below support?
But why would the market go below the low on purpose? The reason is that many retail traders, those are small traders who trade from home, often put their stop-losses just below the recent low. If the market moves there, it activates those stop-losses. These stop-losses are usually sell orders, and when they get triggered, it gives the market extra selling power. After collecting this liquidity, the market often uses the new buying interest (from other traders entering long positions) to push the price back up again.
Conclusion
So in summary, the EUR/USD is still inside a range. It has already moved above the top to take out stop-losses, and now it might go below the bottom to do the same. After that, there could be a strong move upward, powered by the new liquidity in the market.
Disclosure: I am part of Trade Nation's Influencer program and receive a monthly fee for using their TradingView charts in my analysis.
Thanks for your support.
- Make sure to follow me so you don't miss out on the next analysis!
- Drop a like and leave a comment!

USD/JPY - Triangle Breakout (06.06.2025)The USD/JPY pair on the M30 timeframe presents a Potential Buying Opportunity due to a recent Formation of a Triangle Pattern. This suggests a shift in momentum towards the upside and a higher likelihood of further advances in the coming hours.
Possible Long Trade:
Entry: Consider Entering A Long Position around Trendline Of The Pattern.
Target Levels:
1st Resistance – 144.94
2nd Resistance – 145.52
🎁 Please hit the like button and
🎁 Leave a comment to support for My Post !
Your likes and comments are incredibly motivating and will encourage me to share more analysis with you.
Best Regards, KABHI_TA_TRADING
Thank you.
Disclosure: I am part of Trade Nation's Influencer program and receive a monthly fee for using their TradingView charts in my analysis.

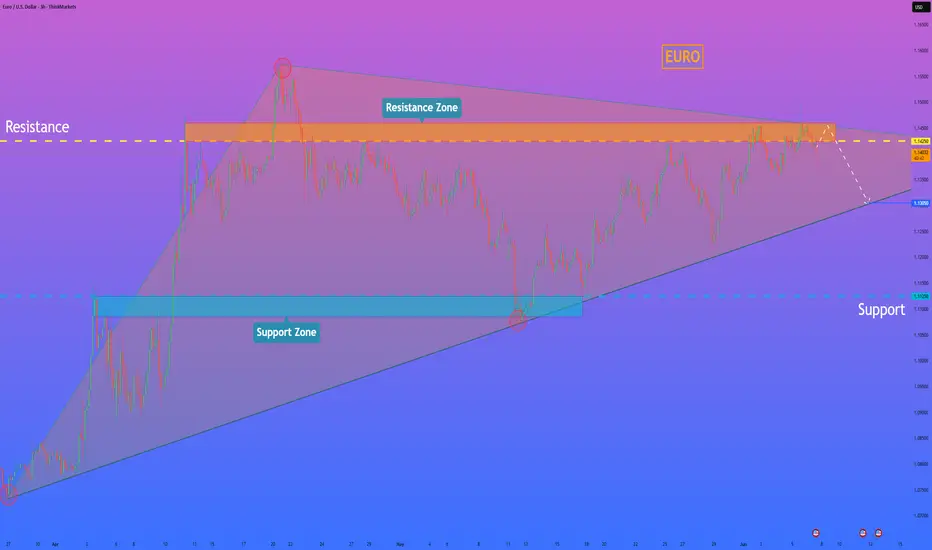
HelenP. I Euro may continue to decline to trend lineHi folks today I'm prepared for you Euro analytics. In this chart, we can see how the price reached the trend line and then started to grow inside a triangle pattern. Price some time traded near the trend line and then made an impulse up to the support level, which coincided with the support zone, and then made a correction, after which it turned around and made an impulse up one more time, breaking the support level. The euro reached the resistance level, which coincided with the resistance zone, and then made a small correction, after which it continued to move up and rose to the resistance line of the triangle. But then the Euro dropped below the resistance level, breaking it, and then continued to decline, after a retest. Price fell to the support zone, where it rebounded from the trend line, which is the support line of the triangle as well, and then started to grow. The euro has grown to a resistance zone, but recently it started to fall and now trades below the 1.1425 resistance level. So, I think that EURUSD will enter to resistance zone one more time and then continue to fall to the trend line. For this case, I set my goal at 1.1305 points, which coincided with this line. If you like my analytics you may support me with your like/comment ❤️
Disclaimer: As part of ThinkMarkets’ Influencer Program, I am sponsored to share and publish their charts in my analysis.
AJA's Gold view. The Bear is in charge for now.Just the start of the Bearish move.
Like I analysed. For now, we're selling till 3315.
Check my last analysis. What do you think?

BTC Tactical rebound or flush? Decision point at $103700 support__________________________________________________________________________________
Technical Overview – Summary Points
➤ Strong overall momentum across all swing/weekly timeframes, clear advantage to buyers.
➤ Key support at 103,700–104,000 USDT (chart/on-chain confluence, maximum visibility on all timeframes).
➤ Major technical resistance zone at 111,000–112,000 USDT (ATH + HTF pivots).
➤ Volumes normal to moderate, no directional climax or emotional excess in short and mid-term.
➤ Risk On / Risk Off Indicator remains strongly positive, indicating persistent sector outperformance.
➤ Only short-term weakness detected: temporary bearish trend on 2H/1H/30min/15min, typical of a short-term flush within a bullish structural context.
__________________________________________________________________________________
Strategic Summary
➤ Main bias: Bullish for swing approaches as long as $103,700 holds on closing.
➤ Opportunity: Buy on support on any retest 103,700–104,000 USDT with stop <102,000 USDT.
➤ Partial target: Take profits at 105–106k, then 111–112k.
➤ Risk zones: Confirmed break below 103,700 USDT with high volume = potential flush to 97–98k or even 95–96k.
➤ Catalysts: Quiet macro calendar until NFP (06/06) & FOMC (mid-June) — increased monitoring as these events approach.
➤ Action plan: Tactical intervention on support pullback, reduce exposure before major events.
__________________________________________________________________________________
Multi-Timeframe Analysis
1D/1W : Major structure fully bullish. No underlying reversal, stable volume, solid momentum. Risk On / Risk Off Indicator fully “On Risk”, no behavioral excess.
12H/6H: Sector momentum and volumes validate all swing-long entries on dips. Key supports 103,700–104,000 USDT consistently defended across timeframes.
4H/2H: Bullish bias maintained, healthy structure. Slight intraday weakness: 2H softens, moderately high volumes without extremes.
1H/30m/15m: Short-term bearish bias across all LTF — profit taking impact, typical technical flush on support. Bearish signals do NOT invalidate HTF bullish trend, but require tactical vigilance.
Risk Summary: A fast drop below 103,700 USDT with volume would validate a flash liquidation scenario to 97–98k. Pullback in mature bull phase, strongly defended at the key support: timing for “mean reversion” on volume reaction, else wait for lower setups.
Risk On / Risk Off Indicator: Still “On Risk”, strong tech/growth sector momentum on daily/swing.
ISPD: No behavioral excess, neutral/median histogram across timeframes.
Volumes: Normal/moderate, no exhaustion spike nor major selling.
On-chain: Mature distribution, LTH profit-taking; key supports at $103,700, $97,100, $95,600.
__________________________________________________________________________________
Strategic Synthesis & Bias
Market in mature bullish consolidation, HTF structure robust as long as 103,700 USDT holds.
Active opportunity window until NFP & FOMC: prioritize swing/mean-revert setups.
Required stop for any trade: strictly below $102,000.
Smart monitoring of volumes & sentiment: confirmed support break + volume = wait for lower rebound.
No excessive panic or exuberance signals: strong RR if re-entering the main range.
Actively manage exposure approaching macro events.
Operational summary:
• Buy at 103,700–104,000 USDT, stop <102,000.
• Partial profits at 105–106k, final offload at 111–112k.
• Reduce exposure ahead of NFP/FOMC.
• If break of 103,700 USDT: stop and wait for $97–98k or $95–96k.
__________________________________________________________________________________

Fundamental Market Analysis for June 6, 2025 GBPUSDThe GBP/USD pair is trading near 1.3570 with little movement ahead of the US (US) labor market data.
The US Dollar Index (DXY), which measures the value of the US Dollar against six major currencies, is trading above around 98.80 at the time of writing. The upcoming US non-farm payrolls data for May is expected to add 130,000 jobs, down from April's 177,000. The unemployment rate is also expected to remain unchanged at 4.2%.
Weekly initial jobless claims rose to 247,000, above the 235,000 expected, U.S. Labor Department data showed. ADP US private sector employment data released on Thursday showed a 37,000 increase in May versus a 60,000 increase (revised from 62,000) recorded in April, well below market expectations of 115,000.
GBP/USD is gaining support as the Pound Sterling (GBP) finds support amid rising risk sentiment in the United Kingdom (UK) markets following US President Donald Trump's executive order signed on Tuesday. British exporters still face the previous 25 percent tariff rate as Trump granted the UK temporary relief from the US' stiff 50 percent tariffs on steel and aluminum.
Trading recommendation: SELL 1.3500, SL 1.3600, TP 1.3300

EURO-USD BUY STRONG 1. "EUR/USD Strong Buy Alert 🚀 | Key support zone holding firm – bulls eyeing the next leg up!"
2. "Strong Buy Zone ✅ | EUR/USD showing bullish momentum from this support level – eyes on 1.09+"
3. "EUR/USD Reversal Zone 💥 | Buyers stepping in strong – potential rally ahead!"
4. "Watch this zone! EUR/USD strong buy setup forming – bullish confirmation underway 📈"
5. "EUR/USD bouncing from key demand zone 🔥 | Technicals align for a strong buy signal!"

USD/CHF - Triangle Breakout (06.06.2025)The USD/CHF pair on the M30 timeframe presents a Potential Buying Opportunity due to a recent Formation of a Triangle Pattern. This suggests a shift in momentum towards the upside and a higher likelihood of further advances in the coming hours.
Possible Long Trade:
Entry: Consider Entering A Long Position around Trendline Of The Pattern.
Target Levels:
1st Resistance – 0.8263
2nd Resistance – 0.8227
🎁 Please hit the like button and
🎁 Leave a comment to support for My Post !
Your likes and comments are incredibly motivating and will encourage me to share more analysis with you.
Best Regards, KABHI_TA_TRADING
Thank you.
Disclosure: I am part of Trade Nation's Influencer program and receive a monthly fee for using their TradingView charts in my analysis.

GBPUSD reaches resistance zone: Watching for potential reversalOANDA:GBPJPY has reached a pretty significant resistance level, that has been an obvious turning point in the past, with several strong reversals from the area. So naturally, I’m watching to see how price reacts here again.
If we get confirmation of rejection (what I usually watch for: like a bearish engulfing candle, long upper wicks or signs of increased selling pressure), I’ll be looking for short setups from there.
🟥 My sell idea is based on the expectation that this resistance will hold. I would be targeting a move down toward the 192.000 level, which I feel is a realistic and clean target, especially if price respects this structure again.
But if price breaks above and starts holding strong above the zone, then I’ll back off the bearish bias and reassess, and I’d consider the bearish idea invalidated, with potential for further upside 🚀
Just sharing how I see the chart right now, not financial advice 💕✨

USD/CAD - Bearish Flag (04.06.2025)The USD/CAD Pair on the M30 timeframe presents a Potential Selling Opportunity due to a recent Formation of a Bearish Flag Pattern. This suggests a shift in momentum towards the downside in the coming hours.
Possible Short Trade:
Entry: Consider Entering A Short Position around Trendline Of The Pattern.
Target Levels:
1st Support – 1.3645
2nd Support – 1.3605
🎁 Please hit the like button and
🎁 Leave a comment to support for My Post !
Your likes and comments are incredibly motivating and will encourage me to share more analysis with you.
Best Regards, KABHI_TA_TRADING
Thank you.
Disclosure: I am part of Trade Nation's Influencer program and receive a monthly fee for using their TradingView charts in my analysis.

EURO - Price can drop to $1.1280, breaking support levelHi guys, this is my overview for EURO, feel free to check it and write your feedback in comments👊
A few days ago price broke $1.1375 level and then entered to triangle pattern, where it at once dropped from resistance line.
Price fell to $1.1375 level, where it some time traded between and then continued to decline to $1.1220 level.
When Euro declined to this level, it at once broke this level and fell to support line of a triangle pattern.
Next, price turned around and in a short time rose higher than $1.1220 level, breaking it and continued to grow next.
Euro rose to resistance line and then corrected, after which it made an upward impulse, thereby exiting from triangle.
Now, price traded inside resistance area, near $1.1375 level, and I think EUR can drop to $1.1280
If this post is useful to you, you can support me with like/boost and advice in comments❤️
Disclaimer: As part of ThinkMarkets’ Influencer Program, I am sponsored to share and publish their charts in my analysis.

Fundamental Market Analysis for June 5, 2025 EURUSDThe EUR/USD pair is trading cautiously, slightly above the key level of 1.14000 during Thursday's Asian trading session. The major currency pair is expected to remain in a sideways trend as investors await the European Central Bank's (ECB) interest rate decision.
The ECB is almost certain to cut its key lending rates by 25 basis points (bps), bringing the deposit rate and the main refinancing rate to 2% and 2.15%, respectively. This will be the ECB's seventh consecutive interest rate cut and the eighth since June last year, when it began its cycle of monetary expansion.
Traders are increasingly confident of a seventh consecutive ECB interest rate cut as deflationary trends persist in the eurozone. Preliminary data from the eurozone's harmonized index of consumer prices (HICP) released on Tuesday showed that inflationary pressure fell below the central bank's 2% target.
With the Fed widely expected to cut interest rates, investors will be watching ECB President Christine Lagarde's press conference closely for clues on likely monetary policy in the second half of the year. Market participants would also like to hear about the progress of trade negotiations with the US.
Meanwhile, the US dollar (USD) is struggling to stay near a six-week low as weak US data has reignited stagflation risks. The ISM Services PMI unexpectedly declined in May, while its components showed that production costs continue to rise rapidly. ADP employment change data, which reflects labor demand in the private sector, showed that 37,000 new jobs were created in May, the lowest figure since February 2021.
Trading recommendation: SELL 1.14100, SL 1.14400, TP 1.13600

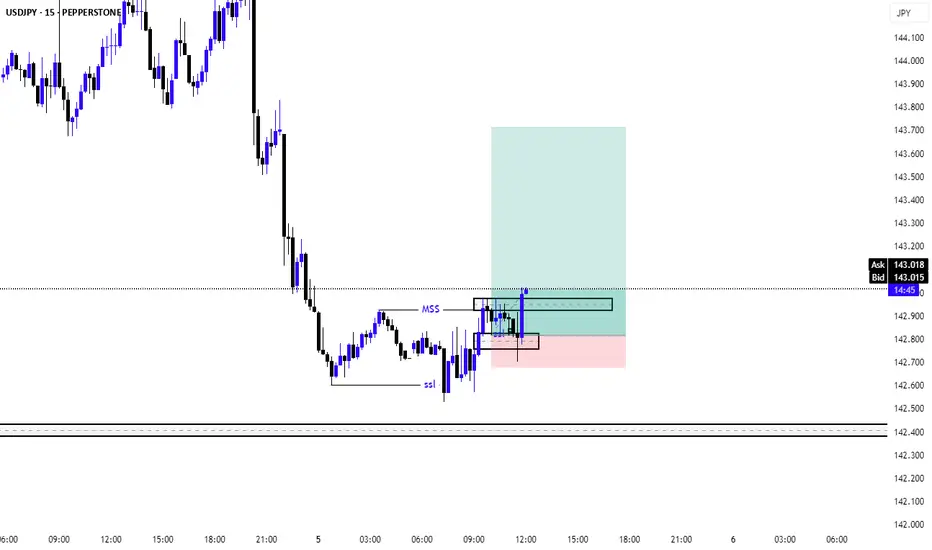
USDJPY buyPEPPERSTONE:USDJPY 15m chart liquidity grab & market structure shift. looking for buy with in intraday setup. idea valied untill asian season close. time zone base on malaysian time.
GBP/NZD - Triangle Breakout (05.06.2025)The GBP/NZD Pair on the M30 timeframe presents a Potential Selling Opportunity due to a recent Formation of a Triangle Breakout Pattern. This suggests a shift in momentum towards the downside in the coming hours.
Possible Short Trade:
Entry: Consider Entering A Short Position around Trendline Of The Pattern.
Target Levels:
1st Support – 2.2345
2nd Support – 2.2285
🎁 Please hit the like button and
🎁 Leave a comment to support for My Post !
Your likes and comments are incredibly motivating and will encourage me to share more analysis with you.
Best Regards, KABHI_TA_TRADING
Thank you.
Disclosure: I am part of Trade Nation's Influencer program and receive a monthly fee for using their TradingView charts in my analysis.
