Fundamental Market Analysis for May 30, 2025 USDJPYThe Japanese yen (JPY) attracted strong follow-through buying for the second consecutive day on Friday and continued to recover from a two-week low reached the previous day against the US dollar. Global risk sentiment deteriorated after a federal appeals court on Thursday suspended a recent ruling blocking US President Donald Trump's radical tariffs. This is evident from the general weakening of sentiment in the stock markets and is contributing to a recovery in demand for traditional safe-haven assets, including the JPY.
Meanwhile, optimistic macroeconomic data from Japan released today, including strong consumer inflation figures in Tokyo, confirm the need for further interest rate hikes by the Bank of Japan (JPY) and provide additional support for the JPY. On the other hand, the US dollar (USD) is consolidating after a sharp reversal yesterday amid concerns about the deterioration of the US financial situation and bets that the Federal Reserve (Fed) will stick to its easing policy. This further contributes to the continued decline of the USD/JPY pair.
Trading recommendation: SELL 143.800, SL 144.200, TP 142.900
Analysis

$BUSDT Ready to Explode? Breakout Could Send It Flying#BUSDT is demonstrating strong potential for a pennant breakout.
A successful breakout could trigger a +60% bullish rally in the coming days. 🚀
#Altseason2025

+113% gain made in 40 minues with Double BuyHUGE 🚀 +113% gain made in 40 minues with Double Buy Alert from $0.70 to Take Profit Alert at $1.10 🎯 Expected $1+ that's why two buy attempts were made during the day at $0.66 with both with $1.10 max target but shortsellers kept dropping the price and preventing a push higher so had to exit each time for controlled loss.
Finally once after hours came they can't manipulate as much as they're able during the day so I notified everyone about $0.70 double buy and $1+ expectation. Soon after huge win was pocketed!
Awesome end of the day with NASDAQ:ASBP after bumpy start of the day not taking profit on AMEX:SGN on time

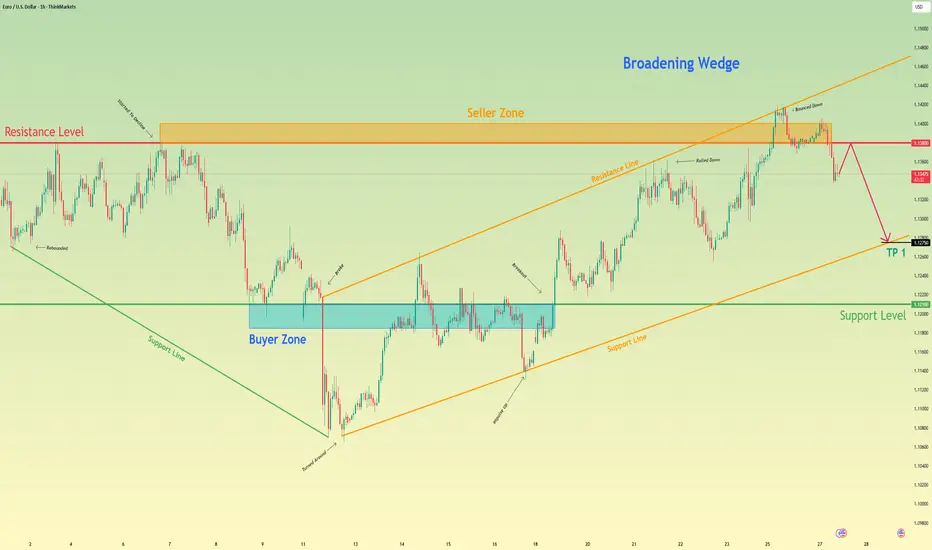
Euro may grow to resistance level and then drop to 1.1275 pointsHello traders, I want share with you my opinion about Euro. After forming a strong upward move from the buyer zone (1.11850–1.1210), the price rose sharply, broke the mid-range resistance, and entered the seller zone between 1.1380 and 1.1400. Once it reached the upper boundary of the broadening wedge, the price bounced down from resistance at 1.1380. Now the price is trading inside a broadening wedge, showing signs of a potential reversal. After failing to hold above resistance, the Euro started to decline from the seller zone, confirming selling pressure. The current movement points to a correction within the wedge structure. I expect the Euro will continue falling toward 1.1275, my TP 1, where the support line of the wedge coincides with the upper boundary of the previous buyer zone. This zone has already shown strong reactions before and could act as a short-term reversal area. Given the recent rejection from resistance, the broadening wedge formation, and return from the seller zone, I remain bearish and anticipate further decline. Please share this idea with your friends and click Boost 🚀
Disclaimer: As part of ThinkMarkets’ Influencer Program, I am sponsored to share and publish their charts in my analysis.
EUR/USD UPDATE 29 5 2025The chart you've shared is a 30-minute candlestick chart for the Euro/US Dollar (EUR/USD) currency pair, published on TradingView. Here’s a breakdown of the technical elements:
Key Levels and Zones:
Support Zone (lower yellow zone): ~1.12100 to ~1.12500
Current Price: 1.12776
Resistance Zones:
Mid resistance zone: ~1.12850 to ~1.13000
Upper resistance zone: ~1.13500 to ~1.13700
Observations:
The price is currently around 1.12776, just below the mid resistance zone.
The chart includes two blue arrow projections:
1. A bullish projection: Suggests a break above the mid resistance, heading toward the upper resistance (~1.13657).
2. A bearish projection: Indicates a potential drop toward the support zone before bouncing back up toward the upper resistance.
Volume:
Noticeable spike in volume during the drop before price stabilized near the support zone, suggesting strong selling pressure was absorbed.
Implications:
If the price breaks above the 1.13000 level with strong volume, it could signal a move toward the 1.13657 level.
A rejection from the mid resistance zone could lead to a retest of the lower support area before attempting another upward move.
Would you like a deeper technical analysis, or help planning trade entries/exits based on this chart?

Recovery or Just a Bull Trap? All Eyes on PCE This WeekNZDUSD – Recovery or Just a Bull Trap? All Eyes on PCE This Week
🌐 MACRO & FUNDAMENTAL OVERVIEW
After the FOMC’s decision to keep interest rates unchanged, the US Dollar has shown signs of recovery driven by expectations that core inflation remains persistent — especially ahead of the upcoming US Core PCE Price Index release this Friday.
On the New Zealand side, the Kiwi remains under pressure due to recent weak economic data and negative sentiment from China — its largest trading partner. The RBNZ continues to maintain a neutral stance, offering little support for the currency in the near term.
Market sentiment remains cautious as investors await the PCE data to determine inflation trends and potential Fed policy shifts.
📉 TECHNICAL ANALYSIS (H1–H2 TIMEFRAME)
NZDUSD is forming a technical rebound after a strong bearish leg from the 0.60300 region. Current price is trading around the 38.2%–50% Fibonacci retracement zone (0.5964–0.5976), struggling to break above EMA89 and EMA200 resistance.
Overall structure: Bearish bias remains intact with lower highs.
EMA alignment: EMA13, EMA34, and EMA89 are in bearish formation.
Key support zone: 0.5926–0.5940, trendline confluence + consolidation base.
🔑 KEY LEVELS TO WATCH
Resistance:
0.5976 – Fibonacci 0.5 retracement + previous rejection zone
0.5990 – Structural resistance of the week
0.6007 – 78.6% Fib + liquidity sweep potential
Support:
0.5940 – Trendline retest + short-term structure
0.5926 – Key demand zone with previous fake breakout
🎯 TRADE IDEAS
SELL SETUP – Fade the pullback into resistance:
Entry: 0.5976 – 0.5990
Stop Loss: 0.6010
Take Profit: 0.5940 → 0.5926
BUY SCALP – On strong bullish rejection from support:
Entry: 0.5926 – 0.5930
Stop Loss: 0.5900
Take Profit: 0.5960 → 0.5976
Note: Confirm with bullish candlestick and volume spike before entry.
⚠️ STRATEGY OUTLOOK
NZDUSD remains in a corrective phase. This week’s PCE inflation data will be critical. A hotter-than-expected reading could strengthen the USD and push NZDUSD below 0.5926, resuming the medium-term downtrend.
Avoid chasing mid-range price action. Focus on price reactions near the key resistance and support levels.

XAUUAD UPDATE 29 - 05 - 2025This chart is a 30-minute candlestick chart for CFDs on Gold (XAU/USD), published on TradingView. Here’s a detailed breakdown of what it shows:
---
Chart Analysis Details
1. Timeframe:
30-minute candlesticks, showing short-term price movements.
2. Price Levels:
Current price: Around 3,277.014 USD
Resistance zone (highlighted in yellow near the top): Around 3,299.476 USD
Support zone (highlighted in yellow near the bottom): Around 3,249.832 USD
3. Volume:
Volume bars at the bottom suggest increased activity leading up to and during the most recent upward movement.
4. Price Action:
There was a strong bullish move recovering from the support area near 3,250 USD.
Price reached a recent high near 3,285 USD and began to retrace slightly.
5. Forecast/Prediction (Illustrated by blue arrows):
The trader (Mr_Zakrii) anticipates a bearish reversal from the current region.
The blue arrows suggest a short position setup:
Entry near 3,285 USD
Target back toward the support area near 3,250 USD
Stop-loss near 3,299.476 USD
6. Risk-to-Reward Ratio:
The shaded red and green areas represent the stop-loss and take-profit zones respectively, indicating a favorable risk-to-reward setup (reward appears larger than the risk).
7. News Indicator:
There's a news icon (U.S. flag) indicating an upcoming news event that might affect the gold price volatility.
---
Conclusion:
This is a bearish setup based on a resistance rejection around 3,285–3,299 USD, aiming for a move back to the support zone near 3,250 USD. The chart suggests a sell position with a clear stop-loss and take-profit area, possibly relying on technical resistance and recent price action for confirmation.
Let me know if you want help evaluating the trade setup or analyzing the fundamental context behind it.

XAUUSD – Post-FOMC Trading Plan | Key Resistance: 3308 – 3310XAUUSD – Post-FOMC Trading Plan | Key Resistance: 3308 – 3310
📊 MACRO UPDATE – After the FOMC Decision:
The Fed kept interest rates unchanged as expected, but the tone remained hawkish. Chairman Powell reiterated that inflation remains too high and ruled out any near-term rate cuts, signaling prolonged restrictive policy.
This led to a swift rebound in the US Dollar and Treasury yields, weighing on gold. However, XAUUSD bounced back late in the session, suggesting the market is re-evaluating key technical zones post-announcement.
📉 TECHNICAL ANALYSIS – H1/H4 Chart Structure:
Gold remains in a corrective descending structure but is now reacting around key Fibonacci levels. The 13–34–89 EMAs provide dynamic support and resistance, and a potential double bottom has formed near the 3245–3247 zone.
🧠 Two key levels to watch:
3308–3310: major resistance with trendline + FVG confluence
3245–3247: strong horizontal support + Fib 0.618 retracement
🎯 TRADE SETUPS:
🔵 BUY ZONE: 3247 – 3245
Stop-Loss: 3241
Take-Profit: 3251 → 3255 → 3260 → 3264 → 3270 → 3275 → 3280
🔵 BUY SCALP: 3263 – 3261
Stop-Loss: 3257
Take-Profit: 3266 → 3270 → 3275 → 3280 → 3290 → 3300
🔴 SELL SCALP: 3294 – 3296
Stop-Loss: 3300
Take-Profit: 3290 → 3286 → 3282 → 3278 → 3274 → 3270 → 3260
🔴 SELL ZONE: 3308 – 3310
Stop-Loss: 3314
Take-Profit: 3304 → 3300 → 3296 → 3292 → 3288 → 3280
📌 STRATEGIC OUTLOOK:
Unless price breaks above 3310 with strong momentum, sellers are still in control short term. Any rejection from the resistance zone could offer clean short entries. A breakout, however, would shift sentiment and expose 3340–3360 next.
Patience is key — let price react before committing to entries.

GOLD - SELLING FROM PULLBACKPrice has shown a reaction from the low around 3,245 and is now approaching a strong confluence zone around the DAILY FLIP, which acted as prior support AND now resistance. This zone coincides with the upper boundary of the descending channel.
Bias: Bearish, unless price breaks above 3,305 with strong momentum and closes outside the descending channel.
TRADE IDEA:
SELL from 3,295–3,300 (wait for bearish confirmation)
once activated, I will update SL and TP
Let me know what your opinion.

Fundamental Market Analysis for May 29, 2025 GBPUSDEvent to pay attention today:
15:30 EET. USD - Initial jobless claims
22:00 EET. USD - Bank of England Governor Andrew Bailey will deliver a speech.
GBPUSD:
GBP/USD pared further gains on Wednesday, stumbling for the second session in a row and falling below 1.3500 after failing to regain 1.3600 earlier this week. Sterling markets are retreating from the upper limit of the bullish trend that lifted GBPUSD to multi-year highs, but the momentum remains favourable for sterling buyers.
The latest minutes of the Federal Reserve (Fed) interest rate meeting held on 6-7 May showed that the Fed's wait-and-see stance has deep roots. At the last Fed meeting, policymakers noted that the US dollar's (USD) status as a safe haven has suffered recently. They warned that a more ‘durable change’ in the dollar's status could have long-term consequences for the US economy.
Almost all FOMC members at the May rate meeting agreed that inflation risks could prove to be more ‘persistent than expected.’ Fed officials directly pointed to tariffs as a key factor in the FOMC's downgrade of its outlook for the US economy, and the FOMC blamed the Trump administration and its inconsistent tariff policy for the deterioration in the US economic situation and uncertain outlook for inflation and growth.
The rest of the trading week remains tense for the US. On Thursday, US gross domestic product (GDP) growth for the first quarter will be released. On Friday, the trading week will end with the release of US personal consumption expenditure (PCE) inflation data for April. Markets are hoping for a continued easing of key inflation indicators before the effects of the Trump administration's tariff policy begin to be reflected in the core data.
Trading recommendation: BUY 1.3450, SL 1.3430, TP 1.3540

With Bullish bias into new Week - 2025/05/26Last week, I published my idea for a whole week with daily updates for the first time. You can read about it here:
🎯 The target of $3348 was reached on Friday due to the announcement of new tariffs against the European Union.
💡 Here is my idea for the week from May 26-30, 2025.
First things first, the Friday session last week ended with bullish momentum. Even though the gold price consolidated more at the $3366 mark, it was obviously to allow time to pass and calm down stressed values like EMA or MACD. This is a very good sign for the start of the week because if the Asia timezone takes the invite, the gold price has a good chance to rise. My expectation is a bullish GAP right at the beginning; if so, it's a clear sign for the rest of the day, in my opinion. These thoughts would support my goal from above $3500 during the week.
📰 Geopolitical News Landscape
India / Pakistan
The ceasefire from May 10 remains tense but intact. Both sides claim victory, while Pakistan strengthens ties with China. Cross-border attacks have ceased, but mutual distrust persists.
➡️ Situation remains fragile; renewed escalation is possible.
Gaza Conflict
Israel intensifies "Gideon’s Chariot" with ground forces in Khan Younis. Mass evacuations and high civilian casualties worsen the humanitarian crisis. Peace talks have stalled as the offensive continues.
➡️ No relief in sight; humanitarian conditions are deteriorating further.
Russia / Ukraine
On May 24, Russia launched its largest air assault yet with 367 missiles and drones—13 civilians were killed. Just before, both sides exchanged 1,000 prisoners. Peace talks remain suspended.
➡️ Violence is escalating; a ceasefire remains out of reach.
U.S.–China Trade War
The 90-day tariff pause triggered a rush to import from China. Shipping bottlenecks and high freight rates are straining businesses. Structural issues remain unresolved.
➡️ Short-term easing; long-term tensions persist.
Trade War on global view
The global trade war has escalated in May 2025, with the U.S. imposing a 50% tariff on EU imports and a 25% levy on foreign-made smartphones, citing trade imbalances. The EU has condemned these moves, warning of potential retaliation. In response to U.S. tariffs, China has restricted rare earth exports, impacting global supply chains. ASEAN nations, heavily affected by U.S. tariffs ranging from 10% to 49%, are urging deeper regional integration to mitigate economic disruptions. The IMF has downgraded global growth forecasts to 2.8% for 2025, citing trade tensions and policy uncertainty. Supply chains are being restructured, with companies shifting production to countries like Vietnam and Mexico. Financial markets are volatile, with increased inflationary pressures and investor anxiety.
➡️ Emerging markets face currency volatility and economic instability due to the ongoing trade conflicts.
⚖️Trump vs. Powell
President Trump increases pressure on Fed Chair Powell to cut rates. The Fed holds interest rates at 4.25–4.5% and warns of inflation. A 10% staff reduction is planned to boost efficiency.
➡️Political interference is increasingly destabilizing markets.
U.S. Inflation – April 2025
Inflation dropped to 2.3%, the lowest since February 2021. However, consumer inflation expectations remain high at 7.3%. The University of Michigan Consumer Sentiment Index fell to 50.8—a historic low.
➡️A clear gap is emerging between official data and public perception.
🔋 Technical Analysis – Short-Term
📊 Analysis: May 19–24, 2025
Weekly Low: $3,204 (May 20)
Weekly High: $3,366 (May 23)
Weekly Close (May 23): approx. $3,358
Total Gain: +5%
🟢 Trend: A clear uptrend is evident. After hitting a low of $3,204 on May 20, gold experienced a strong rally, forming consistently higher highs and higher lows. A brief pullback on May 22 was quickly bought up.
📈 Structure: A series of bullish flag patterns developed, each resolving to the upside. The high at $3,366 currently marks the most significant resistance level.
🔮 Outlook from May 26, 2025
Resistance: $3,366 (recent high)
Support: $3,310 (last local low), below that $3,280 (breakout zone)
Bias: Bullish as long as price holds above $3,310
📌 Scenario 1 – Bullish Breakout: A sustained breakout above $3,366 could unlock further upside potential toward the $3,390–$3,410 area. When Asia session starting with bull GAP the Scenario is the one i preffer.
📌 Scenario 2 – Pullback: A retracement to the $3,310–$3,280 zone would be a healthy correction within the trend, provided this zone holds.
🧭 Conclusion:
Gold remains in a steady uptrend. As long as support levels hold, a continuation toward $3,500 is likely. RSI may be overbought on higher timeframes, so short-term consolidations are possible, but structurally the setup remains bullish.
Anything to ad? Feel free to tell your thoughts.
-------------------------------------------------------------------------
This is just my personal market idea and not financial advice! 📢 Trading gold and other financial instruments carries risks – only invest what you can afford to lose. Always do your own analysis, use solid risk management, and trade responsibly.
Good luck and safe trading! 🚀📊

GBP/USD Breakout (28.05.2025)The GBP/USD Pair on the M30 timeframe presents a Potential Selling Opportunity due to a recent Formation of a Breakout Pattern. This suggests a shift in momentum towards the downside in the coming hours.
Possible Short Trade:
Entry: Consider Entering A Short Position around Trendline Of The Pattern.
Target Levels:
1st Support – 1.3424
2nd Support – 1.3380
🎁 Please hit the like button and
🎁 Leave a comment to support for My Post !
Your likes and comments are incredibly motivating and will encourage me to share more analysis with you.
Best Regards, KABHI_TA_TRADING
Thank you.
Disclosure: I am part of Trade Nation's Influencer program and receive a monthly fee for using their TradingView charts in my analysis.

USDJPY PLAN – Will FOMC Be the Next Big Catalyst?USDJPY PLAN – Will FOMC Be the Next Big Catalyst?
💬 After several sessions of sideways movement, USDJPY is showing signs of a potential breakout, supported by both technical signals and macro fundamentals. As the FOMC meeting approaches, the market is poised for a major shift — making this the perfect time to prepare actionable trade plans.
🔍 TECHNICAL ANALYSIS
Primary Trend: Short-term bullish retracement within a broader downtrend – currently testing the 200 EMA on H2.
EMAs in use: EMA13 (black), EMA34 (orange), EMA89 (red) – effective dynamic support/resistance indicators.
Key Resistance Levels:
145.35: Major confluence zone with 0.618 Fibonacci and trendline resistance.
146.11 – 147.20: Previous highs and Fibonacci extension targets.
Key Support Zones:
144.61: EMA200 acting as immediate pressure point.
143.43 – 143.02: Crucial demand zone with strong reaction expected on pullback.
🌍 MACRO & FUNDAMENTAL FACTORS
FOMC Outlook: With recent CPI data softening and labor numbers moderating, markets anticipate a hold on rates. However, any hawkish tone from Chair Powell could trigger a sharp bullish move on USDJPY.
BOJ’s Dovish Stance: The Bank of Japan remains accommodative, showing no clear intent to hike rates. This weakens the Yen and supports mid-term upward momentum for USDJPY.
Interest Rate Differentials & Carry Trade Flows continue to drive volatility and directional bias in this pair.
🎯 TRADE SETUP SUGGESTION
If price breaks and sustains above 144.61 (EMA200): look to BUY on pullback toward 144.15–144.20, targeting 145.35 and 146.11.
If price gets rejected at 145.35: consider a short-term SELL toward 144.00 – 143.43 for a corrective leg.
⚠️ STRATEGY NOTE:
Avoid entering right at the time of the FOMC release. Wait for post-event confirmation. Prioritize strong breakouts or rejections, and manage risk carefully under volatile conditions.

Technical Analysis: XAU/USD (Gold) Price Action📊 Technical Analysis: XAU/USD (Gold) Price Action
🕒 Timeframe: 4H (Based on candlestick structure)
📅 Published: May 27, 2025
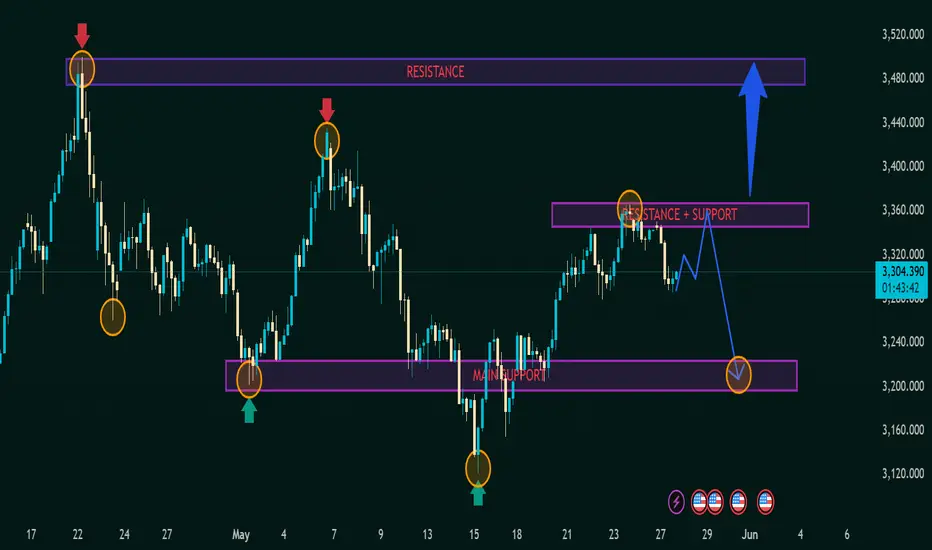
💰 Current Price: 3,303.860
🔴 Major Resistance Zone
📍 3,480 – 3,500
📌 Seen with red arrows and price rejections.
📉 Strong selling pressure has occurred twice from this level (double top-like behavior).
❗ Until price breaks above this, bulls face a major hurdle.
🟣 Key Mid-Level Zone (S/R Flip)
📍 3,340 – 3,360
🔄 This area has flipped between support and resistance.
🔸 Price tested this level recently and pulled back (orange circle), suggesting sellers are active.
🔮 This is the pivot zone – watch for break/rejection to determine next trend leg.
🟪 Main Support Zone
📍 3,180 – 3,220
✅ Multiple bounce reactions visible (green arrows and circles).
💪 This zone has held strong; indicates solid buyer interest.
📉 If price returns here and breaks below, we could see further downside to 3,120 or lower.
🧭 Market Structure Summary
🔁 The market is in a range-bound structure between 3,220 – 3,360, with spikes towards 3,480.
🔃 The recent higher low followed by rejection at mid-resistance suggests potential distribution.
🧠 Forecast Scenarios
🔵 Bullish Scenario (Blue Path)
Break above 3,360 → Retest as support → 📈 Potential rally to 3,480
📍 Target: 3,480+
🟢 Confirmation: Strong bullish engulfing candle + volume surge
🔻 Bearish Scenario (Blue-Arrow + Orange Circle)
Rejection at current resistance → Drop toward 3,220
📍 Target: Main Support zone
❗ Watch for bearish candle pattern confirmation at 3,340
⚖️ Trading Strategy Tips
🔍 Wait for confirmation at the mid-resistance before entering.
🛡️ Place stops below support zones for long positions.
💥 Aggressive short sellers may look to enter near 3,340 with tight stops above.
🧩 Conclusion
The asset is in a critical decision zone. Whether it breaks higher toward the resistance or retraces to support will shape the next directional move. Traders should remain cautious, and let price action confirm bias before committing.
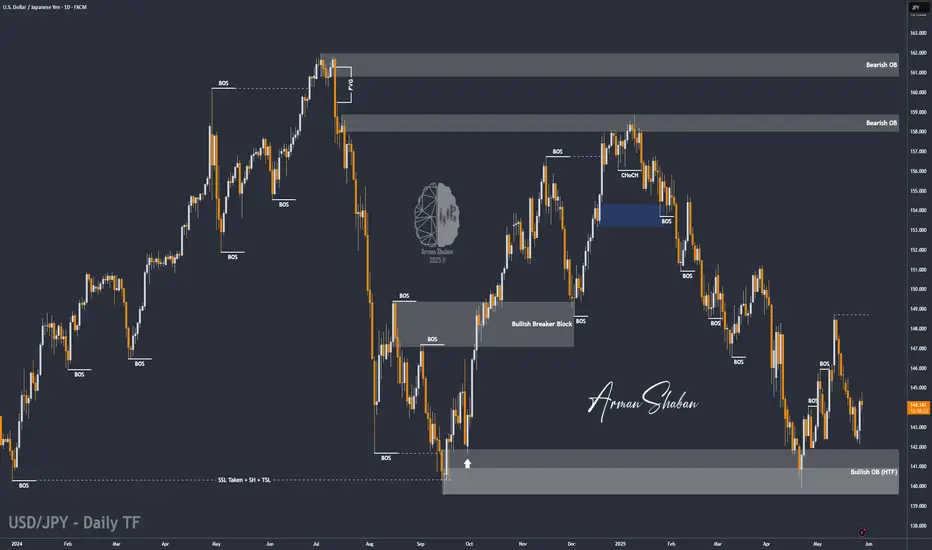
USD/JPY Poised for Upside: Momentum Building Toward Key TargetsBy examining the USD/JPY chart on the daily timeframe, we can see that the price is currently trading around 144. Given the momentum, I expect this pair to rise soon. The potential bullish targets are 145.5, 147.35, and 148.65 respectively.
Please support me with your likes and comments to motivate me to share more analysis with you and share your opinion about the possible trend of this chart with me !
Best Regards , Arman Shaban
Fundamental Market Analysis for May 28, 2025 EURUSDThe EUR/USD pair retreated below 1.1400 for the second consecutive day, helped by a recovery in the US Dollar (USD) following the release of a positive consumer confidence report.
Risk appetite increased as market participants digested the news that US President Donald Trump said that trade talks between the United States (US) and the European Union (EU) have gained momentum following his threats to impose 50 percent tariffs last Friday. Although he backtracked on his words, allowing some room for negotiations, it remains to be seen if the two sides will reach an agreement before July 9.
The convincing US consumer confidence data for May released by the Conference Board (CB) put pressure on EUR/USD. The US Dollar Index (DXY), which tracks the value of the US currency against the other six currencies, rose more than 0.62% to 99.54.
The ECB's Gediminas Simkus said he sees scope for an “interest rate cut in June”. Robert Holzmann, a member of Austria's central bank and a member of the ECB, told the Financial Times (FT) that he sees no reason to cut rates at the June and July policy meetings.
Trade recommendation: SELL 1.1265, SL 1.1365, TP 1.1065

$EGLD Gearing Up for Next Leg – Bull Flag in PlayCRYPTOCAP:EGLD is forming a clean bull flag on the 6H chart after a strong move up.
Price is holding the trendline, and a breakout above $19.7 could target $27 that’s a 47% potential move.
This setup appears solid, incorporating confluence from Fib levels and volume zones.
Eyes on this breakout that could be explosive.
Flag breakout incoming?
DYOR, NFA.
#EGLDUSDT #Altseason2025

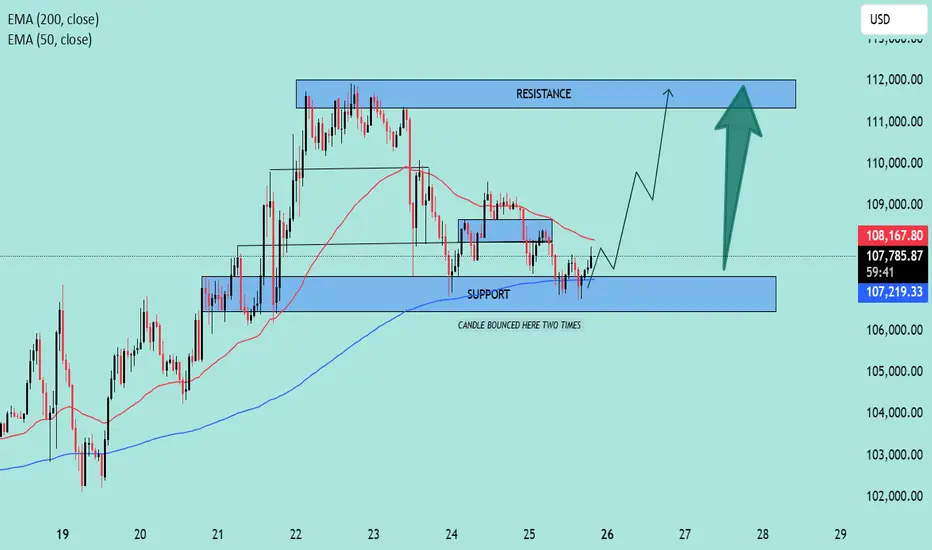
BTC/USD Rebound in Play! | Key Support Holding, Eyes on $112K📊 BTC/USD Technical Analysis
🗓️ Chart Date: May 25, 2025
🔍 Key Levels:
🔵 Support Zone: $106,800 – $107,300
Notably, price bounced twice in this region, indicating strong buying interest.
This area aligns closely with the 200 EMA (currently at $107,213.51), adding further confluence as dynamic support.
🔴 Resistance Zone: $111,800 – $112,300
Previous highs and consolidation make this a significant area where sellers may re-enter the market.
📈 Indicators:
🔵 EMA 200 (Blue): $107,213.51
Acts as a strong dynamic support; price bounced off it recently.
🔴 EMA 50 (Red): $108,182.91
Price is currently below the 50 EMA, suggesting short-term bearish pressure remains until this level is reclaimed.
🧠 Market Structure & Price Action:
After a sharp drop from the resistance zone, price found solid footing at the support zone.
Recent candles show rejection wicks from the downside, hinting at potential bullish reversal.
A breakout above minor consolidation and 50 EMA could trigger a bullish continuation toward the resistance.
📌 Forecast:
✅ If the price holds above the support zone and breaks above $108,200, we can expect a bullish move toward $112,000.
⚠️ However, a failure to break above the 50 EMA could lead to a retest of the support zone.
🧭 Trade Idea (Not Financial Advice):
📥 Long Bias:
Entry: On confirmed breakout above $108,200
SL: Below $107,000
TP: $111,800 – $112,300
📌 Conclusion:
The chart setup suggests a potential bullish reversal 📈 from a key support zone, supported by EMA 200. Watch for a break above the 50 EMA for momentum confirmation.
🧠 Always confirm with volume and wait for confirmation before entering a position.
EUR/CAD Bearish Flag Breakdown Toward Fibonacci SuppAnalysis
1. **Trend Breakdown:**
* The chart shows a clear **bearish structure** developing after a strong rally to the 1.58800 area (Fibonacci 1.618 extension level).
* Two upward trendlines were broken successively, confirming bearish momentum.
2. **Fibonacci Levels:**
* The retracement from 1.58800 down to the 0.382 level (1.54586) has held significant importance.
* Price action is respecting the **Fibonacci retracement zones**, with rejection near the 0.786 and 1.0 levels (1.56915 - 1.57109).
3. **Bearish Flag Pattern:**
* A small **bearish flag/pennant** formed after a strong drop, which has now broken downward.
* This confirms the **continuation of the bearish move**.
4. **Volume Confirmation:**
* Volume spikes during the initial sell-off and again on recent bearish candles suggest **strong selling interest**.
5. **Trade Setup (Marked on Chart):**
* **Entry:** Near 1.56443
* **Stop-Loss:** Around 1.57109 (just above recent highs)
* **Target:** Around 1.54848–1.54500 zone, aligning with prior demand and 0.382 Fib level
---
**Conclusion:**
The chart signals a high-probability **short setup**, backed by a break of structure, Fibonacci confluence, bearish flag breakdown, and volume. A continued decline toward the 1.54500–1.54800 region is likely, provided the price stays below 1.57100.

Symmetrical Triangle Breaks – $ETHFI Targets $2+CRYPTOCAP:ETHFI just broke out of a strong symmetrical triangle on the 2H chart finally escaping a long consolidation phase.
Price surged above resistance and reclaimed key EMAs, showing clear bullish momentum. If this breakout sustains, the next leg could take us toward $2.00+
Risk is tight below $1.27 the breakout zone and previous resistance-turned-support.
This move could be the start of something big.
Watch closely!

Dive into the oil storm of 2025!In 2025, oil prices declined due to rising output from OPEC+ countries, growing inventories in the U.S., weakening global demand, a stronger dollar, and ongoing trade tensions between major economies. Further pressure came from OPEC+’s plan to boost production by 411,000 barrels per day — three times more than previously scheduled. A final decision is expected at the May 31 meeting. This move aims to strengthen the Alliance’s market position, particularly against U.S. shale producers, but it has deepened the supply-demand imbalance, pushing prices to their lowest levels in four years .
Despite current challenges, several factors could support a recovery in oil prices :
1. Rising demand in emerging markets : Developing economies are expected to continue increasing energy consumption as they grow, boosting oil demand.
2. Limited investment in production : Lower investment in exploration and drilling — especially in a low-price environment — may lead to tighter future supply, which can support prices.
3. Geopolitical risks : Conflicts and instability in oil-producing regions can disrupt supply chains, traditionally driving prices higher.
4. Slower non-OPEC+ output growth : While non-OPEC+ production is expected to rise in 2025, the U.S. Energy Information Administration forecasts slower growth in 2026, easing pressure on prices.
5. Possible OPEC+ output cuts : If the current production increase fails to deliver the desired results, OPEC+ may reverse course and reduce output to stabilize the market.
In 2025, the oil market is under strain due to surging OPEC+ output, inventory surpluses, weak global demand, and economic uncertainty. Yet, despite prices plunging to four-year lows, there’s still room for recovery. Future price trends will hinge on OPEC+ decisions, emerging market demand, geopolitical events, and investment patterns in the energy sector. The upcoming OPEC+ meeting could be a turning point for the entire market.

$RWA Breakout Alert – Trend Reversal in Play?LSE:RWA just broke out of a falling channel with strong volume — signaling a potential trend reversal.
It’s now retesting the breakout zone near the 0.382–0.5 Fib level, which could act as a support area before the next leg up.
If this reclaim holds, upside targets extend toward $0.017+—a 40%+ move from here.
Keep it on your radar.
DYOR, NFA.

DXY OUTLOOK BEFORE FOMC | Will the Dollar Break Trend DXY OUTLOOK BEFORE FOMC | Will the Dollar Break Trend or Just Retrace?
The US Dollar Index (DXY) has rebounded after weeks of relentless selling pressure, but this bounce is now approaching key decision zones just ahead of two critical events: the April PCE report and the next FOMC meeting. With macro data and sentiment diverging, traders should closely monitor how the dollar reacts to upcoming catalysts.
🌍 MACRO & FUNDAMENTAL CONTEXT
Core PCE Price Index (Apr) – due Friday – is the Fed’s preferred inflation gauge. A higher-than-expected print may reinforce the “higher for longer” stance on rates.
FOMC Minutes revealed a growing divide within the committee: some members remain open to further tightening if inflation stalls.
Bond market stress is emerging again, as 10Y yields hover near 4.5%. Fiscal concerns and treasury auctions are weighing on investor sentiment.
Political noise – particularly from former President Trump’s shifting tariff threats – adds short-term volatility to USD expectations.
🧠 Bottom line: While the dollar has regained ground, macro risks remain asymmetric. A hot PCE may spark short-term demand for USD, but structural credibility risks are still on the table.
📊 TECHNICAL INSIGHT – H1 STRUCTURE
Price Channel: DXY broke slightly above a well-respected descending channel that started mid-May.
EMA Confluence: EMA 13, 34, and 89 are beginning to align upward but haven’t fully confirmed a bullish trend yet.
Key Retest Zone: 99.08 is a critical zone — a Fibonacci 38.2% level of the recent breakout. A hold here may support another test higher.
🔑 KEY TECHNICAL LEVELS
Immediate Support: 99.08 (Fib 38.2% + channel retest)
Mid Resistance: 100.02 (round number + previous structure high + near 200 EMA)
Major Target Zone: 100.48 (Fib 61.8% + multi-day pivot)
📈 POTENTIAL PRICE SCENARIOS
If DXY respects 99.08, a continuation toward 100.02 and even 100.48 is plausible as a technical correction.
If DXY fails to hold 99.08, the breakout above the trend channel may turn into a false break, opening the door for a re-test of lower channel support near 98.30.
Watch for price behavior around 100.02 — aggressive sellers may re-enter at this level, especially if macro data disappoints.
⚠️ STRATEGIC REMINDER
Avoid chasing mid-range price action.
Let the market reveal its hand post-PCE.
Volatility is expected to spike — be patient and let key levels define directional conviction.
