HelenP. I Gold will reach trend line and then start to declineHi folks today I'm prepared for you Gold analytics. Observing this chart, we can see how the price traded inside the support zone, which coincided with the support level, and then dropped below. After this price turned around and made impulse up, reached the 3135 level, broke it, and made a retest. Next, price continued to move up and later it reached the resistance level, which coincided with the resistance zone, and even broke this level and rose to the trend line. But then Gold at once rebounded and fell below the 3385 level, breaking it again, and continued to decline next. When the price fell to 3215 points, it turned around and in a short time rose to the trend line, breaking the resistance level again, after which it turned around and started to fall. Gold broke the 3385 level one more time and later made a gap and then fell to the support level. But not a long time ago, it turned around and started to grow. At the moment, price has almost reached the trend line, so I expect that XAUUSD will reach the trend line finally and then rebound and start to decline. For this case, I set my goal at 3185 points. If you like my analytics you may support me with your like/comment ❤️
Disclaimer: As part of ThinkMarkets’ Influencer Program, I am sponsored to share and publish their charts in my analysis.
Analysis

HelenP. I Bitcoin may continue to grow inside upward channelHi folks today I'm prepared for you Bitcoin analytics. In this chart, we can see how the price has been steadily moving within a well-defined upward channel, respecting its trend structure with clean rebounds from the lower boundary. The price has shown signs of a minor pullback after reaching the upper part of the consolidation range. However, it remains well-supported above the 102700 - 104700 zone, which aligns closely with both the trend line and a previous accumulation area. This confluence strengthens the case for a bullish continuation. Given the consistently higher lows, strong reaction from buyers near the channel support, and the overall bullish momentum, I believe this correction will be short-lived. The market appears to be gathering liquidity before attempting another leg upward. If the current structure holds, BTCUSDT is likely to continue climbing along the lower edge of the channel, gradually pushing toward the next significant target. My current goal remains at 117000 points, a level that aligns with the channel’s upper resistance and reflects the natural extension of the ongoing bullish movement. If you like my analytics you may support me with your like/comment ❤️

Euro will start to grow from support and then leave pennantHello traders, I want share with you my opinion about Euro. Previously, price was moving confidently inside an upward channel, forming steady higher highs and higher lows. After a clear breakout from that structure, the price started consolidating inside a new pattern, an upward pennant. This formation usually appears as a continuation structure, where the market builds pressure before a new impulse. Currently, the price is trading near the middle of the pennant, after rolling down from the resistance line and rebounding up from the support area. The structure is compressing, and a retest of the support line near 1.1155 may occur before a breakout happens. Given the confluence of the pennant structure, the strong support area, and the previous bullish momentum, I expect the Euro to rebound again from the lower trend line and initiate an upward breakout. That’s why I set my TP 1 at the 1.1500 level, a logical target aligned with the upper boundary of the pattern and next key resistance. Please share this idea with your friends and click Boost 🚀
Disclaimer: As part of ThinkMarkets’ Influencer Program, I am sponsored to share and publish their charts in my analysis.

USD/CAD - Triangle Breakout (23.05.2025)The USD/CAD Pair on the M30 timeframe presents a Potential Selling Opportunity due to a recent Formation of a Triangle Breakout Pattern. This suggests a shift in momentum towards the downside in the coming hours.
Possible Short Trade:
Entry: Consider Entering A Short Position around Trendline Of The Pattern.
Target Levels:
1st Support – 1.3792
2nd Support – 1.3760
🎁 Please hit the like button and
🎁 Leave a comment to support for My Post !
Your likes and comments are incredibly motivating and will encourage me to share more analysis with you.
Best Regards, KABHI_TA_TRADING
Thank you.
Disclosure: I am part of Trade Nation's Influencer program and receive a monthly fee for using their TradingView charts in my analysis.

IS THE BULLISH CHANNEL NEARING EXHAUSTION OR JUST GEARING UP?GBPUSD OUTLOOK – IS THE BULLISH CHANNEL NEARING EXHAUSTION OR JUST GEARING UP?
📊 Macro Overview:
The USD continues to soften slightly as markets begin pricing in a potential rate cut by the Fed later in Q3. Meanwhile, the British Pound (GBP) is holding firm, supported by stronger-than-expected UK macroeconomic data—particularly retail sales and inflation figures.
However, UK fiscal concerns remain a headwind, and GBPUSD is highly sensitive to upcoming U.S. data—especially Core PCE and employment figures this week.
📉 Technical Analysis:
On the 1H chart, GBPUSD is moving within a broad ascending channel and is now approaching the upper resistance trendline at 1.3555 – a key zone that could trigger short-term profit-taking.
EMAs 13 and 34 are still in bullish alignment, supporting ongoing momentum.
Despite the bullish setup, current candle structure suggests a potential pullback to the 1.3448 support zone before a continuation higher—if buyers regain control.
🔑 Key Price Levels:
Resistance Zones:
🔸 1.3555 – Channel top resistance
🔸 1.3586 – Extended resistance zone
Support Zones:
🔹 1.3448 – Technical and Fibo confluence
🔹 1.3398 – Major structure support in case of breakdown
🛠️ Trade Scenarios:
✅ Scenario 1: BUY on retracement
Entry: 1.3448 (watch for bullish confirmation on H1)
Stop Loss: 1.3394
Take Profit: 1.3500 → 1.3555 → 1.3585
✅ Scenario 2: SELL scalp from resistance
Entry: 1.3555
Stop Loss: 1.3588
Take Profit: 1.3500 → 1.3460
🧠 Final Thoughts:
GBPUSD remains bullish in structure but is testing key resistance levels. A clean pullback to the 1.3448 region may provide a strong buying opportunity if confirmed by price action. If this level breaks, bearish divergence could kick in and push the pair back to deeper support zones. Stay alert for high-impact economic releases and trade with solid risk management!

GBP/USD - Triangle Breakout (23.05.2025)The GBP/USD pair on the M30 timeframe presents a Potential Buying Opportunity due to a recent Formation of a Triangle Pattern. This suggests a shift in momentum towards the upside and a higher likelihood of further advances in the coming hours.
Possible Long Trade:
Entry: Consider Entering A Long Position around Trendline Of The Pattern.
Target Levels:
1st Resistance – 1.3502
2nd Resistance – 1.3534
🎁 Please hit the like button and
🎁 Leave a comment to support for My Post !
Your likes and comments are incredibly motivating and will encourage me to share more analysis with you.
Best Regards, KABHI_TA_TRADING
Thank you.
Disclosure: I am part of Trade Nation's Influencer program and receive a monthly fee for using their TradingView charts in my analysis.

Digital gold breaks records: Bitcoin broke through the $111,000 On May 22, 2025, Bitcoin (#BTCUSD) reached a new all-time high, surpassing the $111,000 mark. Notably, this record was set on the day marking the 15th anniversary of Bitcoin Pizza Day - a symbolic date commemorating the first real-world purchase made with #BTCUSD in 2010.
Several major factors have contributed to the recent rise of Bitcoin:
Institutional Investment : The launch of spot Bitcoin ETFs by BlackRock, Fidelity, and others has opened the door for large-scale investors to access #BTCUSD, boosting both liquidity and demand.
Regulatory Clarity : The adoption of clear cryptocurrency regulations in the U.S. and the EU has increased trust in digital assets and attracted more conservative capital.
Banking Integration : Support for #BTCUSD by apps like PayPal, Revolut, and major banks has simplified access for millions of users and expanded its real-world usage.
Macroeconomic Instability : Inflation, geopolitical tensions, and the weakening of fiat currencies have strengthened demand for #BTCUSD as "digital gold" and a means of capital preservation.
Halving and Technological Progress : The reduction in BTC issuance and the ongoing development of the Lightning Network are reinforcing Bitcoin’s scarcity and enhancing its fundamental value.
Surpassing such a significant price level has reinforced #BTCUSD’s position as one of the key assets in today’s financial markets, confirming its status as "digital gold." The rally has sparked a wave of optimism and renewed activity on crypto exchanges, while also drawing increased interest in digital assets from the broader public.
FreshForex analysts share the view that #BTCUSD still holds significant growth potential. In our assessment, the breakout above $111,000 in May signals a continuing upward trend and the possibility of further gains, driven by growing institutional interest.

GOLD XAUUSD PLAN – MAY 23 IS GOLD READY TO SURGE AGAIN?GOLD XAUUSD PLAN – MAY 23 | GEOPOLITICAL RISKS FLARE UP – IS GOLD READY TO SURGE AGAIN?
🌍 MACRO CONTEXT:
Iran-Israel-US Tension: Iran has warned that if Israel attacks its nuclear facilities, the U.S. will also be held responsible. Tehran vows to take “special measures” to protect its nuclear program, and has filed formal complaints with the UN. Markets are reacting sharply to this growing geopolitical risk.
Goldman Sachs Alert: Goldman Sachs recommends gold and crypto (Bitcoin) as safe-haven assets amidst soaring bond yields, fiscal crisis fears, and a failed 20-year U.S. Treasury auction. They warn that rising yields are now posing serious threats to equities while the dollar faces longer-term pressure.
📉 TECHNICAL OUTLOOK (M30):
Price has bounced off the 3303 zone, and is showing signs of a bullish breakout if 3360 is taken out.
There is a clear Fair Value Gap (FVG) above 3360–3380, which has yet to be fully filled. Below, the untested FVG zone near 3274–3250 remains vulnerable if support fails.
EMA 13 is trending above EMA 34 and EMA 200 → bullish bias remains valid as long as 3274 holds.
🔑 KEY LEVELS TO WATCH:
SELL Side Key Level: 3358–3360 → A breakout above this zone could lead to a retest of ATH near 3400–3450.
BUY Side Key Level: 3276–3274 → Losing this zone could push gold back below 3200, targeting deeper correction levels.
📈 TRADE SETUPS:
🔵 BUY ZONE: 3276 – 3274
SL: 3270
TPs: 3280 → 3284 → 3288 → 3292 → 3296 → 3300
🔵 BUY SCALP: 3304 – 3302
SL: 3298
TPs: 3308 → 3312 → 3316 → 3320 → 3325 → 3330 → 3340
🔴 SELL ZONE: 3376 – 3378
SL: 3382
TPs: 3372 → 3368 → 3364 → 3360 → 3350
🔴 SELL SCALP: 3344 – 3346
SL: 3350
TPs: 3340 → 3336 → 3332 → 3328 → 3324 → 3320
🧠 FINAL THOUGHTS:
Gold remains highly sensitive to geopolitical headlines and macro instability. As long as the 3303 support area holds, look for bullish continuation towards FVG highs. Break below 3274 may shift the bias sharply to the downside. Stay alert — volatility is expected to rise ahead of the next U.S. data and developments in the Iran nuclear issue.GOLD XAUUSD PLAN – MAY 23 | GEOPOLITICAL RISKS FLARE UP – IS GOLD READY TO SURGE AGAIN?
🌍 MACRO CONTEXT:
Iran-Israel-US Tension: Iran has warned that if Israel attacks its nuclear facilities, the U.S. will also be held responsible. Tehran vows to take “special measures” to protect its nuclear program, and has filed formal complaints with the UN. Markets are reacting sharply to this growing geopolitical risk.
Goldman Sachs Alert: Goldman Sachs recommends gold and crypto (Bitcoin) as safe-haven assets amidst soaring bond yields, fiscal crisis fears, and a failed 20-year U.S. Treasury auction. They warn that rising yields are now posing serious threats to equities while the dollar faces longer-term pressure.
📉 TECHNICAL OUTLOOK (M30):
Price has bounced off the 3303 zone, and is showing signs of a bullish breakout if 3360 is taken out.
There is a clear Fair Value Gap (FVG) above 3360–3380, which has yet to be fully filled. Below, the untested FVG zone near 3274–3250 remains vulnerable if support fails.
EMA 13 is trending above EMA 34 and EMA 200 → bullish bias remains valid as long as 3274 holds.
🔑 KEY LEVELS TO WATCH:
SELL Side Key Level: 3358–3360 → A breakout above this zone could lead to a retest of ATH near 3400–3450.
BUY Side Key Level: 3276–3274 → Losing this zone could push gold back below 3200, targeting deeper correction levels.
📈 TRADE SETUPS:
🔵 BUY ZONE: 3276 – 3274
SL: 3270
TPs: 3280 → 3284 → 3288 → 3292 → 3296 → 3300
🔵 BUY SCALP: 3304 – 3302
SL: 3298
TPs: 3308 → 3312 → 3316 → 3320 → 3325 → 3330 → 3340
🔴 SELL ZONE: 3376 – 3378
SL: 3382
TPs: 3372 → 3368 → 3364 → 3360 → 3350
🔴 SELL SCALP: 3344 – 3346
SL: 3350
TPs: 3340 → 3336 → 3332 → 3328 → 3324 → 3320
🧠 FINAL THOUGHTS:
Gold remains highly sensitive to geopolitical headlines and macro instability. As long as the 3303 support area holds, look for bullish continuation towards FVG highs. Break below 3274 may shift the bias sharply to the downside. Stay alert — volatility is expected to rise ahead of the next U.S. data and developments in the Iran nuclear issue.

SOL/USDTHello, I hope you are well. I left you the analysis of Solana. Tell me your opinion. I saw that it is bullish and it may reach the target I set. If the white area breaks, we can buy again and go up.

Fundamental Market Analysis for May 23, 2025 EURUSDEvent to pay attention today:
17:00 EET. USD- Volume of home sales on the primary market
EURUSD:
EUR/USD is recovering its recent losses from the previous session and is trading around 1.1310 during Asian hours on Friday. The pair is rising on the back of lower US Treasury yields, which continue to decline after the US 30-year bond yield retreated from 5.15 per cent, the highest in 19 months.
US President Donald Trump's ‘One Big Beautiful Bill’ has passed the House of Representatives and is on its way to the Senate, sparking fears of a widening budget deficit in the United States (US).
However, EUR/USD lost around 0.50 per cent on Thursday as the US dollar gained as the S&P Global Composite Purchasing Managers' Index (PMI) for May came in at 52.1, up from April's 50.6. Meanwhile, the manufacturing PMI rose to 52.3 from 50.2 previously, while the services PMI rose to 52.3 from 50.8.
Fed Chairman Christopher Waller noted on Thursday that markets are watching fiscal policy. Waller also said that if rates are close to 10%, the economy will be in good shape for H2 and the Fed may be in a position to cut rates later this year.
The Financial Times reported that President Trump is pushing the European Union (EU) to cut tariffs or impose more duties. US Trade Representative Greer is set to tell fellow EU Commissioner for Trade and Economic Security, Maroš Šefčovič, that the recent ‘explanatory memorandum’ does not meet US expectations.
Trading recommendation: BUY 1.13200, SL 1.13000, TP 1.14200

XAUUSD - A few pips to the downsideBased on structure and pattern formations, likely to short this trade to the downside before expecting some considerable movement to the upside.

US10Y Technical Breakdown – Post-Moody’s DowngradeMoody’s has downgraded the US credit rating for the first time since 2011, citing rising debt levels and long-term fiscal challenges.
This move sends a clear warning signal about America’s fiscal path and adds fresh uncertainty to markets already navigating interest rates, inflation, and geopolitical risks.
Focus on the US 10-Year Treasury Yield as the market’s pulse on sovereign risk, inflation expectations, and future borrowing costs. Tracking its medium-term trend will provide crucial clues on market sentiment and risk appetite.
Medium-Term Market Analysis
(6-12 Months)
1. Structural Fiscal Risks
This downgrade highlights growing concerns over the US debt trajectory and political gridlock around spending and debt ceilings.
It’s less about an immediate crisis, more about long-term sustainability.
2. Rising Yields and Market Volatility
The 10-year Treasury yield could move higher, beyond 4.60% we could see rates possibly testing previous resistance of 4.80% (Jan 2025) or 5.00% (Oct 2023).
Higher yields mean increased borrowing costs, which can pressure interest-sensitive sectors like tech and real estate and add volatility to equities.
3. Federal Reserve’s Tough Balancing Act
With bond yields edging up, the Fed faces a dilemma: delaying cuts further could risk inflation climbing higher.
However, this downgrade raises the likelihood that the Fed could keep rates higher for longer than many investors expect.
4. Dollar and Capital Flow Shifts
While a credit downgrade may initially pressure the US dollar, its safe-haven status remains strong.
Global capital could increasingly look to alternatives like emerging markets or gold, leading to shifts in international financial flows.
Perspective
While Moody’s downgrade is a serious signal, it’s important to consider:
1) Political Leverage: Sometimes, rating agencies’ decisions can influence political negotiations. This downgrade may add pressure on US lawmakers to reach fiscal compromises. It’s a tool, not necessarily a verdict.
2) US Dollar & Debt Demand Resilience: Despite concerns, US Treasury securities remain the world’s primary safe asset, with global demand still robust. This could temper yield spikes and limit fallout.
Some could view the downgrade as “priced in” to a degree, given ongoing debt ceiling battles and past political brinkmanship.
If true, markets may react less dramatically than feared.
Watch
US 10-Year Yield: Key indicator to watch for shifts in risk sentiment and inflation expectations.
Equities: Prepare for increased volatility; consider defensive sectors and value plays.
Credit Markets: Monitor for widening spreads as risk aversion grows.
Policy Signals: Fed communications and US political developments will be critical catalysts.
This Moody’s downgrade isn’t just a headline, it’s a medium-term signal to recalibrate risk and position for a more uncertain fiscal backdrop.

EUR/USD Forming Double Top –Bearish Reversal Toward Key Support?📉 EUR/USD Technical Outlook – Bearish Bias Developing 🔍
🟪 Key Resistance Zone:
📍 1.1350 – 1.1450
Price has tested this resistance zone multiple times, forming a double-top pattern (🔄) within the highlighted circle. This signals buying exhaustion and potential reversal pressure. The recent failure to break above confirms the zone’s strength.
🔴 EMA Confluence:
🧭 50 EMA (red): ~1.1242
🧭 200 EMA (blue): ~1.0961
The price is currently hovering just above the 50 EMA but well above the 200 EMA, which is acting as a dynamic support. The crossover has already occurred, so if price breaks below the 50 EMA decisively, momentum could shift bearish.
🔻 Support Breakdown Risk:
A breakdown from the 1.1200 neckline area (highlighted in red oval) would confirm the double-top pattern 🎯. That opens downside potential toward the strong demand zone below.
🟪 Strong Support Zone:
📍 1.0700 – 1.0800
This area aligns with prior consolidation (March lows) and the 200 EMA, making it a high-probability reversal zone 📈 if the bearish scenario plays out.
📌 Trade Setup Insight:
✅ Bearish confirmation below 1.1200 neckline 📉
🎯 Target: 1.0800 zone
❌ Invalidation: Break above 1.1350 resistance
🔵 Summary:
The chart is hinting at a classic double-top reversal below a key resistance zone. If price breaks the neckline, sellers are likely to gain control, targeting the strong support near the 200 EMA.
📊 Bias: Bearish 👇
📅 Timeframe: Daily
🛑 Risk Management: Watch for fake-outs near neckline; volume confirmation preferred.

#ChillGuy Breakout Confirmed – Long Setup Active!#ChillGuy has broken out of a symmetrical triangle and is currently holding above horizontal support in the short term, which looks strong !
We can consider a long position at the current market price (CMP) with a stop-loss at $0.0857.
If the market plays out as expected, we could see a solid move from here.
DYOR, NFA

Bitcoin may break support level and fall to support lineHello traders, I want share with you my opinion about Bitcoin. In this chart, we can see how the price a few moments ago declined, but then turned around and started to grow inside an upward wedge. Price at once rebounded from the support line of the wedge and made an upward impulse to the support level, which coincided with the buyer zone, after which it broke it and made a retest. Then BTC rose to the resistance line, after which it corrected to the 100900 support level and then started to slowly grow in the wedge. Some time later, Bitcoin rose to the current support level, which coincided with the support area and even climbed a little higher to the resistance line of the wedge, but soon dropped to the support line. Next, price turned around and made an upward impulse from this line, breaking the 105800 level, and at once made a retest. After this movement, BTC continued to grow and reached the resistance line of the wedge, but recently it rolled down, so now I expect that the price can rise a little. After this movement, in my opinion, BTC can drop to the support line of the wedge, breaking the current support level. Therefore, I set my TP at this line - 104200 points. Please share this idea with your friends and click Boost 🚀

GOLD - Price can bounce up from pennant to $3380 pointsHi guys, this is my overview for GOLD, feel free to check it and write your feedback in comments👊
A few moments ago price reached resistance level, but then bounced and started to flat, breaking this level again.
In flat, price declined to support level, which coincided with support area, and then started to grow.
In a short time, Gold exited from flat, breaking $3325 level and then entered to pennant, where it started to fall.
Price soon broke $3325 level again and made a gap, after which dropped to support line of pennant, breaking $3205 level.
But then price quickly turned back, breaking $3205 level again and even reached resistance level, after which corrected.
Now I think that Gold can decline to support line of pennant and then bounce up to $3380, exiting from this pattern.
If this post is useful to you, you can support me with like/boost and advice in comments❤️
Disclaimer: As part of ThinkMarkets’ Influencer Program, I am sponsored to share and publish their charts in my analysis.

USDCAD RETEST OR FRESH DOWNTREND? PRICE AT A CRUCIAL CROSSROAD!USDCAD 22/05 – KEY RETEST OR FRESH DOWNTREND? PRICE AT A CRUCIAL CROSSROAD!
🌐 MACRO BACKDROP:
Canada’s CPI and Retail Sales have come in weaker than expected, signaling sluggish consumer demand and reducing the probability of near-term rate hikes by the Bank of Canada.
Meanwhile, the USD is stabilizing, supported by steady U.S. Treasury yields after the Fed reaffirmed its “higher for longer” stance.
Oil prices, a major driver of the Canadian Dollar, have shown no significant breakout, further weakening CAD’s bullish momentum.
🔍 TECHNICAL OVERVIEW (H1–H4 Chart):
After hitting a key swing low at 1.3820, USDCAD is now retracing towards the 0.5 Fibonacci zone (1.3889 – 1.3913), which also aligns with:
The 200 EMA resistance (red line)
Previous structure rejection zone
➡️ This area is critical – it could act as a trap zone before price resumes downward or breaks to confirm a short-term bullish reversal.
📈 TRADE SETUPS:
🔻 SELL SETUP (HIGH PROBABILITY IF PRICE FAILS AT RESISTANCE):
Entry: 1.3900 – 1.3913
Stop Loss: 1.3930
Take Profit Targets: 1.3884 → 1.3859 → 1.3847 → 1.3820
🔹 BUY SETUP (IF PRICE HOLDS ABOVE THE BASE ZONE):
Entry: 1.3820 – 1.3823
Stop Loss: 1.3805
Take Profit Targets: 1.3847 → 1.3880 → 1.3913
⚠️ STRATEGY NOTES:
Be cautious during the New York session, as potential comments from Fed officials or crude oil updates could spike volatility.
This is a textbook case of “reaction vs. continuation” at a Fibo cluster – stick to confirmed candlestick signals to avoid false breakouts.
📌 FINAL THOUGHTS:
USDCAD is in a corrective rally after an extended decline. The 1.3913 zone is a key decision point. Sellers should watch for signs of exhaustion, while buyers can target short-term retracements if support holds at 1.3820.

BREAKOUT OR REJECTION? WATCH 0.64137 KEY ZONE CLOSELY! AUDUSD 22/05 – BREAKOUT OR REJECTION? WATCH 0.64137 KEY ZONE CLOSELY!
🌐 MACRO OVERVIEW
DXY is starting to lose momentum after a sharp rally fueled by the Fed’s hawkish stance. However, there’s still no clear signal of an imminent rate cut.
Meanwhile, the RBA (Reserve Bank of Australia) maintains a steady policy, offering short-term support for AUD. While rates remain unchanged, the central bank’s cautious tone adds a defensive layer for the Aussie.
On the trade front, Australia has seen marginal recovery in commodity prices, though ongoing concerns about Chinese economic slowdown continue to weigh on sentiment.
📊 TECHNICAL ANALYSIS (Timeframes: H1 – H4)
AUDUSD is forming a tight symmetrical triangle, with lower highs and higher lows — a typical precursor to a breakout.
The current price at 0.6418 is sitting right along the lower trendline. Price action here is critical to determine today’s direction.
🔍 Scenario A – Upside Breakout (30% probability):
If price breaks and closes above 0.64700–0.64910, we could see bullish continuation toward the 0.65134 resistance zone.
🔍 Scenario B – Breakdown (70% probability):
A strong break below 0.64137 could trigger a move toward 0.63964 and potentially deeper into the 0.63640 liquidity zone.
🎯 TODAY'S TRADE PLAN
🔵 BUY SCALP (only if price reacts strongly at trendline support)
Entry: 0.6414 – 0.6416
SL: 0.6408
TP Targets: 0.6445 → 0.6470 → 0.6490
🔴 SELL SETUP (if triangle is broken to the downside)
Entry: 0.6405 – 0.6396
SL: 0.6420
TP Targets: 0.6364 → 0.6340
⚠️ IMPORTANT NOTES
Expect high volatility during the U.S. session as PMI and Unemployment Claims data are released.
Stick to your TP/SL levels with discipline — the market may sweep liquidity on both sides before choosing a direction.
📌 SUMMARY:
AUDUSD is consolidating in a clean technical pattern while macro uncertainty looms. Whether we break up or down, the key is to trade what the market gives — not what we think. React to confirmation, not prediction.

STRUCTURE SHIFT OR FALSE BREAKOUT? MAJOR MOVE LOADING? EURUSD 22/05 – STRUCTURE SHIFT OR FALSE BREAKOUT? MAJOR MOVE LOADING?
🌐 MACRO OUTLOOK
The market remains caught between dovish expectations and hawkish reality. While recent US CPI and PPI came in weaker than expected, Fed officials have refrained from confirming any imminent rate cuts, keeping the dollar resilient in the medium term.
Meanwhile, the ECB’s cautious stance and ongoing inflation risks across the eurozone continue to cap euro strength. The divergence in tone between the Fed and the ECB adds to the short-term volatility and uncertainty around EURUSD’s direction.
📉 TECHNICAL ANALYSIS (H1 + H4 Timeframe)
EURUSD has faked a breakout above the 1.1310–1.1320 resistance zone and is now pulling back to the key structure support around 1.1279 — a critical short-term level.
📌 Key Observations:
Bearish engulfing candle formed on H1 after price rejected the upper zone → potential reversal signal.
EMA 13 is crossing below EMA 34 → suggesting short-term downside pressure.
A confirmed H1 close below 1.1279 opens room for deeper retracement towards 1.1234 (previous demand/FVG area).
If momentum builds, we could see a broader correction toward 1.1148 in the coming days.
⚙️ TRADE STRATEGY FOR TODAY
🔻 PRIMARY SCENARIO – SELL THE RALLY
Entry Zone: 1.1315 – 1.1318 (near FVG + fake breakout zone)
Stop Loss: 1.1360
Take Profit Targets:
→ TP1: 1.1279
→ TP2: 1.1234
→ TP3: 1.1148
🔹 ALTERNATE SCENARIO – BUY SCALP ON STRONG REACTION
Buy Entry: 1.1234 – 1.1230 (only with bullish M15 confirmation)
Stop Loss: 1.1210
Take Profit: 1.1279 → 1.1300
🧠 STRATEGIC INSIGHT
A D1 candle close below 1.1234 will confirm a structure break and likely initiate a deeper downward trend.
On the flip side, if 1.1234 holds and US jobless claims disappoint later today, EURUSD may recover back to test 1.131x.
Market sentiment is highly reactive — stay flexible and prioritize price action confirmation.
📌 FINAL THOUGHTS:
EURUSD is at a pivotal point — either confirming a new downtrend or bouncing back within the current range. This is a trader’s market: clear key levels, disciplined risk management, and adaptive execution are essential.
📈 Follow for real-time chart updates, FVG mapping, and more daily trading setups.
Stay smart, stay sharp. Risk management first.

FVG LIQUIDITY & POLITICAL SHOCKS: WILL THE SELLERS STRIKE BACK?GOLD PLAN 22/05 – FVG LIQUIDITY & POLITICAL SHOCKS: WILL THE SELLERS STRIKE BACK?
🌍 Fundamental & Geopolitical Overview:
🔺 Breaking Political News:
On the night of May 21, two Israeli embassy officials were fatally shot near the Jewish Museum in Washington in what’s being labeled an anti-Semitic terrorist act.
→ Former President Trump condemned the attack, calling it “disgusting” and demanding an end to extremism.
→ Events like these typically boost gold as a safe haven, but this time the market appears hesitant.
🔺 Meanwhile, the Federal Reserve remains hawkish, signaling “higher-for-longer” interest rates.
→ This continues to support USD strength, putting downward pressure on gold.
🔍 Technical Outlook (H1):
Gold (XAUUSD) recently topped around 3397, followed by a strong bearish rejection candle at that level.
Two Fair Value Gaps (FVG) are now defining market sentiment:
Upper FVG: 3330 – 3356 (partially filled)
Lower FVG: 3277 – 3247 → highly likely to be targeted if breakdown occurs.
EMA 13 & EMA 34 are flattening out, indicating consolidation within a breakout range.
🧭 Trade Strategy for Today:
🔻 PRIMARY SELL ZONE:
Entry: 3395 – 3397
Stop Loss: 3401
Take Profit: 3390 → 3386 → 3380 → 3376 → 3370
🔻 SELL SCALP:
Entry: 3358 – 3360
Stop Loss: 3364
Take Profit: 3354 → 3350 → 3346 → 3342 → 3338 → 3330
🔵 BUY ZONE:
Entry: 3296 – 3294
Stop Loss: 3290
Take Profit: 3300 → 3304 → 3308 → 3315 → 3320 → 3330 → ???
🔵 BUY SCALP:
Entry: 3316 – 3314
Stop Loss: 3310
Take Profit: 3320 → 3324 → 3328 → 3332 → 3340 → 3350
⚠️ Key Things to Watch:
FBI and White House responses to the DC shooting could ignite renewed risk-off sentiment, pushing gold higher suddenly.
A break above 3400 invalidates today’s setup – expect renewed bullish pressure if that happens.
📌 Pro Tip: Don’t chase the market. Let price come to your zones. Respect SL/TP and manage risk – especially on volatile days like today.
📣 Follow this account for live updates, scalping levels, and macro-triggered trading zones in real time!

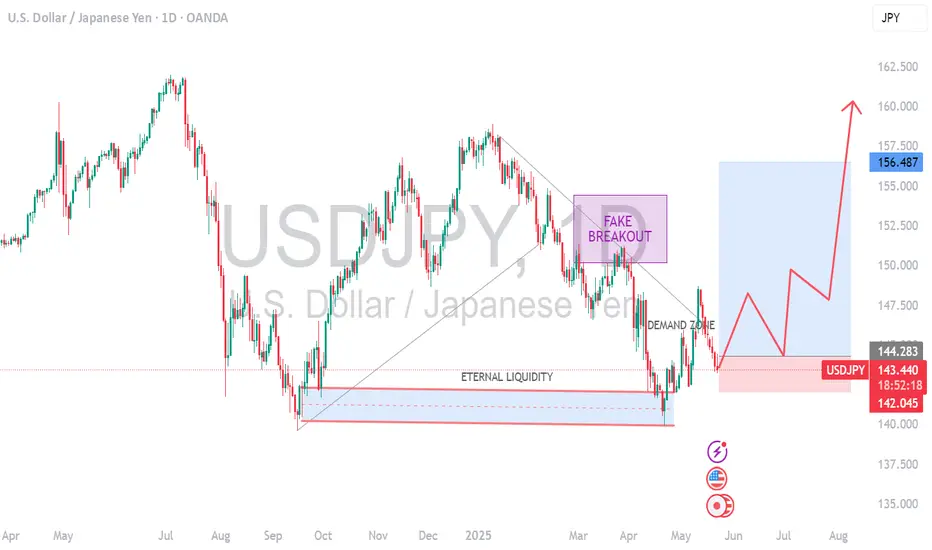
USDJPY- IS it a beginning of major bulish trend nowthe USD/JPY pair is currently in a major bullish trend, driven by several key factors:
1. Interest Rate Differentials: The U.S. Federal Reserve maintains higher interest rates compared to the Bank of Japan, attracting capital flows into the U.S. dollar and away from the yen.
2. Dovish Bank of Japan: Despite global tightening, the BOJ remains cautious about raising rates or ending yield curve control, weakening the yen further.
3. Robust U.S. Economic Data: Strong economic indicators from the U.S. (such as inflation, jobs, and GDP growth) continue to support expectations of prolonged higher rates, boosting the dollar.
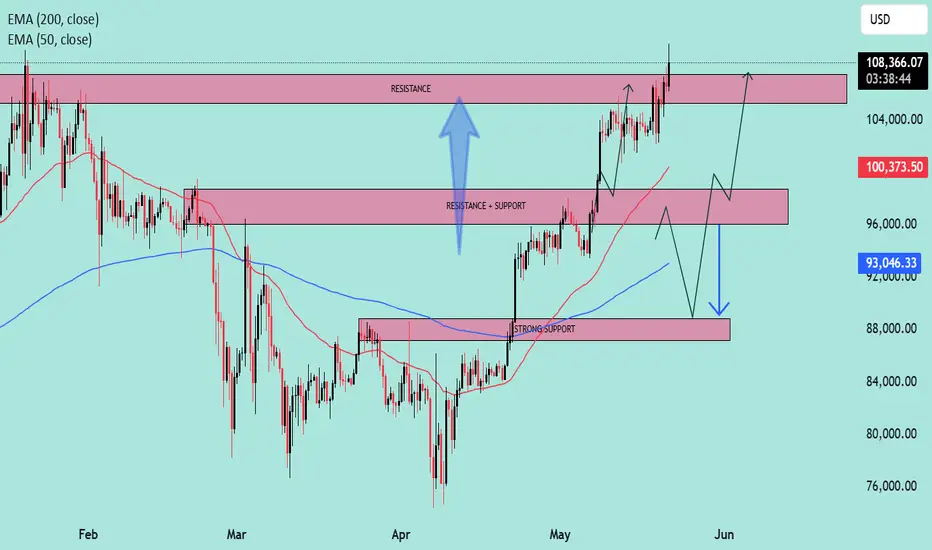
Technical Levels Respected – BTC Reaches $108K Target what next?📍 BTC Target Hit with Precision!
✅ As predicted in the previous analysis, Bitcoin has successfully tapped the $108K resistance zone — clean and technical execution!
📊 My chart spoke in advance... and the market listened.
🎯 Why miss out on these accurate forecasts?
📉 My strategies are not just random lines — they’re built on solid market structure, EMAs, and key price action zones.
📢 Let’s stay connected!
🧠 I’m committed to sharing educational content and professional trading insights to help you grow as a trader.
💡 Whether you're a beginner or seasoned trader, there’s always something new to learn with me.
📚 Join the journey — learn, trade, and win!
📩 DM or follow to get consistent updates and chart breakdowns.
🚀 Let’s trade smart, not hard!
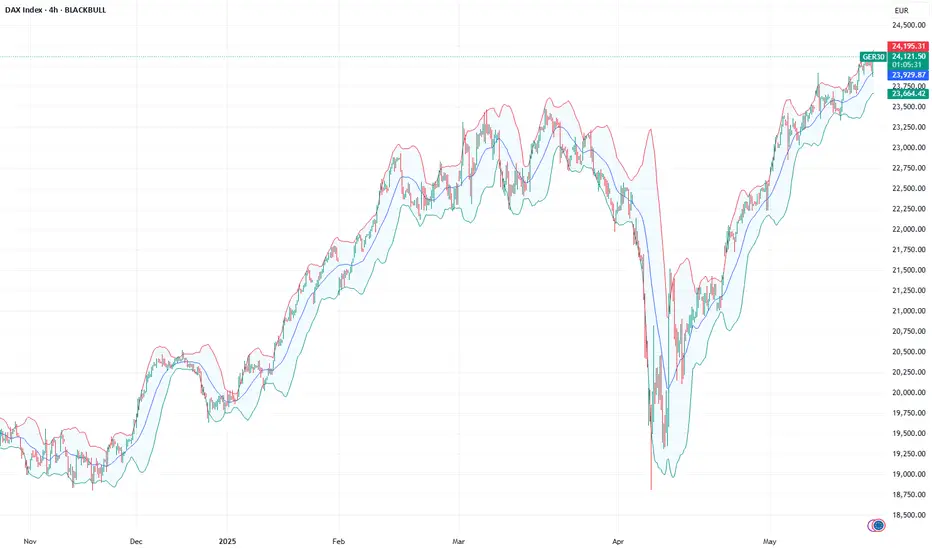
#DAX30 Surges to 24,000: What’s Behind the Record-Breaking RallyOn May 20, 2025, Germany’s benchmark stock index, the #DAX30, crossed the 24,000-point threshold for the first time in its history, reaching an all-time high of 24,079.40. This historic milestone reflects growing investor confidence in the prospects of Europe’s largest economy.
The surge of the #DAX30 beyond the 24,000 mark was driven by a combination of key factors:
Improved geopolitical climate : Global tensions have eased — most notably between the United States and China. Signs of de-escalation in trade policy between the world’s largest economies have bolstered investor confidence. Additionally, an improved negotiation climate in Eastern Europe, particularly due to reduced conflict in Ukraine, has helped lower market uncertainty.
Strong corporate earnings : Major German corporations within the #DAX30 have posted robust quarterly results. Leading the charge were technology giants (e.g., SAP) and industrial powerhouses (such as Siemens and BMW), which reported increased profits despite a challenging macroeconomic environment. This has reinforced confidence in the resilience of German businesses.
ECB monetary policy expectations : Markets are pricing in a potential easing of the European Central Bank’s monetary policy. Although interest rates remain elevated, growing signals of a possible rate cut in the second half of 2025 are stimulating equity markets and making stock investments more attractive.
Export growth and trade optimism : The reduction of trade barriers, a stronger euro, and a rebound in global trade have positively impacted export-driven German companies. As one of the world’s leading export economies, Germany is benefiting from a renewed global demand recovery.
Hopes for domestic reforms : The German government is actively pushing investments in infrastructure, digital transformation, and the green economy. These initiatives are boosting investor sentiment, particularly in the technology and sustainable energy sectors.
Technical momentum : From a technical perspective, the breakout above the 24,000 level served as a catalyst for speculative capital inflows. Many traders and funds that follow trends and resistance levels initiated buy positions after the breakout, amplifying the upward momentum.
This combination of fundamental and technical drivers has created a powerful growth impulse for the # DAX30 . According to analysts at FreshForex, the index may continue its upward trajectory — provided current macroeconomic stability is maintained.