Don't trade Aussie this week!Dear traders,
Among the top 8 forex market currencies, tariffs war affects the Aussie most, because Australia is highly dependent on China.
Rank Trading Partner Exports (A$ million)
1 China 185,141
2 Japan 119,889
3 European Union 31,816
4 United States 30,690
Uncertainty about China's future means, fluctuations in Aussie. I don't trade AUDUSD this week,
only if everything goes well with negotiations between Trump and China, I might use confirmed break over zone of 0.64355 to take long trades.
Regards, Ali
Analysis

NZDJPY Long: Fib 0.786 Retest + Strong NZD Momentum🔹 Pair: NZD/JPY
🔹 Timeframe: Daily
🔹 Direction: Long
🔹 Status: Price holding Fib 0.786 retracement level (bullish structure intact)
🔹 Entry Zone: ~85.50–85.60 (Live entry)
📊 Fundamental Confluence
🇳🇿 NZD – Bullish Momentum
Conditional Score Jump: 🚀 From 8 → 13 (Strongest improvement this week).
Seasonality: 🔼 Strong seasonal bias from mid-May onward.
CB Stance: Hawkish — RBNZ cautious but maintains restrictive policy.
Global Risk-On: VIX < 20 supports high-beta currencies like NZD.
🇯🇵 JPY – Weakening
BoJ Outlook: Delayed inflation target to 2027 = no urgency to tighten.
Score Flat: Minor improvement (11 → 12), not enough to change bias.
Risk Sentiment: Safe-haven demand dropping, weakening JPY.
Macro Drag: Japan underperforming vs G7 counterparts.

XAUUSD GOLD Just Grabbed liquidity Below a key low analysis Full Guide: How to Use COT Data for Trading XAUUSD (Gold)
1. What is COT Data?
The Commitment of Traders (COT) report is a weekly publication by the Commodity Futures Trading Commission (CFTC). It shows the aggregate positioning of different types of traders in the futures markets.
For XAUUSD (Gold), you’ll look at the Gold futures (COMEX) section.
2. Key Trader Categories in COT Report
1. Commercials (Hedgers):
Typically big institutions or producers like mining companies.
They use futures to hedge exposure, not speculate.
Usually short during rallies and long when price is low.
2. Non-Commercials (Large Speculators):
Hedge funds, money managers.
Considered the "smart money." Full Guide: How to Use COT Data for Trading XAUUSD (Gold)
1. What is COT Data?
The Commitment of Traders (COT) report is a weekly publication by the Commodity Futures Trading Commission (CFTC). It shows the aggregate positioning of different types of traders in the futures markets.
For XAUUSD (Gold), you’ll look at the Gold futures (COMEX) section.
---
2. Key Trader Categories in COT Report
1. Commercials (Hedgers):
Typically big institutions or producers like mining companies.
They use futures to hedge exposure, not speculate.
Usually short during rallies and long when price is low.
2. Non-Commercials (Large Speculators):
Hedge funds, money managers.
Considered the "smart money."
Follow trends and often drive major moves.
3. Nonreportables (Retail/Small Traders):
Smaller traders, often contrarian indicators.
Not always consistent with price direction.
---
3. Where to Find COT Data
CFTC Website
Tools like:
Tradingster.com
BarChart.com
COTbase.com
Look for "Legacy" or "Disaggregated" COT reports for Gold - COMEX.
---
4. How to Read the COT Data for Gold
Key Metrics:
Longs/Shorts: Number of contracts held.
Net Positions: Longs minus Shorts.Changes WoW: Increase/decrease in positions compared to the prior week.
Example Insight:
If Non-Commercials are heavily net long, and reaching historical highs, market may be overbought.
If Commercials increase shorts significantly, they may be preparing for a price decline.
A divergence between price action and COT data often signals potential reversal.
---
5. Using COT for Gold Trading (XAUUSD)A. Trend Confirmation
Rising net long positions by non-commercials = bullish confirmation.
Decreasing net long or rising shorts = weakening trend or reversal.
B. Reversal Spotting
Extremes in positioning (e.g., record longs by speculators) often precede reversals.
Look for non-commercials reducing longs while commercials increase shorts—potential top.
C. Liquidity Grabs and COT
If gold grabs liquidity (stop hunts) and COT shows heavy speculative positioning, that could be a smart money trap.
A strong bullish reversal after liquidity grab with increasing net longs confirms a momentum shift.
---
6. How to Combine COT with Technical Analysis
Use COT to validate or question what you see on the chart.
Example Setup:
Chart: Gold drops below key support (liquidity grab).
COT: Non-commercials increase longs that week.
Conclusion: Smart money bought the dip — potential for bullish reversal.
Combine with:
Market structure
Volume
Sentiment tools
Price action (e.g., bullish engulfing, break of structure)
---
7. Limitations and Tips
Lagging Data: COT is released every Friday for data on Tuesday.
Use it for context and macro positioning, not for intraday trades.
Look at weekly or monthly trends, not daily.
Best used alongside price action and other confirmation signals.
---
Conclusion
COT data is a powerful tool for understanding who is behind the move in gold. By tracking the positioning of major players, you can:
Confirm trends
Spot early signs of reversal
Align your trades with institutional momentum

btc . recap . w3 . maymon to eager . wait mon to show its hand - cw!
. early LONG compound because of the bullish outlook
- tp2 108462
tue didn't ride momentum - blind bullish
. tp1 HIT
. missed SHORT at 10pm (UTC+2)
- should have traded the momentum of mon looking to form support during the week later . for more compound LONG
wed mid of range . cw
. no trade zone
thu
. waiting for run of aLow during ny
. compound LONG - 101485
. tp1 HIT
fri didnt catch enough upward momentum
. tp1 HIT
. last limit order for bullish continuation . tpo - 102862.5
wknd
. tp1 for weekly LONG idea finally hit
. duration 5d 22h
. +4.33%
conclusion :
trade what you see, go with momentum, but have a narrative.
outlook :
america downgraded from AAA to AA+ . People will turn hardcore bearish, once the price starts falling. this could be the trigger to find the long awaited drop - while having retail call out a bearmarket . massive potential here, to both sides. wOpen and monday full data (while keeping an close eye on tpo and footprint charts), are key .

SWDY Trend AnaylsisSWDY stock is in a downward trend. In case of falling, it's expected to break the first support line at 78.025 points, till it reaches the second support line at 76.249 points. In case of rising, it's expected to reach the first support line 78.687, the second support line 78.928, and the third support line at 79.019, which is highly anticipated due to its latest acquisition.

XAU/USD Pivot area with possibe Bullish move.Currently Gold is at a Pivotal area between 3153.46 and 3109.10 , this area holds a pivot turning point fot Gold next move , where we could head towards 3280 and 3407 for upward targets.
However failure to hold this area could send the price towards 2981.86 and 2855 for bearish Targets.

Hims is OVERBOUGHT Market Context ✨
NYSE:HIMS | Current Price: $42.00
1-Month Move: +17.5% (from $35.75)
1-Year Move: +68.2% (from $25.00)
Year High/Low: $43.50/$24.80
Technicals
RSI: ~75.8 (overbought )
Moving Averages: Above 20-day, 50-day, and 200-day MAs (strong uptrend, but overextended )
MACD: Bearish divergence forming (momentum fading, potential reversal )
Trade Setup
Direction: PUT
Entry Price: $42.00
Take Profit 1 (TP1): $36.00 (~14.3% gain )
Take Profit 2 (TP2): $30.00 (~28.6% gain )
Expected Move: ~12–15% downward
Best AI Signals on the market

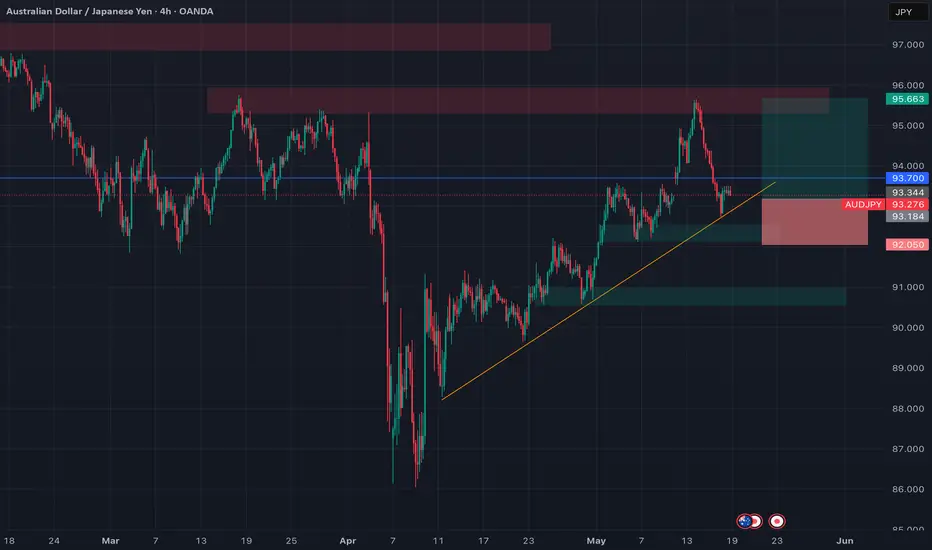
AUDJPY Long: Buy the Dip into Trendline + Seasonal AUD Surge🔹 Pair: AUD/JPY
🔹 Timeframe: 4H
🔹 Direction: Long
🔹 Status: Retesting Trendline Support
🔹 Entry Zone: 93.20–93.40 (Live Entry Area)
⸻
📊 Macro & Fundamental Confluence
🇦🇺 AUD – Bullish
• Strong Seasonality: Historically bullish May 19 – June 10.
• Conditional Score Rise: From 21 → 24 = Positive momentum shift.
• Dovish CB, But Risk-On: Supports carry trade flows into AUD.
• Macro View: Rebalancing inflation & trend recovery, AUD outperforming.
🇯🇵 JPY – Bearish
• BoJ Hawkish Talk, Dovish Action: Delayed inflation targets (to 2027).
• Score Flat: Minor rise (11 → 12), showing underperformance.
• Risk-On Mood: With VIX under 20, safe-haven demand fading.
• Macro Lag: JPY weakest G7 performer year-to-date.
🧠 Confluences Supporting the Trade
✅ Seasonal AUD strength
✅ Fundamental divergence: AUD strong, JPY weak
✅ Risk-on regime (favoring carry trades like AUDJPY)
✅ Trendline respected since April (bullish market structure)
✅ Support zone at 93.00–93.30 area
⸻
📈 Technical Setup
• Entry Zone: 93.20–93.40
• Stop Loss: 92.08 (below structure and ascending trendline)
• Take Profit:
• TP1: 95.40 (resistance zone)
• TP2: 96.00 (supply zone retest)
• Risk:Reward: ~1.8 – 2.2 depending on final entry
📌 Execution Notes
Watching for candle closure confirmation above 93.50.
Break below 92.08 invalidates the bullish bias.
This setup combines macro divergence, seasonal strength, and clean 4H market structure.
⸻
💬 Are you trading AUDJPY this week?
Drop your thoughts below ⬇️
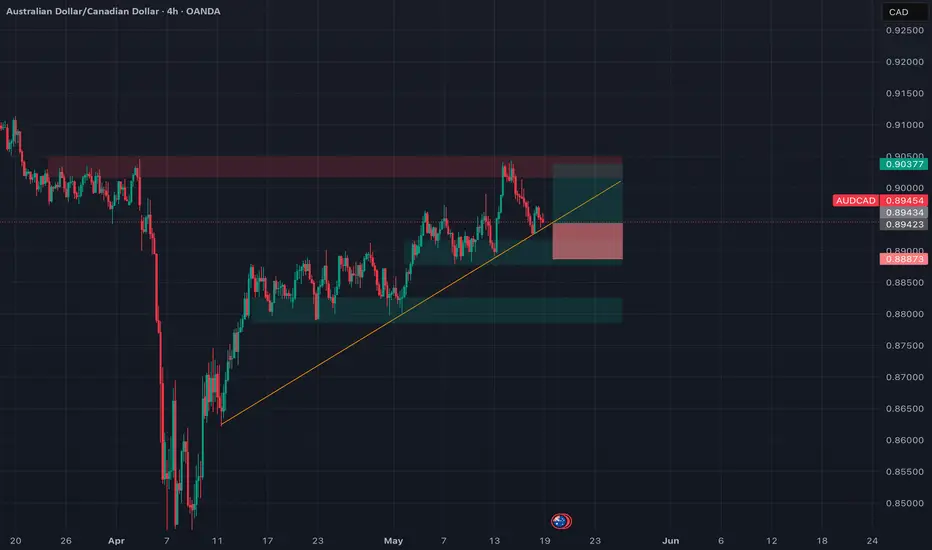
AUDCAD Long: Riding Aussie Strength vs Weak Loonie 🔹 Pair: AUD/CAD
🔹 Timeframe: 4H
🔹 Direction: Long
🔹 Strategy: Trend Continuation + Macro Confluence
🔹 Trade Active: 📍 0.8945 (CMP)
📊 Fundamental Bias
🇦🇺 AUD – Bullish
• Seasonal Surge: Historically strong from May 19 to June 10.
• Conditional Score Gain: AUD rose from 21 → 24 (momentum improving).
• Macro View: Inflation stabilizing, dovish stance offset by improving sentiment.
• VIX < 20: Risk-on conditions favor AUD.
🇨🇦 CAD – Bearish
• Flat Conditional Score: No improvement (2 → 2).
• Hawkish CB but Weak Data: CPI softening, trade risks persist.
• Global Sentiment: Oil stagnation + cautious BoC tone = headwinds for CAD.
⸻
🧠 Confluence Summary
✅ AUD macro + seasonal strength
✅ CAD remains fundamentally weak
✅ Risk-on supports commodity currencies
✅ 4H trendline support holding
⸻
🖼️ Technical Setup
• Entry: 0.8945
• Stop Loss: 0.8890 (below ascending trendline + support zone)
• Take Profit: 0.9036 (prior resistance + TP1)
• Risk:Reward: ~1.67
🟠 Optional Target: 0.9045 for extended move.
📌 Outlook
I’m bullish on AUDCAD for the week of May 19–23, supported by:
• Seasonal patterns
• Risk tone
• CAD stagnation
• Clear trend structure
Will look to trail SL as price closes above 0.8975. Clean invalidation below 0.8890.
⸻
💬 What’s your bias on AUD this week?
Drop a comment & let’s discuss 📉📈
$REZ Reversal in Motion – Eyes on the Next Wave UpAMEX:REZ reversed major resistance into support upon coming out of a downtrend.
We are currently looking for a pullback towards the 0.618 Fib level at 0.015 before the next wave up.
The market structure is still bullish, and the chart is priming for an explosive breakout into $0.023+.
Keep alert and observe that level.👀
DYOR, NFA

#SUI #SUIUSD #SUIUSDT #Analysis #Eddy#SUI #SUIUSD #SUIUSDT #Analysis #Eddy
As the chart shows, the coin has a choch & an intact, high-potential daily order block inside weekly order block that needs to be mitigation.
I have identified the important supply and demand zones of the higher timeframe for you.
This analysis is based on a combination of different styles, including the volume style with the ict style.
Based on your strategy and style, get the necessary confirmations for this analysis to enter the trade.
Don't forget about risk and capital management.
The responsibility for the transaction is yours and I have no responsibility for your failure to comply with your risk and capital management.
💬 Note: Important liquidity is marked on the chart. Be careful of liquidity hunting. In my opinion, the important entry point for buying spot and long futures is at 2.1693$, and it will most likely be a sniper entry. The first target from the specified point will be $5.5 and the second target will be $8.
Be successful and profitable.

#XRP #XRPUSD #XRPUSDT #Ripple #Analysis #Eddy#XRP #XRPUSD #XRPUSDT #Ripple #Analysis #Eddy
I have identified the important supply and demand zones of the higher timeframe for you.
This analysis is based on a combination of different styles, including the volume style with the ict style.
Based on your strategy and style, get the necessary confirmations for this analysis to enter the trade.
Don't forget about risk and capital management.
The responsibility for the transaction is yours and I have no responsibility for your failure to comply with your risk and capital management.
💬 Note: Important liquidity is marked on the chart. Be careful of liquidity hunting. In my opinion, the important entry point for buying spot and long futures is at 1.0987$, and it will most likely be a sniper entry. The first target from the specified point will be $4 and the second target will be $10.
Be successful and profitable.

Critical Reversal or Breakdown? | XAU/USD at Make-or-Break Zone📉 Chart Overview:
Instrument: XAU/USD (assumed from chart context)
Timeframe: 4H or Daily (based on candlestick size)
Indicators Used:
📏 EMA 50 (Red): 3,247.86
📏 EMA 200 (Blue): 3,221.42
🔍 RSI (14): Currently at 45.90 (below midline, showing weak momentum)
🔎 Key Zones:
🧱 Support Zone: ~3,180 – 3,220
Price is currently sitting on this key demand zone.
Price previously bounced here sharply ➡️ indicating buyer interest.
📦 Resistance Block: ~3,260 – 3,280
Short-term resistance, price has been repeatedly rejected from here.
🎯 Target Zone: ~3,420 – 3,460
If price breaks out from the support-resistance squeeze, this is the potential bullish target 🎯.
🧭 EMA Analysis:
EMA 50 is still above EMA 200 ➡️ Golden Cross formation (medium-term bullish bias) ✅
However, price is currently below both EMAs, signaling short-term weakness ❌
📉 Bearish Scenario (📍Blue Arrow Down):
If price breaks below the support zone at ~3,180, we could see a sharp drop toward the next support at ~3,032 🔻.
RSI is trending down near 40, close to oversold territory ⚠️
🚀 Bullish Scenario (📈 Blue Arrow Up):
A successful retest and bounce from this support area (currently forming a rounded bottom 🥄) could lead to a bullish move toward the target zone.
This is further supported by the potential RSI bounce from the 40 area, signaling renewed momentum 🔋.
✅ Bias & Conclusion:
Neutral-to-Bullish Bias 🤝: As long as the price holds above the major support zone (~3,180), buyers have a chance to reclaim higher levels.
Look for confirmation breakout above the local resistance (~3,260) for a move toward 3,400+ 🚀.
A breakdown below support would invalidate the bullish thesis and target 3,030 instead 📉.
🛠️ Trading Plan (not financial advice!):
Long Entry: On bullish breakout & retest of ~3,260 ✅
Stop-Loss: Below ~3,180 ⚠️
Target: ~3,420 – 3,460 🎯

Monitoring USDT- Absolutely not a prediction.
- Just doing this chart to observe 1D (smaller timeframe) on USDT Dominance & Sharing.
- I usually like to use larger TF to reduce the noise on charts ( 1W, 2W, 1M, 3M ).
- USDT.D have to break out 8.4% before 13th December.
- if it does, could mean BTC more downward pressure.
- if it fails, BTC could rally up.
- Patience is the key.
Happy Tr4Ding !

HelenP. I Euro may reach resistance level and break itHi folks today I'm prepared for you Euro analytics. Observing this chart, we can see how the price appears to be finding stability just above the trend line support. This zone also aligns closely with the local swing low formed after the rejection from the resistance area near 1.1270. Buyers managed to defend this key trend structure, forming a potential higher low setup within the broader bullish framework. The price is now trading below a significant resistance cluster, where both horizontal and supply pressure meet, the 1.1270 to 1.1315 zone. However, the fact that EUR is respecting the rising trend line and hasn't broken below the previous local low suggests that bullish momentum may still be intact. A corrective dip into the trend line could offer the final shakeout before a new leg upward begins. If price manages to build strength around this support and push back toward the resistance zone, a breakout becomes increasingly likely. In such a case, the market may extend toward the 1.1400 area, which I consider my current target. Given the sustained higher lows, trend support, and structure of accumulation forming below resistance, I expect EURUSD to continue pushing upward after this retest phase. If you like my analytics you may support me with your like/comment ❤️
Disclaimer: As part of ThinkMarkets’ Influencer Program, I am sponsored to share and publish their charts in my analysis.

USD/JPY(20250516)Today's AnalysisMarket news:
Fed Chairman Powell: The Fed is adjusting its overall policy-making framework. Zero interest rate is no longer a basic situation. The wording of underemployment and average inflation rate needs to be reconsidered. PCE is expected to drop to 2.2% in April.
Technical analysis:
Today's buying and selling boundaries:
145.93
Support and resistance levels:
147.26
146.77
146.44
145.42
145.10
144.61
Trading strategy:
If the price breaks through 145.93, consider buying, the first target price is 146.44
If the price breaks through 145.42, consider selling, the first target price is 145.10

Will the Market Continue to Sink or Rebound?Gold Price Volatility: Will the Market Continue to Sink or Rebound?
💥 Market Outlook:
Today’s market is seeing unpredictable movements, with gold making significant drops and then rebounding sharply in the last two days. Are the recent news developments aligning with the price action, or is it just a major coincidence?
🔍 Technical Analysis:
Looking at the D1 and H4 charts, you can clearly see the breakdown, but gold quickly bounced back to the 325x area and reacted. The 3254–3256 zone is a key level that holds strong for sellers on both daily and H4 candles. If gold continues to hold below this level, the bearish trend remains strong, and another sharp drop could happen before the weekend.
If the 3254–3256 level is broken, the price may push toward the 327x, possibly even the 328x levels. However, this will be dependent on whether this critical support is maintained.
Trend Continuation or Reversal?
From a technical perspective, gold is still in a downtrend, and the current bounce is likely just a retracement before continuing lower. However, in terms of macro news, the USD is continuously dealing with bad inflation data, affecting the recovery of DXY (USD). The market is very sensitive to trap candles, and there may be false breakouts, so proceed cautiously.
There are also some news reports indicating that the US and China have reached a minor détente, but tensions remain around trade restrictions, imports, exports, and the use of rare earth minerals. Things are unpredictable with these two powers. Today, there are updates on tariffs, so keep an eye out!
📊 Key Resistance Levels:
3237
3251
3261
3276
3287
📉 Key Support Levels:
3205
3188
3170
3143
🎯 Trading Plan:
🔵 BUY SCALP:
Entry: 3172 – 3170
SL: 3166
TP: 3176 → 3180 → 3184 → 3188 → 3192 → 3196 → 3200
🔵 BUY ZONE:
Entry: 3142 – 3140
SL: 3136
TP: 3146 → 3150 → 3154 → 3158 → 3162 → 3170 → 3180 → 3190
🔴 SELL SCALP:
Entry: 3160 – 3162
SL: 3166
TP: 3156 → 3152 → 3148 → 3144 → 3140 → 3130 → 3120
🔴 SELL ZONE:
Entry: 3276 – 3278
SL: 3282
TP: 3272 → 3268 → 3264 → 3260 → 3255 → 3250 → 3240
⚠️ Risk Management:
With strong volatility today, manage your risk carefully. It’s essential to adhere to your TP/SL to protect your account. Stay cautious, as there is a lot of unpredictability in the market with the upcoming news.
Conclusion:
Given the unpredictability of the market and geopolitical tensions, it’s wise to trade with caution today. Watch the critical support and resistance levels closely and stay flexible, adapting your strategy based on how the market evolves.
📣 Stay tuned for more updates and trade smart!

SRx Health (SRXH): Financial Analysis and Merger with BTTRPre-Merger Financial Overview (Better Choice Company)
Better Choice Company Inc. – renamed SRx Health Solutions Inc. prior to the merger – focused on pet nutrition and wellness products (Halo brand). In 2024, the company reported net revenues of $34.97 million, down from $38.59 million in 2023. Despite the decline in revenue (-9%), gross profitability improved: gross margin rose to 37% in 2024, with gross profit of ~$12.99 million (compared to 30% in 2023, gross profit ~$11.80 million). The drastic reduction in operating costs ($18.96 million in 2024 vs. $32.98 million in 2023) has significantly reduced operating losses. In fact, the net loss for the 2024 financial year was almost eliminated at $0.17 million (compared to a heavy loss of $22.77 million in 2023).
This reversal is partly due to extraordinary items: in 2024, Better Choice recorded a gain of $6.2 million from the extinguishment of debts and liabilities, in addition to avoiding goodwill impairment charges that had weighed on the balance sheet by ~$8.5 million in 2023.
On an adjusted basis, 2024 adjusted EBITDA remained negative at approximately $1.9 million, but was a significant improvement (≈78% lower) compared to the EBITDA loss of approximately $8.6 million in the previous year. Earnings per share (EPS) also decreased from $(32.29)$ to $(0.10)$ due to lower liabilities and an increase in the average number of shares (from ~705,000 to ~1.615 million after reverse stock splits and new issuances). As of December 31, 2024, the company had $3.1 million in cash and had used approximately $2.4 million of its revolving credit facility (limited remaining capacity). Working capital was positive (~$7.9 million at the end of 2024, according to management) thanks to the reduction in short-term debt during the year.
Overall, Better Choice showed signs of a turnaround in 2024: declining revenue but an improved channel mix (closure of the unprofitable direct-to-consumer channel), growing gross margins, and costs under control, with four consecutive quarters of gross margin improvement and three consecutive quarters of reduced losses.
SRx Health Solutions (Canada) Pre-Merger Data
SRx Health Solutions Inc. – the company acquired by Better Choice – is an integrated specialty healthcare services provider in Canada with a different but complementary business model. Prior to the merger, SRx operated one of Canada's largest specialty pharmacy networks, with 35 active pharmacies, 40 specialty infusion clinics, 4 clinical trial centers, and 2 pharmaceutical distribution centers. This platform enabled it to generate annual revenues of C$161.5 million in 2023, with adjusted EBITDA of C$11.4 million (IFRS). These volumes correspond to approximately $120 million in revenue and ~$8.5 million in EBITDA on a pro forma basis in US dollars, indicating operating profitability of around 7% on revenue. Better Choice management highlighted that SRx has shown consistent revenue and cash flow growth in recent years, building its network from 2013 to the present. According to the announcement, SRx has achieved steady growth and positive margins by focusing on high-value segments (specialty drugs and therapies) under the leadership of founder and CEO Adesh Vora, a pharmacist with 24 years of experience in the healthcare industry. It should be noted that SRx's financial statements were prepared in accordance with IFRS and are being converted to US GAAP post-merger; accounting differences may arise, but the pro-forma figures provided give an order of magnitude of SRx's pre-acquisition operations. In summary, prior to the merger, SRx Health was a larger business than Better Choice in terms of revenue (approximately four times larger) and had positive margins, operating in a market—the Canadian specialty pharma market—estimated to be growing strongly (∼11% CAGR through 2030). This context motivated the merger of the two companies, combining SRx's solid recurring revenue base with Better Choice's pet activities.
Better Choice – SRx Health Merger: Strategic Motivations and Synergies
The merger between Better Choice and SRx Health Solutions, announced in September 2024 and completed in April 2025, was presented as a transformative strategic operation. The stated goal is to create a leading global health and wellness company across multiple sectors, offering products and solutions for pets, people, and families in a single integrated group. In practice, the new SRx Health Solutions Inc. combines the pet health & nutrition sector (pet food and wellness products, Halo brand) with the specialty healthcare sector for human patients (specialty pharmacies, clinics, and advanced healthcare services). This diversification aims to capitalize on converging trends: on the one hand, the growing “humanization” of pets and consumer focus on pet health (Better Choice's core business), and on the other, the increasing demand for specialty therapies, highly complex drugs, and personalized healthcare services in Canada (SRx's core business). Michael Young, Chairman of Better Choice, described the transaction as “a transformative opportunity that positions Better Choice as a global leader in the health and wellness industry.” He praised the SRx team's work in building their healthcare network and highlighted that, once combined, there are immediate operational and growth synergies estimated at over $1.7 million that the group expects to realize quickly. These synergies are expected to come from the integration of infrastructure and distribution networks, as well as the implementation of cross-growth strategies between the two entities. For example, SRx could support the distribution of Halo products in new markets (Canada and pharmaceutical channels) and, conversely, Better Choice could introduce SRx services/solutions in the US market or online, leveraging its digital presence. In addition, the merger strengthens the capital structure: Better Choice, which was a micro-cap with limited resources, gains a larger, more capitalized business, while SRx gains access to the US capital market through its NYSE American listing (without going through a traditional IPO). From an organizational standpoint, SRx founder Adesh A. Vora will assume the role of CEO of the new SRx Health Solutions Inc., bringing his extensive experience in the pharmacy sector, while former Better Choice CEO Kent Cunningham will lead the Halo (pet) business unit within the group. The combined board of directors includes five members from both companies to balance expertise (Vora is also appointed Chairman). In summary, the strategic rationale for the merger lies in the creation of a 360° wellness player with complementary assets and cross-selling opportunities, capable of competing in both the premium pet and specialized healthcare markets. The transaction was approved by a large majority of Better Choice shareholders in March 2025 (over 71% of voting shares, with authorization to issue ~30 million new shares for the acquisition), a sign of confidence in the prospects outlined by management. Synergies and prospects: According to official statements, the new combined group has a significantly strengthened financial profile. On a pro-forma basis, in the first six months of 2024, the two companies would have totaled ~$95 million in combined revenues. Projections for 2025 indicate combined revenues of over $270 million and EBITDA of over $10 million, a significant jump from Better Choice's historical standalone figures. If achieved, these targets would imply significant growth driven by the contribution of SRx (which alone would account for the majority of revenues) and the launch of joint initiatives. The prospective EBITDA margin would still be around 4% of revenues, indicating that management is primarily focused on expanding business volume while maintaining modest margins, likely due to growing investments and integration. Initial cost synergies ($1.7 million) could slightly improve profitability in the short term, while further growth synergies (e.g., pet/pharma cross-selling, geographic expansion) could impact sales and margins in the medium term. On the operational side, SRx brings expertise in the regulated healthcare sector, relationships with public authorities (e.g., healthcare reimbursements in Canada), and a technology and logistics-distribution platform for specialty drugs. Better Choice contributes an established consumer brand in holistic pet food and developed international e-commerce and retail channels (Amazon, Chewy, distribution in Asia, etc., as evidenced by APAC growth of +9% in 2024). SRx Health Solutions' new stated mission is to “become the most innovative wellness company” by investing in product innovation and digital initiatives to simplify access to care (as per the May 2025 investor presentation). The merger also involves a corporate name change: as of April 30, 2025, Better Choice officially assumed the name SRx Health Solutions Inc. and its stock ticker changed from “BTTR” to “SRXH,” reflecting its new multi-sector focus. In parallel, the company has taken steps to strengthen its financial structure: concurrently with the closing, a $8.8 million private placement was completed with an institutional investor at a price of $2.18 per share (above the last previous market price). This investment provided immediate liquidity of approximately $8 million (before expenses) and signals of confidence from new shareholders. In addition, SRx Health (the Canadian part) had improved its financial standing by previously converting $4 million of debt into equity (a transaction announced in early 2024) in order to enter the merger with strengthened working capital. Overall, therefore, the transaction was motivated by industrial logic of diversification and scale, supported by financial considerations (capital strengthening and access to capital) and well received at the shareholders' meeting. The effective integration of the businesses and the realization of the promised synergies now remain to be accomplished, in a market environment that presents growth opportunities (expanding pet and specialty pharma sectors) but also significant competitive challenges.
Competitive Comparison and Industry Benchmark
From an industry perspective, SRx Health Solutions Inc. is an atypical entity in that it operates in both the Healthcare sector (pharmacies, clinics, healthcare services) and the Consumer Pet Care sector. Officially, the company is classified in the healthcare sector (under “Drug Manufacturers/General,” although distribution and services are its main activities). It is therefore useful to assess SRXH's position in relation to two competitive areas: competitors in the human health market (specialty pharma/health services) and players in the pet food/wellness market. Specialty pharmacy/healthcare services sector: In Canada, the specialty pharmacy market is fragmented but has large players such as the specialty divisions of Shoppers Drug Mart (Loblaw) and the McKesson Canada network, as well as independent operators. With ~$120 million in revenues (pro-forma 2023), SRx is a small-to-medium-sized operator compared to national leaders, but is one of the few with a widespread presence in all 10 Canadian provinces. Its focus on highly complex drugs and infusions places it in a niche with relatively high barriers to entry (given the need for clinical expertise, special licenses, and cold chain logistics management for biological drugs, etc.). The Canadian specialty drug market is rapidly expanding (valued at ~$7.4 billion US$ in 2024, expected to reach ~$13.9 billion by 2030), which provides SRx with a favorable tailwind for organic growth. In terms of profitability, more mature players in the healthcare sector often report double-digit EBITDA margins; SRxH forecasts an EBITDA margin of ~3-4% for 2025, indicating that there is room for improvement as operations are integrated and economies of scale are realized. Compared to healthcare industry financial benchmarks, SRx currently has low net margins (historically, Better Choice was loss-making and SRx Canada presumably had modest net profits) and low capitalization, factors that could be weaknesses when compared to giants such as CVS Health, Walgreens, or even Canadian chains backed by large groups, which enjoy ample financial resources and lower capital costs. On the other hand, SRx may have the flexibility of a more agile player dedicated exclusively to the specialist segment, without the legacy of generalist retail networks; its vertical integration (clinics + pharmacy + clinical trials) is a distinctive feature compared to many competitors focused solely on drug distribution. Pet food & wellness sector: SRxH's Halo business unit operates in the premium pet food market, competing with established brands such as Blue Buffalo (General Mills), Royal Canin (Mars), Hill's (Colgate-Palmolive) and other natural/holistic brands. This is a highly competitive but growing market, driven by premiumization and higher per capita spending on pets. With ~$35 million in annual revenue, Halo is small compared to global leaders (just think that the pet care divisions of giants such as Nestlé and Mars have revenues in the tens of billions). Even compared to focused rivals such as Petco Health & Wellness (WOOF) – a US chain that has integrated retail and veterinary services – Halo is small (Petco has annual revenues of ≈$4 billion). However, Halo has built a loyal niche in the holistic/vegan segment and benefits from a strong presence in e-commerce (Amazon, Chewy), where it has recorded significant growth (+32% on Chewy/Amazon in Q4 2024). The competitive challenge in pet food is mainly distribution (shelf space in pet and grocery chains) and marketing to differentiate the brand – areas where the injection of capital and greater visibility as part of SRxH could help. A potential competitive advantage for SRxH is its integrated “family-pet” offering: few operators can address the well-being of people and their animals at the same time. This innovative approach could attract a segment of consumers who are sensitive to holistic solutions for the whole family (e.g., health programs involving both human and animal patients). However, it is equally true that unified brand communication will need to avoid confusion: SRx Health will need to clearly explain its multi-business identity so as not to dilute the Halo brand equity in pet shops or SRx's credibility with clinicians and patients.
Relative Strengths and Weaknesses.
Below I summarize the main competitive strengths and weaknesses of SRx Health Solutions Inc. in the sector context:
Strengths
Complementary Diversification: Integrated business on two growing fronts – specialty healthcare and pet wellness – with cross-selling opportunities and mitigation of sector risks.
Position in Expanding Markets: Presence in the Canadian specialty pharma market (CAGR ~11%) and premium pet care (global growth trend thanks to pet humanization).
Extensive Operating Network: SRx's infrastructure of 35 pharmacies and 40 clinics across Canada – difficult for competitors to replicate quickly – combined with an international digital and distribution platform for pets.
Improved Operating Performance: Better Choice's recent track record of improving margins and reducing losses, indicating the effectiveness of restructuring initiatives; SRx already profitable at the operating level (positive EBITDA) prior to the merger.
Management and Expertise: Management team enriched by Adesh Vora's 20 years of experience in the pharmacy sector and Better Choice's expertise in pet digital marketing; renewed governance with representatives from both sides of the business.
Refinanced Financial Structure: Reduction of Better Choice's legacy debt (extinction of $6.2 million in debt in 2024) and new capital raised ($8.8 million) providing liquidity for investment and growth, improving the financial profile in the short term.
Weaknesses:
Small Size vs. Big Players: Pro-forma revenue of ~$120 million represents a marginal share in the target markets (<<1%); smaller scale means less bargaining power with suppliers and lower economies of scale compared to giants such as CVS, Nestlé Purina, Mars, etc.
Low Profitability and History of Losses: Expected EBITDA margin of ~4%, well below the industry average; net margin has been negative or slim to date. The new group's profitability is yet to be established and integration could initially generate costs.
High Dilution and Low Capitalization: The transaction diluted the original shareholders (85% of the new company belongs to SRx shareholders) and the free float remains limited. With a market cap of only ~$15–20M, SRXH risks low visibility among institutional investors, high volatility, and difficulty raising additional capital in the stock market.
Complexity of Integration: Merging a US pet retail/CPG company with a Canadian healthcare services company poses operational, cultural, and regulatory challenges. Synergies are not guaranteed if the two divisions remain too distinct; IT integration, logistics, and coordination of very different teams will be necessary.
Focus and Brand Clarity: Risk of strategic dispersion: covering both the veterinary/pet and human healthcare sectors simultaneously could make it difficult to communicate a clear identity. Rebranding could confuse customers (e.g., veterinarians vs. doctors vs. pet consumers) if not managed carefully.
Regulatory and Local Market Risks: The healthcare business is concentrated in Canada, subject to stringent regulation and dependent on public reimbursements; any policy changes could impact SRx. The pet segment operates in a highly competitive consumer market that is sensitive to pet owner preferences (where very large brands invest heavily in marketing). Any contraction in discretionary spending (e.g., recession) could affect premium pet sales.
Conclusions : SRx Health Solutions (SRXH) emerges from the merger as a renewed and multifaceted company with financial indicators that differ significantly from Better Choice's past. Pre-merger financial data highlights Better Choice's turnaround in 2024 (drastic reduction in losses, improved adjusted EBITDA) and SRx's strength in Canada (stable and positive revenues, extensive infrastructure). Following the merger, the group has high growth potential (expected 2025 revenue three times higher than the sum of the previous companies, new business lines) but will need to demonstrate to the market that it can successfully integrate operations to translate that revenue into tangible profits. The current market valuation reflects the risks and dilution, as shown by SRXH's share price below the $1 threshold. The next few quarters will be crucial: the publication of the post-merger consolidated results and the execution of synergies will clarify whether SRx Health can realize the vision of a “global wellness company” outlined by management. Investors will be watching the company's ability to maintain its growth trajectory in both segments and improve margins as it moves toward net profitability. A clear communication plan and strategic focus will also be crucial to leverage the company's distinctive strengths without diluting their value. Ultimately, SRx Health (SRXH) represents a unique case of cross-pollination between the pet and healthcare sectors, with financial metrics to be rebuilt post-merger but with interesting market opportunities if it can consolidate its position and convince stakeholders of the sustainability of its new business model.
Sources : Official SEC documents (10-K 2024 and 10-Q1 2025) and company press releases; d1io3yog0oux5.cloudfront.net; IR presentations and GlobeNewswire; globenewswire. com; d1io3yog0oux5.cloudfront.net; industry market data and financial websites (Yahoo Finance, Nasdaq, FMP) for quotes and comparisons; stockanalysis.com; nasdaq.com; databridgemarketresearch.com.

After $105K Peak, Bitcoin May Revisit 0.382 FOB Level!CRYPTOCAP:BTC is pulling back after hitting a high of $105,800
If you look at the daily chart, we haven’t seen any healthy pullback, the price has gone straight up.
In my opinion, a retest of the 0.382 FOB level around $94K would be a healthy correction for Bitcoin. Based on the liquidation heatmap, we’re also seeing liquidity building up at lower levels.
This is one of the signs of a pullback, which is important for a sustainable and healthy market.
Stay tuned and follow for more updates!

btc . may . w3 . friyesterdays LONG was beautiful. ny ran aLow, and never looked back pushing higher.
. new aver entry . 102353
i'm right now scalling into new limit LONGs
. aLow . wVWAP . cw0.5 . liquidity grad - in this BULLISH environment
a last limit order is placed at pdTPO
. 102862.5
SL has been lifted to give new trade breathing room
i see us go to cwHigh . 105871, to which tp1 has been changed.
cheers

Fundamental Market Analysis for May 16, 2025 GBPUSDU.S. producer prices unexpectedly fell in April as the cost of services fell the most since 2009. The Bureau of Labour Statistics on Thursday released data that the
US Producer Price Index (PPI) rose 2.4 per cent in April, down from 2.7 per cent previously. This figure was weaker than market expectations of 2.5%. In addition, initial jobless claims in the US for the week ending 10 May were 229 thousand, compared to the previous week's 229 thousand (revised from 228 thousand). This value was in line with initial estimates.
Swap markets priced in the first Fed rate cut of 25 basis points (bps) at the September meeting and expect two more rate cuts before the end of the year. Some analysts believe policymakers may wait until December.
Favourable UK Gross Domestic Product (GDP) data suggests the UK's economic health is robust, dampening hopes of aggressive monetary policy easing by the Bank of England (BoE). This, in turn, provides some support for the British pound against the US dollar.
Trading recommendation: BUY 1.3350, SL 1.3250, TP 1.3550

GOLD 1H Chart Analysis – Market Structure Shift & Liquidity ZoneThis 1-hour chart for XAU/USD (Gold Spot vs. U.S. Dollar) from TradingView displays a detailed technical analysis highlighting key market structure events such as Break of Structure (BOS), Change of Character (CHoCH), and liquidity zones. A descending trendline indicates bearish pressure, while recent CHoCH suggests a possible bullish reversal. Key supply and demand zones are marked in red, with liquidity grabs and imbalances visualized using shaded areas. Price currently hovers around the 3,211 level, approaching a resistance zone after reclaiming bullish momentum. Traders may look for reactions near the supply zone or a break above trendline resistance for confirmation.

EUR/USD - Triangle Formation (16.05.2025)The EUR/USD pair on the M30 timeframe presents a Potential Buying Opportunity due to a recent Formation of a Triangle Pattern. This suggests a shift in momentum towards the upside and a higher likelihood of further advances in the coming hours.
Possible Long Trade:
Entry: Consider Entering A Long Position around Trendline Of The Pattern.
Target Levels:
1st Resistance – 1.1321
2nd Resistance – 1.1376
🎁 Please hit the like button and
🎁 Leave a comment to support for My Post !
Your likes and comments are incredibly motivating and will encourage me to share more analysis with you.
Best Regards, KABHI_TA_TRADING
Thank you.
