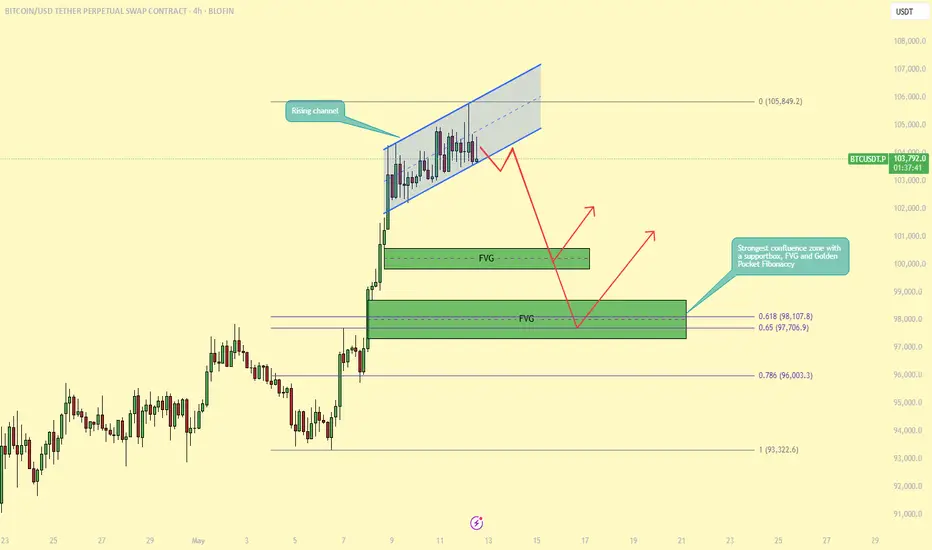
BTC Approaches All-Time High — But Signs of Weakness Emerge!BTC is once again approaching its all-time high (ATH) on the daily timeframe, generating excitement across the market. However, a closer look at the lower timeframes reveals signs of potential exhaustion as BTC encounters strong resistance. This suggests a pullback could occur before any continuation higher.
On the 4-hour and 1-hour charts, BTC is currently trading within a rising channel, which is often considered a bearish continuation pattern, especially when it forms directly below a key resistance level like the ATH. Price action within this structure is starting to lose momentum, and the presence of bearish divergences and decreasing volume further supports the likelihood of a near-term correction.
Where Could We Buy the Dip?
A pullback may offer a strategic entry opportunity for traders looking to ride the next leg up. Notably, two fair value gaps (FVGs) were created during the recent upward move. The first FVG could provide a minor bounce, but the second one is more compelling for a higher-probability long setup.
This second FVG aligns with a well-established support zone and coincides with the Golden Pocket of the Fibonacci retracement (between the 0.618 and 0.65 levels). This confluence of technical factors makes it a strong area of interest for bulls, and a potential springboard for price to retest, and possibly break, the ATH.
In summary, while BTC is showing strength on the higher timeframes, lower timeframe patterns suggest that a healthy correction is likely. Patience and proper level selection will be key. Watching how price reacts around the second FVG and the Golden Pocket zone may present one of the best opportunities for re-entry.
-------------------------------
Thanks for your support.
- Make sure to follow me so you don't miss out on the next analysis!
- Drop a like and leave a comment!
Analysis
GBPUSD - SHORTI'm currently holding a bearish bias on GBP/JPY, anticipating a short-term correction after recent overbought conditions. Price action shows signs of exhaustion, and I'm expecting a move downward to fill the Fair Value Gaps (FVG) left behind during the previous bullish impulse.
Trade Rationale:
Overbought Conditions: After a strong upside move, price has reached a zone where buyers are losing momentum, hinting at a potential reversal or pullback.
Imbalance/FVG Zones: Clear inefficiencies exist below current price levels, and I expect the market to retrace to fill these imbalances as part of its natural rebalancing.
Structure & Supply: The market is showing reaction near a significant supply zone, which could act as the catalyst for bearish continuation.
Target Zones:
TP1: First demand zone where minor support may form — partials can be taken here.
TP2: Deeper demand zone aligned with previous consolidation — a high-probability area for price to react and potentially reverse or consolidate again.
Risk Management:
Stops are placed just above recent highs, invalidating the idea if the market breaks structure and continues bullish. The setup offers a favorable risk-to-reward ratio aligned with smart money concepts like imbalance fills and demand/supply reactions.
📉 Plan: Waiting for clear bearish confirmation (e.g., lower timeframe break of structure) before fully committing to the short position.

XAUUSD Price Outlook – Bearish Setup in Play ??Asset Overview
The chart represents a price action analysis with support and resistance zones, along with EMA indicators (50 and 200), likely on a 4H or 1H timeframe.
Key Technical Levels
Resistance Zone: ~3,400 to 3,450
First Support Zone: ~3,230 to 3,250
Second Support Zone: ~3,090 to 3,130
Indicators
EMA 50 (Red): Currently around 3,340, acting as dynamic resistance.
EMA 200 (Blue): Positioned near 3,232, reinforcing the first support zone.
Price Action Insight
Price had a strong uptrend, peaking above 3,440 before pulling back.
A lower high may be forming, suggesting possible trend exhaustion.
The current bounce appears to be a retracement back toward resistance or EMA 50.
Projected Move (As Illustrated on Chart)
Short-term bullish move into the resistance zone (~3,400–3,450).
Failure to break above resistance leads to sharp rejection.
Price retraces to first support zone (aligned with EMA 200).
If support fails, deeper drop expected toward the lower support zone (~3,100).
Strategic Notes
📉 Bearish Bias if price fails to break above resistance.
🔍 Watch for bearish candlestick patterns or divergences near resistance.
🛡️ First support aligns with EMA 200, making it a critical level for bulls to defend.
🔻 Breakdown below 3,230 opens room for larger correction to 3,100–3,090.
Conclusion
Currently, the chart suggests a potential short opportunity if price confirms rejection at resistance. The EMA cross structure remains bullish long-term, but momentum is weakening, and failure to reclaim highs could shift sentiment bearish in the short to mid-term.

NASDAQ Bullish Breakout Above Channel;📈 Technical Analysis Overview
1. Breakout from Downtrend Channel
The price has clearly broken out of a descending channel, confirmed by a clean breakout above the upper trendline.
This is a bullish signal, indicating the end of the prior downtrend and the start of a possible uptrend or reversal.
2. Moving Averages (EMA 50 & EMA 200)
EMA 50 (Red): 18,965
EMA 200 (Blue): 19,409
Price is currently trading above both EMAs, which is another strong bullish indicator.
A bullish crossover (where EMA 50 crosses above EMA 200) is likely imminent if upward momentum continues—this would form a Golden Cross, further confirming bullish sentiment.
3. Structure and Market Behavior
After the breakout, price retested the breakout zone and showed a bounce, forming a higher low, which is characteristic of a bullish structure.
The chart includes projected price action with higher highs and higher lows—suggesting a bullish continuation pattern.
4. Volume & Momentum (Not shown but implied)
Breakouts are typically validated by volume. Although volume is not shown, the sharp upward movement and breakout above resistance suggest strong buying pressure.
🔍 Key Levels to Watch
Resistance: 20,000 psychological level; above that, 20,500–21,000 may act as resistance.
Support: 19,400 (near EMA 200), and 18,965 (EMA 50); a break below may invalidate the bullish setup.
📊 Conclusion
The chart shows a clear breakout from a descending channel, supported by the price moving above both key EMAs. The structure favors bullish continuation, especially if price holds above the 19,400–19,500 support zone. Upside targets lie around 20,500 to 21,000.

US30 Approaching Key Resistance Within Rising Channel:🧠 Chart Context & Overview
Chart Type: Candlestick
Time Frame: Appears to be Daily (based on price action and spacing of dates)
Current Price: ~$40,798.4
Indicators:
EMA 50 (Red): ~40,065.2
EMA 200 (Blue): ~41,475.6
Trend Structure: Ascending channel with higher highs and higher lows forming since early April.
🔍 Technical Breakdown
📈 Trend Analysis
The price is moving within a rising parallel channel, respecting both upper and lower boundaries.
The recent bullish candles indicate momentum building towards a breakout or test of resistance.
🔄 EMA Confluence
Price is above the 50 EMA, showing short-term bullish momentum.
EMA 200 is acting as overhead resistance (~41,475), aligned with the top of the channel—a key decision zone.
📊 Support & Resistance Levels
Immediate Resistance: ~41,475 (EMA 200 & upper channel boundary).
Support Levels:
~40,065 (EMA 50)
~39,000 (mid-channel support zone)
~38,000 (lower channel boundary)
📌 Scenarios to Watch
✅ Bullish Case:
A clean breakout above the channel and the 200 EMA (~41,475) with strong volume could trigger a trend continuation toward:
42,500 – next psychological and historical resistance
Potentially higher if macro sentiment aligns
⚠️ Bearish Case:
Rejection at 200 EMA or the upper channel could lead to:
A pullback to the mid-channel zone (~39,800–40,000)
Further downside to retest the lower channel support (~38,000)
📅 Outlook
The chart currently supports a bullish bias within an uptrend structure, but the key resistance zone (41,475) must be broken decisively for confirmation. Watch for volume and candle structure near that level to assess breakout validity.

$ENA Finally Breaks Out – Retesting Before Next Leg Up!!MIL:ENA eventually broke through the adamant trendline resistance.
following repeated rejectionsPrice is now backing off slightly, testing the Fib area and breakout formation.
Holding at this level positions it to make a clean run to $0.48–$0.50+This chart is on the rise again ????
Follow for more updates
DYOR, NFA

USD/CHF Reversal Setup (Read-Caption)🧠 Professional Technical Analysis – USD/CHF 💱
🗓️ Date: May 6, 2025
🕰️ Timeframe: Likely 4H or Daily
📊 Current Price: ~0.82218
🔍 Technical Indicators
🔵 EMA 20: 0.84190 (short-term trend)
🔴 EMA 50: 0.82524 (mid-term trend)
❗ Bearish crossover: EMA 20 is below EMA 50 → short-term bearish bias 🐻
📉 Support Zone Analysis 🛡️
🟥 Key Demand Zone (Support): 0.82084 – 0.81437
🔁 Price has bounced here before 🪃
🕯️ Candles with long lower wicks = buyers stepping in 🧍♂️💪
🟠 This is the “bounce zone” 📈
🧭 Trade Idea
✅ Long Entry: Around 0.82084–0.82200
🛑 Stop Loss: Below 0.81437 ❌
🎯 Take Profit: Around 0.83600 🟢
⚖️ Risk/Reward: Excellent (>2:1) if bounce holds 🚀
🔄 Price Action Outlook
📉 Downtrend approaching major support
🕯️ Looking for bullish candlestick confirmation (engulfing, hammer, etc.)
📈 Target area aligns with mean reversion to EMA 20
📌 Conclusion
👀 Watching for bullish reversal signs 🔄
🛒 Buy zone is clearly defined ✅
⛔ Setup is invalidated if price closes below 0.81437

EURNZD Bearish Reversal Confirmed: Break and Retest Below Key Su🧠 Market Context & Structure:
Trend Analysis: The pair is currently in a bearish structure. This is evident from lower highs and lower lows forming after a failed bullish breakout attempt.
Key Zone: A supply zone (highlighted in red) around 1.90198 – 1.90750 has acted as a strong resistance. Price was rejected here after retesting.
Break of Structure (BoS): A clear bearish breakout below the ascending trendline and the horizontal support confirms a shift in sentiment.
📉 Indicators & Confluences:
EMA Analysis:
EMA 50 (red): 1.90757
EMA 200 (blue): 1.90728
Price is trading below both EMAs, which confirms bearish momentum. Also, a bearish EMA crossover (50 crossing below 200) may be forming or has just occurred — a death cross, which further supports downside bias.
🎯 Trade Setup Breakdown (Bearish Bias):
Entry: Around 1.89760 (current price)
Stop Loss: Above the supply zone (~1.9020 - 1.9070)
Take Profit Target: Around 1.86035 (highlighted in green), aligning with previous demand zone or measured move.
Risk-to-Reward Ratio (RRR): Estimated at ~3:1, making this a favorable setup.
🔽 Technical Patterns:
Bear Flag / Rising Wedge: The broken ascending pattern suggests a bearish continuation.
Retest Confirmation: Price retested the broken structure before continuing down — classic bearish retest behavior.
✅ Conclusion:
This is a textbook bearish setup supported by:
A failed breakout and structure shift
Resistance at a key supply zone
Break and retest of support
Price under both EMAs (bearish confirmation)
📌 Bias: Bearish
📌 Invalidation Level: Close above 1.9075
📌 Next Support Zone: 1.8600–1.8550 range

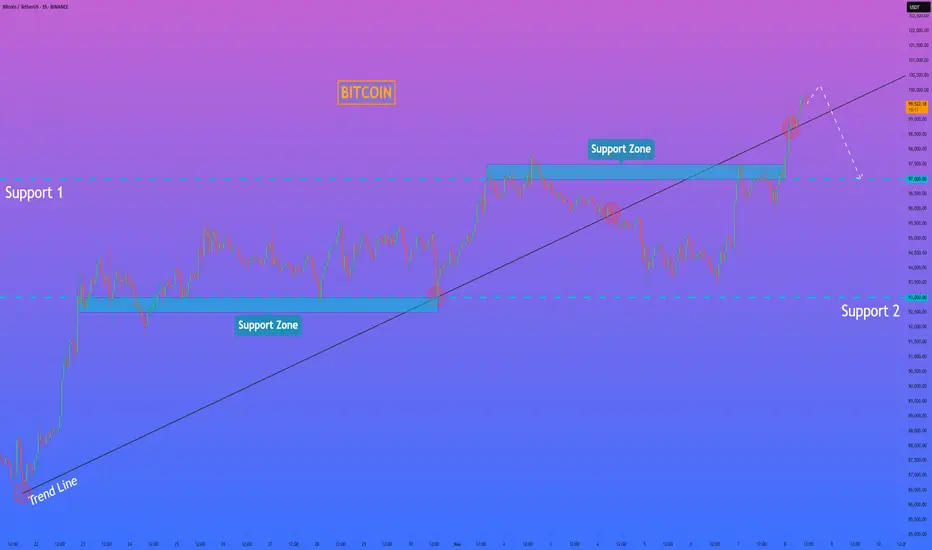
BTC at Key Inflection Zone – Breakout or Rejection Ahead?Asset: BTC/USD
Timeframe: 4H or Daily (based on visual pattern structure)
As of: May 6, 2025
Indicators:
50 EMA (Red): $91,615.79
200 EMA (Blue): $89,305.75
Key Technical Zones:
🔴 Resistance Zone: ~$104,000 – $108,000
This area has historically acted as a major supply zone.
Price has been rejected from this level multiple times, indicating strong selling pressure.
🔁 Flip Zone (Resistance turned Support/Support turned Resistance): ~$95,500 – $100,000
The current price ($95,234.23) is testing this zone from below.
A confirmed break and hold above could signal continuation toward the higher resistance.
🟢 Strong Support Zone: ~$88,000 – $91,000
Confluence of 50 EMA and 200 EMA adds strength to this demand zone.
Previous breakout level and accumulation area.
EMA Outlook:
50 EMA > 200 EMA: Short-term bullish crossover is active, indicating bullish momentum.
Both EMAs are sloping upward slightly, suggesting trend strengthening.
Price is currently above both EMAs, which acts as dynamic support.
Potential Scenarios:
✅ Bullish Scenario:
If price reclaims the $95,500–$100,000 resistance-turned-support zone:
Expect upward momentum to continue.
Target: $104,000–$108,000 zone.
Break of $108K could lead to a macro bull continuation.
⚠️ Bearish Scenario:
If price rejects the current zone and fails to hold above the $91,000 support:
Look for retest of $88,000–$89,000 area (confluence with EMAs).
Breakdown below that zone would invalidate bullish structure and signal potential deeper correction.
Summary:
Bias: Bullish above $91K, Neutral between FWB:88K –$91K, Bearish below $88K.
Key Confirmation Needed: Daily close above $100,000 for strong bullish continuation.
Risk Management: Watch for fakeouts within the $95K–$100K range due to past volatility.

Momentum Rising – $XRP Bulls Eyeing Next Leg UpCRYPTOCAP:XRP is waking up 🔥
Price has broken out of the long-term downtrend and is now testing the important horizontal resistance area
A clean break above this range might spark the next big move. Volume is on the increase, and the structure is all good
Time to keep an eye on this one 👀

XAUUSD at Critical Support – Bullish Continuation or Pullback 🔍 Market Overview
The chart shows a technical setup with clear support and resistance zones, alongside key Exponential Moving Averages (EMAs) to guide directional bias.
📊 Key Technical Levels
Resistance Zone: ~$3,445–$3,460
This is a historically reactive area where price has reversed sharply in the past. A breakout above this zone would suggest strong bullish continuation.
Strong Supporting Zone: ~$3,375–$3,390
Currently being tested. If the price holds here, it could act as a launchpad for a bullish move toward resistance.
Support Zone: ~$3,320–$3,340
If the strong support breaks, the next downside target would be this zone, which aligns with the 200 EMA (blue line) — a dynamic support level.
📈 Moving Averages
50 EMA (Red): Currently at $3,345.60, serving as a short-term dynamic support.
200 EMA (Blue): Currently at $3,304.13, marking a critical longer-term support. Price staying above this EMA reflects a bullish bias.
🔀 Probable Scenarios
Bullish Case (Preferred Scenario)
If price holds the strong supporting zone and breaks above current highs (~$3,395), it could rally toward the resistance zone at $3,445–$3,460.
Break and close above resistance may open the door for further upside continuation.
Bearish Case
A rejection from current levels or a break below $3,375 would likely lead to a retracement toward the support zone ($3,320–$3,340).
A break below the support zone and the 200 EMA would shift the structure into bearish territory.
✅ Bias & Recommendation
Current Bias: Cautiously Bullish
As long as the price remains above the strong supporting zone and 50 EMA, bulls have the upper hand.
Look for confirmation with a higher low or bullish engulfing candle before entering long.
Trade Idea:
Long Entry: On bullish confirmation above $3,395
Target: $3,445–$3,460
Stop Loss: Below $3,375 (support break)

[XAUUSD] Daily Analaysis 12 - 13 May 2025Continuing my mapping in the previous post, H4 GOLD turned out to be stronger and brought GOLD down to support 3195 - 3238. Of course, today's large decline will be followed by a fairly high correction as well. Anticipate GOLD which will correct to the previous low at 3282.
With the confirmed downtrend pattern, the SELL Area 3262 - 3290 is worthy of our SELL position again.

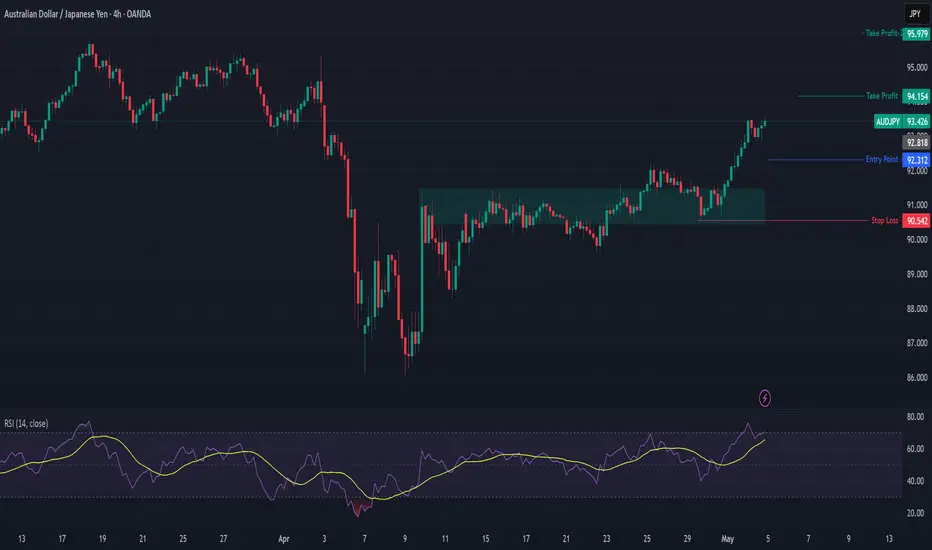
AUDJPY Trade Setup (Bullish Bias)🔥 Setup Summary:
Item Details
Bias: ✅ Bullish
Reasoning:
- Fundamentals strong (expectation no interest rate cuts + CPI bullish)
- JPY weak + overbought COT
- Exogenous: AUD strengthening
- Seasonality bearish short-term BUT medium-term bias bullish
Primary Entry: 🔑 92.30 (Buy Zone)
Dip Buy Zone: 🔄 91.80 – 92.00 (0.5–0.618 Fib retrace)
Stop Loss: 🚫 90.54 (below structure + 0.786 Fib)
Take Profit 1: 🎯 94.15 (below last swing high)
Take Profit 2: 🎯 95.00+ (extended target for trend continuation)
Risk:Reward: ~1:3+ (Entry at 92.3 / TP at 94.15–95.00)
Euro may exit from wedge and then drop to support levelHello traders, I want share with you my opinion about Euro. After a strong impulse to the upside and a retest of the 1.1265 resistance area, the Euro started to consolidate inside a downward wedge. Despite repeated attempts to hold above the 1.1265 - 1.1300 zone, price action gradually shifted lower, creating lower highs within the wedge formation. This pattern often signals continuation or deeper correction, especially when formed after a large bullish move. The recent breakout below both the support area and the lower wedge boundary confirms that bearish pressure is taking control. The rejection from the seller zone and the sharp decline reinforce this shift in sentiment. Now the price is trading near the support line of the wedge and showing weak attempts to recover, forming a potential retest of the broken structure. Given the break of support, I expect the Euro may continue its decline toward the 1.0925 level, which coincides with both the buyer zone and a well-defined support level, thereby exiting from wedge pattern. This zone serves as my current TP 1. Please share this idea with your friends and click Boost 🚀

GOLD Weekly Open Analysis:Gap Down Sparks Fresh Bearish Momentum🟠 GOLD (XAU/USD) – Weekly Open Analysis: Gap Down Sparks Fresh Bearish Momentum
Gold opens the week with a sharp gap-down, reflecting a cooling of global tensions and softer tones in tariff negotiations over the weekend. With both geopolitical risks and trade conflicts showing signs of de-escalation, investors quickly shifted away from safe-haven demand, leading to immediate downside pressure in early Asia hours.
🔍 Market Context:
The price action remains within a bearish parallel channel on the M30 timeframe.
A visible GAP ZONE has formed between $3326 – $3328, which now acts as a key resistance area to watch for a potential retest.
This week brings critical US economic data including CPI, PPI, and a Fed speech, all of which could drive large volatility.
The market is likely to remain extremely sensitive to any shifts in:
US inflation expectations
FED forward guidance
Further headlines on tariffs or geopolitical escalations (Russia–Ukraine, India–Pakistan)
🔧 Trading Strategy for Today (13/05/2025):
Bias: Short-term bearish unless clear reversal signs appear.
Primary focus: Sell the rally, especially near key resistance zones.
🔺 Key Resistance Levels:
$3288
$3308
$3326–$3328 (Gap Fill Zone)
🔻 Key Support Levels:
$3262
$3246
$3236
$3200
🎯 Trade Ideas:
🔵 BUY ZONE:
Entry: $3246 – $3244
SL: $3240
TPs: $3250 → $3254 → $3258 → $3262 → $3266 → $3270 → $3280
Valid only if buyers show strong defense at key support zones.
🔴 SELL ZONE (Main):
Entry: $3326 – $3328
SL: $3332
TPs: $3322 → $3318 → $3314 → $3310 → $3305 → $3300
🔴 SELL SCALP (Early Intraday):
Entry: $3306 – $3308
SL: $3312
TPs: $3300 → $3296 → $3290 → $3286 → $3282 → $3278 → $3270
⚠️ Key Reminders:
Volatility is expected to remain high throughout the week due to macro events and shifting risk sentiment.
Trade with discipline — stick to your TP/SL and avoid emotional entries.
Wait for confirmation at your planned levels. Let the market come to you.
📣 Final Note:
This week is packed with catalysts. Patience and precision will define successful trades. Follow this account for real-time updates as the market reacts to US CPI and Fed commentary.

Fundamental Market Analysis for May 12, 2025 EURUSDEUR/USD is retreating from the gains made in the previous session, trading near 1.12400 in Monday's Asian session. The Euro (EUR) has been under pressure since European Central Bank (ECB) official Olli Rehn said last week that the ECB may consider cutting interest rates at its next meeting, provided that upcoming forecasts confirm a continued trend of disinflation and slowing economic growth.
Despite this, EUR/USD found some support thanks to optimism surrounding the trade talks between the US and China that took place in Geneva. Both sides reported “substantial progress” after two days of talks aimed at de-escalating the ongoing trade dispute. Chinese Vice Premier He Lifeng called the talks an “important first step” in stabilizing bilateral relations, while U.S. Treasury Secretary Scott Bessent echoed his sentiment, noting significant progress.
Markets are now awaiting Washington's response to the European Commission's proposed countermeasures against U.S. tariffs. On Thursday, the Commission launched a public consultation that outlined potential tariffs on up to 95 billion euros worth of imports from the U.S. if trade talks break down.
Meanwhile, the U.S. economic outlook remains uncertain. Federal Reserve (Fed) officials have noted the risk of stagflation, and Fed Chairman Michael Barr has warned that higher tariffs could disrupt supply chains, leading to higher inflation, lower growth and higher unemployment. Investors remain cautious as further escalation of trade tensions could pose serious problems for the US economy.
Trading recommendation: BUY 1.12300, SL 1.11900, TP 1.13000

HelenP. I Gold will rebound from trend line to resistance zoneHi folks today I'm prepared for you Gold analytics. After an aggressive rally from the support zone, the price has been consolidating just below the resistance area. What’s important now is how price behaves around the trend line, which has acted as dynamic support since early April. The most recent pullback landed exactly on this line, where buyers quickly reacted, forming a higher low. This move suggests that the bullish structure remains intact and buyers are defending their positions. The market is currently hovering near 3325, but with momentum slowly building and no major bearish breakdowns, it’s reasonable to anticipate another push higher. The resistance zone between 3405 and 3435 is the next key area, and it aligns with the top of the recent impulse move. If XAUUSD holds above the trend line and breaks through the 3405 level, we could see a continuation toward 3435, my current goal. Overall, the market shows a steady uptrend, supported by rising lows and a strong reaction at the trend line. Until this structure is broken, I remain bullish. If you like my analytics you may support me with your like/comment ❤️

Gold will continue to grow and exit from pennantHello traders, I want share with you my opinion about Gold. After looking at this chart, we can see how the price of Gold has been developing inside an upward pennant, formed after a powerful impulse from the buyer zone. This earlier move created a strong bullish foundation, supported by consistent reactions from the support area, which has since become a key defensive level. After the breakout from the upper boundary of the previous ascending channel, the price entered a phase of consolidation. However, rather than fading, the price action has remained tightly squeezed between the support line and the resistance trendline, creating the structure of a classic pennant. This pattern usually signals continuation, especially when supported by strong preceding momentum, which is exactly what we’re seeing here. Currently, the price is hovering around the support line of the pennant and has already shown signs of bouncing back up. If this rebound continues, the next logical move is a breakout through the resistance line of the pennant, with the 3450 level as a target. It aligns perfectly with the upper boundary and represents a strong technical TP1. Please share this idea with your friends and click Boost 🚀

EGX30 Downward Trend AnalysisEGX30 stock started to fell reaching the 31,661.82 support line, showing the sellers' dominance over the buyers. This is a result of investors' waiting for the outcome of U.S.-China trade talks on the weekend. In addition, blue-chip developer Emaar Properties reported Q1 net profit of 3.71 billion dirhams that missed the analysts' estimate of 4 billion dirhams.

HelenP. I Bitcoin can break trend line and fall to support levelHi folks today I'm prepared for you Bitcoin analytics. After a strong rally, зкшсу has reached a critical zone, and the reaction here might become a key pivot for short-term price action. Price managed to break above the ascending trend line, but instead of continuation, we saw a clear rejection from the 99500 area, followed by a sharp drop back below the trend structure. This type of movement often indicates bull trap behavior. Breakout traders enter on momentum, but then get squeezed as the price fails to hold above the trend. At the same time, buyers are beginning to lose control, and sellers are regaining initiative near major resistance. Importantly, BTC is now pulling back toward a support zone between 97500 and 97000, which previously acted as a base for consolidation. If this level fails to hold, the next support lies around 93000, where the trend originally started. The structure is shifting. A trend line break followed by a failed retest often signals a trend reversal or, at least, a deeper correction. I expect BTCUSDT can drop to the 97000 level, breaking the trend line. If you like my analytics you may support me with your like/comment ❤️
GOLD - Price can bounce up to $3475 points, exiting from pennantHi guys, this is my overview for XAUUSD, feel free to check it and write your feedback in comments👊
A few moments ago price traded inside flat, where it two times broke $3045 levels and then made impulse up.
Price exited from flat and continued to grow inside a pennant pattern, where it later reached $3320 level.
Then Gold broke this level and rose to resistance line of a pennant, and then made a correction to support level, and then broke it.
After this, the price declined to the support line of the pennant, after which it turned around and bounced up.
Gold broke $3320 level and rose to resisance line of pennant, but recently it made correction to this level.
So, now I expect that price can bounce up from this level to $3475, thereby exiting from pennant pattern.
If this post is useful to you, you can support me with like/boost and advice in comments❤️

Gold Friday Volatility – Liquidity SweepsGold Friday Volatility – Liquidity Sweeps & Potential Channel Break Ahead
Gold kicked off Friday with intense volatility, triggering sweeping liquidity grabs during the Asian session. Price dropped aggressively into the 327x region, clearing stop zones and vacuuming liquidity — only to quickly rebound and fill the imbalance above.
This classic FVG (Fair Value Gap) behavior was especially visible on the M30 timeframe, as price repeatedly left behind inefficient zones and promptly returned to fill them. Volatility remains elevated — and traders should proceed with caution.
📉 Technical Context – End of the Downtrend?
Since Thursday, gold has been trading in a clean descending parallel channel, respecting lower highs and pushing downward. However, late in the Asian session today, a bullish momentum surge appears to be testing the upper boundary of this channel.
We are now watching the 3324 level very closely.
A confirmed breakout above this zone — with candle closure outside the trendline — would suggest a structure shift and open the door for BUY setups on the retest.
Until then, we observe. Let price confirm. We trade the reaction, not the assumption.
🌍 Macro Risk – Trade Tensions & Weekend Volatility
The market remains extremely reactive to:
Geopolitical risks: Military tensions are still simmering.
US–China tariff discussions: President Trump is expected to make remarks on tariff policy.
Any surprise here could heavily impact USD and gold.
⚠️ Liquidity sweeps are common on Fridays — especially into London and NY sessions — so risk management is critical today.
📌 Key Technical Levels to Watch
🔺 Resistance:
3345 → 3364 → 3395
🔻 Support:
3280 → 3270 → 3256 → 3244 → 3225
The 3324 and 3366 zones are particularly critical.
If price closes firmly above these zones, bullish continuation becomes more likely.
If price gets rejected, we stay within range and look for sell opportunities.
🎯 Trade Plan – Friday, May 10
🟢 BUY ZONE
Entry: 3280 – 3278
SL: 3274
TPs: 3285 → 3290 → 3295 → 3300 → 3305 → 3310 → 3320
🔴 SELL ZONE
Entry: 3364 – 3366
SL: 3370
TPs: 3360 → 3356 → 3352 → 3348 → 3344 → 3340 → 3330
🧠 Final Thoughts:
Friday often delivers unexpected liquidity traps.
With news expected from the White House and technical structure on the verge of a break, this session could offer both risk and reward — if approached with discipline.
✅ Use clear levels.
✅ Respect TP/SL.
✅ Stay sharp as NY volume enters.
📣 Let’s end the week strong. Drop your charts and ideas below!

#ETH Breakout is incoming!$ETH/USDT – Breakout Watch
Ethereum is currently retesting a key descending resistance line after an extended period of consolidation. The structure suggests growing bullish momentum.
🟢 A successful breakout and daily close above the $1,900–$2,000 zone could trigger a move toward $2,200–$2,400 in the coming sessions.
Watch for confirmation with volume expansion and retest behavior. Rejection at this level could delay the move, but the pressure is clearly building.
Key Levels:
Resistance: $1,900–$2,000
Target: $2,200–$2,400
Support: $1,800
Chart looks clean breakout potential is real.
DYOR NAF
BINANCE:ETHUSDT BITSTAMP:ETHUSD
