XAUUSDWe have two scenarios in the analysis: either a rise in the form of a trend, a staircase, or a deep correction and taking the buy zone. We wait for the deep correction of the market and taking the buy zone. However, if it rises in the form of a staircase, we will renew the entry, but in the event of any entry, geopolitical situations end the analysis and we analyze another analysis or another renewal.
Analysis

Silver Analysis: Bearish Continuation Toward $31 Support ?🧠 Chart Context & Setup
Chart Type: Candlestick
Timeframe: Likely 4H or Daily
Indicators Used:
EMA 50 (Red) — 32.814
EMA 200 (Blue) — 32.559
🔍 Key Technical Levels
Resistance Zone: 33.600 – 33.950
Price faced repeated rejection in this zone, confirming it as a valid supply/resistance area.
Support Zone: 30.600 – 31.100
Marked as the next potential demand zone, aligning with previous accumulation and reaction levels.
Current Price: ~32.618
Just below the 50 EMA and slightly above the 200 EMA.
🔄 Market Structure
The market experienced a strong bearish impulse in early April, followed by a bullish correction that reclaimed the 200 EMA.
Multiple internal liquidity (INT.LQ) sweeps were taken before forming a potential lower high (LH) at the resistance zone.
The recent bearish move broke below the EMAs and previous structure, indicating a possible shift back to bearish momentum.
📉 Bearish Scenario Outlook (Most Probable as of Now)
The chart shows a projected lower high formation, likely leading into a continuation of the bearish move.
If price fails to break back above 32.800–32.900, we could expect a sell-off toward the support zone (30.600–31.100).
This move aligns with:
Breakdown below EMAs
Failed bullish continuation
Rejection from a strong resistance zone
🧭 EMA Analysis
EMA 50 > EMA 200, but the price is now sandwiched and showing signs of weakness.
If price sustains below both EMAs, momentum is likely to favor bears in the short to medium term.
⚠️ Risk Factors to Watch
Any strong bullish engulfing candle reclaiming the 33.000 zone could invalidate the bearish thesis.
Fundamentals like USD volatility, inflation data, or geopolitical tension could impact Silver drastically.
✅ Conclusion
The chart currently suggests a bearish continuation setup, with the potential for price to revisit the $31.00–$30.60 support zone after rejecting resistance. A retest of broken structure around 32.700–32.800 might provide an ideal entry for sellers.

Silver – Bearish Move Toward Support🧠 Market Overview:
Instrument: Likely Silver (based on file name).
Chart Context: The price is currently trading below both the 50 EMA (red) and 200 EMA (blue), indicating bearish momentum and a possible shift in market structure.
📊 Key Technical Components:
🔹 Exponential Moving Averages (EMA):
50 EMA (32.614) is above the 200 EMA (32.526) but both are above the current price.
This crossover is recent and could indicate the beginning of a larger downtrend if confirmed by continued price action below both EMAs.
🔹 Market Structure:
POI (Point of Interest) marks a previous swing high where selling pressure emerged.
The chart shows internal liquidity (INT.LQ) sweeps both above and below consolidation areas, hinting at smart money manipulation to grab liquidity before making a move.
🔹 Resistance Zone:
Clearly defined between approx. 33.4–34.0, where price was rejected after a failed attempt to break higher.
Multiple rejections from this zone show strong selling pressure.
🔹 Support Zone:
Sitting between approx. 30.8–31.2.
Price previously consolidated here before a bullish move, making it a likely target for a return test or a potential bounce.
📉 Bearish Scenario & Projection:
The price broke below a short-term structure and failed to hold above EMAs.
The current price action shows a bearish pullback likely to form a Lower High (LH).
The projected path shows a pullback to previous support-turned-resistance, followed by a breakdown targeting the support zone.
✅ Bias:
Short-term bias: Bearish
Medium-term bias: Bearish, unless price reclaims the 200 EMA and consolidates above the resistance zone.
🔍 Confluences Supporting Bearish Outlook:
Price below EMAs (dynamic resistance).
Failed higher highs with liquidity sweeps (indicating smart money selling).
Clear market structure shift to the downside.
Anticipated retest of support zone around 30.8–31.2.

XAU/USD Market Outlook – Key Levels & Scenarios (May 2025)📊 Market Overview
Asset: XAU/USD (Gold vs. USD) – likely
Timeframe: 🕒 4H or Daily
EMAs:
🔴 50 EMA = 3,281 (short-term trend)
🔵 200 EMA = 3,179 (long-term trend)
🧱 Key Zones
🔺 Main Resistance Zone (🚫 Supply Area)
📍 ~3,320–3,400
🔍 Observation: Strong rejection zone with multiple failed attempts. 🚧 Price struggles to break and hold above here.
⚖️ Mid Support & Resistance Zone
📍 ~3,200–3,250
🧭 Current Action: Price is consolidating here. This is a key decision zone. A bounce or breakdown will likely decide the next big move. 🤔
🟦 Main Support Zone
📍 ~2,980–3,030
🛑 Observation: Major demand zone. If price falls here, it might attract buyers 👥 for a potential rebound.
📉 EMA Analysis
🔴 50 EMA is above 🔵 200 EMA → Trend still technically bullish ✅
🟡 BUT: Price is currently below 50 EMA, showing short-term weakness ⚠️
⚡️ 200 EMA is nearby (~3,179): Acting as dynamic support — a critical bounce zone! 🛡️
🔮 Scenarios
🐂 Bullish Path
✅ If price bounces from 3,200 support zone and reclaims 🔴 50 EMA:
🎯 Target: Retest of 3,320–3,400 🔺 zone
📈 Confirmation: Strong candle closing above 3,281 🔴 EMA
🐻 Bearish Path
🚨 If price breaks below 3,200 & 200 EMA:
🕳️ Expect drop towards 2,980–3,030 🟦 zone
📉 Confirmation: Candle closes below 3,179 with weak retest
✅ Conclusion
📍 Key Level to Watch: 3,200
⚖️ Market Sentiment: Neutral → Bearish bias unless price reclaims 50 EMA
🔒 Risk Tip: Avoid longs until price confirms bullish structure again 🔐

Gold (XAU/USD) Analysis – Technical + Fundamental OutlookTechnical Outlook
Gold is currently trading inside a descending channel and has reached the midline, which is acting as dynamic resistance.
📍 Key Levels:
Resistance: 3310 – 3320 (aligned with the midline of the channel) – price has not yet confirmed a breakout above this zone
Next Bullish Targets: 3350 – 3358 / 3385 – 3390
Support Zone: 3270 – 3280 (potential bullish re-entry area)
🟣 All key price levels are marked on the chart with light purple lines for clarity.
🟠 RSI is near 65, showing bullish momentum but approaching overbought territory, signaling a possible short-term pullback.
🔁 Likely scenario: A minor correction toward 3270–3280 followed by continuation toward 3350+ if support holds.
Fundamental Context
The ISM Services PMI came in stronger than expected (51.6 vs. 50.2 forecast), reflecting economic resilience in the U.S. This typically supports the USD and weighs on gold, but:
Rising tariff threats from Trump raise recession concerns.
Services Prices Index rose to 65.1, signaling growing inflation pressures.
These inflation concerns may impact the Fed’s upcoming rate decisions.
Central bank demand and geopolitical risks continue to support gold medium-term.
Summary
Despite being inside a descending channel, gold is showing short-term bullish strength. A confirmed break above 3320 could open the way toward 3350+. Otherwise, a pullback to the 3270–3280 area may offer the next setup.

Watching carefully USDCAD this weekWith the abundance of US & CAN data this week, we may see some interesting action in USDCAD pair.
Let's dig in.
Let us know what you think in the comments below.
Thank you.
77.3% of retail investor accounts lose money when trading CFDs with this provider. You should consider whether you understand how CFDs work and whether you can afford to take the high risk of losing your money. Past performance is not necessarily indicative of future results. The value of investments may fall as well as rise and the investor may not get back the amount initially invested. This content is not intended for nor applicable to residents of the UK. Cryptocurrency CFDs and spread bets are restricted in the UK for all retail clients.

AUDJPY, our risk on/off monitor, is near a key resistance areaAUDJPY has been on a good run lately. The driving force behind it was the improved market sentiment due to the calming moment in the tariff wars. Can this be sustained?
Let's look at the technical picture of AUDJPY.
Let us know what you think in the comments below.
Thank you.
77.3% of retail investor accounts lose money when trading CFDs with this provider. You should consider whether you understand how CFDs work and whether you can afford to take the high risk of losing your money. Past performance is not necessarily indicative of future results. The value of investments may fall as well as rise and the investor may not get back the amount initially invested. This content is not intended for nor applicable to residents of the UK. Cryptocurrency CFDs and spread bets are restricted in the UK for all retail clients.

EURO - Price can rise to top part of flat from support areaHi guys, this is my overview for EURUSD, feel free to check it and write your feedback in comments👊
Some time ago, price entered to wedge, where it bounced from support line and rose to $1.0860 level, breaking $1.0470 level.
Then price broke $1.0860 level too, but then it made correction to support line of wedge and then made upward impulse.
Euro exited from wedge and continued to grow to $1.1260 level, after which broke this level and started to trades in flat.
Inside flat, price rose to top part of flat and then made correction to support area, where it some time traded close.
At the moment, Euro trades inside support area, near support level, so, I think that price can correct to $1.1260 level.
After this movement, in my mind, EUR can start to grow to $1.1570 top part of the flat.
If this post is useful to you, you can support me with like/boost and advice in comments❤️

Fundamental Market Analysis for May 6, 2025 GBPUSDGBPUSD:
The GBP/USD pair started the new week on a subdued note and is fluctuating in a narrow trading range around 1.3260-1.3265, near the one-week low reached during the Asian session.
The US Dollar (USD) remains on the defensive below multi-week highs amid heightened economic uncertainty amid US President Donald Trump's tariff plans and is a key supportive factor for the GBP/USD pair. Furthermore, the prospect of more aggressive policy easing by the Federal Reserve (Fed) is further undermining the US Dollar.
Despite a better than expected US non-farm payrolls report on Friday, investors seem convinced that the US central bank will resume its rate-cutting cycle in June and reduce borrowing costs by 100 basis points by the end of this year. This, along with optimism about a potential de-escalation of the trade war between the US and China, is reducing demand for the safe-haven dollar.
However, traders seem reluctant to make new bullish bets on GBP/USD and prefer to wait for this week's key event - the Bank of England's (BoE) monetary policy meeting on Thursday. The UK central bank is expected to cut interest rates by 25bps and take a somewhat soft stance amid downside risks to growth from the trade war.
In addition, this week traders will face the publication of the FOMC meeting minutes, which will affect the USD price dynamics and give a meaningful impetus to the GBP/USD pair.
Trading recomendation: SELL 1.3280, SL 1.3290, TP 1.3180

Week ahead analysis May 4th to 11th**Week Ahead Analysis (May 5 – May 11, 2025)**
### **Baseline: Market Expectations**
- **Tariffs & Fed Policy:** Trump's tariff announcement has heightened concerns about economic slowing, prompting bond markets to price in up to four Federal Reserve rate cuts this year.
- **Trade Talks & Sentiment Shift:** Reports suggest China may restart trade negotiations, boosting risk sentiment. However, China insists the U.S. must first remove all unilateral tariffs, adding uncertainty to the discussions.
- **Market Reaction:** Risk assets—equities and high-beta currencies like AUD, NZD, and CAD—are climbing as volatility cools. Meanwhile, safe havens such as JPY, CHF, and gold are facing selling pressure, though overall risk sentiment remains cautious.
### **Potential Surprise Scenarios**
- **Trade Deal Secured:** A deal would likely send equities higher, strengthen risk-sensitive currencies, and drive safe havens lower.
- **No Deal Reached:** In contrast, safe havens could gain while risk assets retreat.
### **Big Picture Outlook**
Regardless of the immediate outcome, the market's medium-term trajectory hinges on the broader effects of trade policy. If tariffs persist, economic uncertainty may sustain the Fed’s dovish stance. A successful trade deal, however, could restore confidence, shifting expectations back toward growth stabili

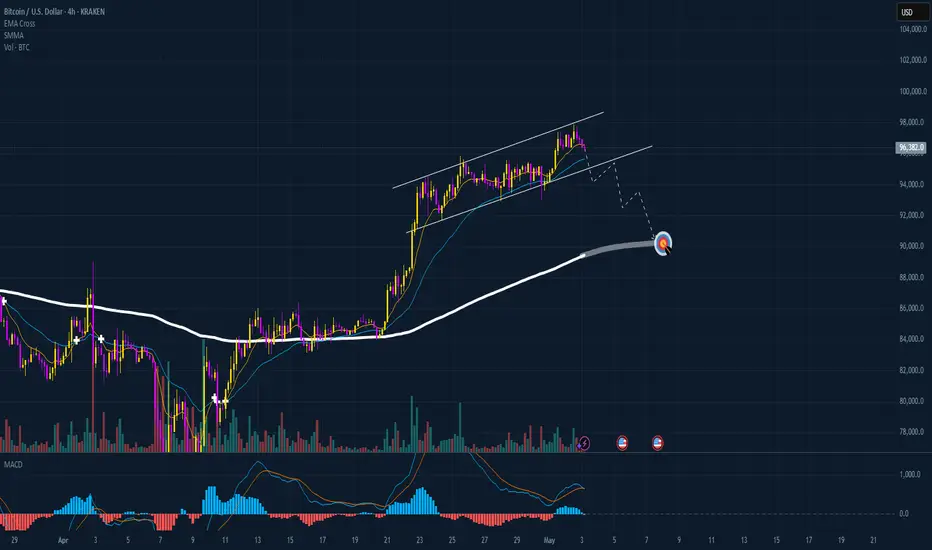
btc . april recap . may outlookMAY instantly starts with a SHORT SQUEEZE
- out of pwRange
- into cwRange + 1 step higher
- all good, all bullish - but a price drop on HTF would open great opportunities for SHORT + LONG, while keeping bullish momentum
02.04.2025 . SHORT IDEA
- after trading out of range, start trading the/within new range
- approaching cmHigh towards 2pm Berlin time
- ladder in for possible SFP
- give yourself a little wiggle room for the SL, if price breaks +2% and approaches the next SFP level, a short entry higher towards friday close has a better R:R
entry. 97368
tp1 . 950908
tp2 . 94095
tp3 . 85113
LONG IDEA
- wait and see where the price find its support
- possibility that we keep STRONG BULL momentum, if price stays within cwVA
- on the way there, find percentage levels for daily +1.5% trades

Gold can correct to support level and then continue to move upHello traders, I want share with you my opinion about Gold. After studying this chart, we can track the progression of Gold's price action from strong bullish momentum to its current consolidation. Initially, the market trended confidently inside an upward channel, with steady growth supported by the lower boundary of the channel and occasional corrections after touching the resistance line. Each pullback respected previous support zones, a strong signal of buyer control at the time. The most impulsive move came after the price exited the buyer zone, followed by a clean breakout above the resistance line of the channel. However, once the price entered the seller zone, we saw the momentum start to fade. A strong rejection occurred near the resistance level at 3370, which eventually triggered a series of lower highs and shifted the market into a more neutral, range-bound phase. Currently, Gold is trading inside a defined range between 3205 and 3370. The bottom of this range aligns perfectly with the buyer zone, which already acted as a strong support during the last decline. We can also observe the market beginning to show signs of reversal after tapping the zone again. Given the reaction from the support area and the structure of the range, I expect the price can bounce back and make another attempt to reach the 3370 resistance level, which is my TP1 for this scenario. Please share this idea with your friends and click Boost 🚀

XAUUSD swing Analysis XAUUSD took support from support line,
All long targets are achieved.
this month taking rejection from major resistence,
Let's track the moves to down.
follow for more swing analysis on INDICES - CURRENCY - COMMODITIES

CHILLGUY Structure Looks Solid — Watch for the Bounce#CHILLGUY IMO, it will come back around the previous resistance level, which is now acting as support.
From there, we can see a fresh bounce and a strong move upward.
The structure looks good; there is no noise, just clean price action.
#Altseason2025

$CGPT Holding Strong — Another Move Coming?$CGPT is holding the uptrend well. 🚀
It bounced from the trendline and the 200 EMA, just like before.
The structure still looks strong with higher lows and steady volume.
This pullback could be the setup for another move up.
Watch this level closely.
Retweet if you are bullish!
DYOR, NFA
#Altseason2025

$DARK Breakout Alert — 2x Potential in Sight?Spotted something interesting on $DARK 👀
After 10 days of slow grinding, it broke out of a falling wedge, and now it’s retesting that level perfectly.
No panic, just a clean setup.
If this bounce holds, we could see a strong move up, even 2x from here.
It might be time to zoom in before everyone else does.

HelenP. I Euro may correct to trend line and then rebound upHi folks today I'm prepared for you Gold analytics. After a sharp, impulsive rise, price entered a broad consolidation phase between 1.1575 and 1.1270 levels, creating a horizontal channel where price oscillated for several sessions. This type of structure often serves as a re-accumulation zone during a trending market. What's particularly notable is the recent touch of the lower boundary of the range, which coincided with a retest of both the ascending trend line and the support zone around 1.1270 points. This confluence of technical factors makes the current area critical for further price development. Following the bounce from the support zone, the pair is showing early signs of recovery. The trend line has held firmly, and buyers stepped in with a reaction candle confirming demand interest. While EUR is not yet out of the consolidation, the structure suggests strength and potential continuation. Given the alignment of the upward trend line, support zone validation, and stabilization after the drop, I expect that EURUSD may climb almost toward the upper boundary of the consolidation. That's why my current goal lies at 1.1500. If you like my analytics you may support me with your like/comment ❤️

GOLD - Price can grow to $3370 resistance levelHi guys, this is my overview for XAUUSD, feel free to check it and write your feedback in comments👊
Recently, price entered to pennant, where it at once bounced from support line and started to grow, but soon corrected.
After this movement, Gold made upward impulse, and broke $3205 level, after which it made retest and continued to move up mext.
Soon, it reached $3370 level, broke it and then rose to resistance line of pennant, after which started to fall.
In a short time, price declined below $3370 level, breaking it again, and then some time traded below.
Later, Gold continued to fall and declined to support level, which coincided with support line of pennant.
Now, I think that price can bounce up from support level to $3370 level, exiting from pennant pattern.
If this post is useful to you, you can support me with like/boost and advice in comments❤️

$SIGN Waking Up — Breakout Looks CleanSIX:SIGN is waking up 👀
It broke out of the downtrend clean move above $0.09
That old resistance? Now acting as support. That’s a good sign.
Price is holding above the MA, buyers are in control.
Next stop? $0.105 to $0.12 range.
This could be just the beginning.
Keep it on your radar.
#ALTSEASON #GEM

TMG Holding Fundamental and Chart AnalysisTMG Holding trend has recently taken an upward trend between the support line 46.873 and the resistance line 54.511, up by 0.78%. It is expected to keep rising till breaking the 1st resistance line at 54.115 and then the 2nd one at 54.423 points because of positive fundamental analysis. On one hand, the CBE's decision about cutting the interest rate by 2.25% would lead to positive impact on corporates because of the current reasons behind the economic activity, decreasing interest rate will lead to a decrease in the cost of borrowing, which will decrease the cost of production and will increase the corporates' profit and their monetary value. Accordingly, this will lower the products' price and individuals will have a higher will to diversify their investments and increase their purchasing power. On the other hand, besides the current annual advertisements about SouthMed and the summer getting closer, there is news on Reuters about an advanced stage of negotiations for a new large-scale mixed-use project in Iraq. This project is estimated to generate total sales vicinity of $17 Billion and annual recurring income exceeding $1.5 Billion.

BTC HAVE A HIGH PROBABILITY TO FALL DOWN!!!The BTC starts looking weak and it's perfect time to long for a short. We are almost at the top of this run from last weeks and we can see that BTC made a perfect divergence pattern. My indicator shows me also that we are entering a mid-term bearish trend and there is a high chance that we are gonna fall much deeper than in last weeks. My target is clear and I'm holding my strategy so I wait for the price to hit my SMA line like it was in the last days but now I wait for the price to hit the SMA line at 4H chart because we didn't hit it since 2 weeks so in this moment we can see even in a few candles that the price is gonna touch it. I am actually in the short and waiting for the price to go for my target, we also have a weekend so the price will be probably slow but everything can happen. In my opinion next week are gonna be red and the price should touch my target. I recommend to watch a 1H and 2H chart and looking when price will hit the SMA line on these timeframes because my target is set in a 4H chart but we can book profits even when the price will hit the SMA at 1H and at 2H chart. Be careful and stay focused.
EUR/USD - Channel Breakout (02.05.2025) FX:EURUSD The EUR/USD pair on the M30 timeframe presents a Potential Buying Opportunity due to a recent Formation of a Breakout Pattern. This suggests a shift in momentum towards the upside and a higher likelihood of further advances in the coming hours.
Possible Long Trade:
Entry: Consider Entering A Long Position around Trendline Of The Pattern.
Target Levels:
1st Resistance – 1.1387
2nd Resistance – 1.1430
🎁 Please hit the like button and
🎁 Leave a comment to support for My Post !
Your likes and comments are incredibly motivating and will encourage me to share more analysis with you.
TVC:DXY
Best Regards, KABHI_TA_TRADING
Thank you.

Bearish Rejection at Resistance – Potential Drop Incoming🔍 Chart Analysis Summary
1. Key Zones
Resistance Zone: ~$3,340 – $3,360
Price has been rejected multiple times from this area, showing strong selling pressure.
Support Zone: ~$3,200 – $3,240
Strong historical support level, previously held during a pullback after the last rally.
2. Moving Averages
EMA 50 (Red): Currently at ~$3,340
Price is fluctuating around it, indicating short-term indecision or a possible retest.
EMA 200 (Blue): Currently at ~$3,300
Acting as a mid-term support level. Price previously bounced from this region.
3. Pattern and Price Action
Fakeout Potential:
The chart suggests a possible false breakout above the resistance followed by a sharp drop—highlighted by the arrow. This is a common bull trap setup.
Bearish Outlook Indicated:
The projected path suggests a rejection from resistance and a drop to the support zone (~$3,200). This would create a lower high, a bearish sign.
4. Trading Bias
Bearish Setup if:
Price fails to hold above $3,340 (EMA50).
Price gets rejected from the resistance zone and breaks below $3,300 (EMA200).
Bullish Invalidated if:
Price closes convincingly above the $3,360 resistance with volume, flipping it into support.
📉 Potential Trade Idea
Short Entry: Around $3,350–$3,355
Stop Loss: Above $3,365 (above resistance zone)
Target: $3,220–$3,230 (support zone)
