HelenP. I Bitcoin can make movement up and then start to fallHi folks today I'm prepared for you Bitcoin analytics. Price continues to move inside a rising wedge, gradually climbing higher while respecting the boundaries of the formation. After a strong impulsive breakout above the 93000 level, the market has entered a phase of sideways consolidation just below the upper boundary of the pattern. This area acts as a pressure zone, where bullish attempts are becoming weaker, and the price starts to lose momentum. What's important is how clearly the trend line has been respected, with multiple touchpoints confirming its significance. Recently, BTC tested the lower boundary of the wedge near 93000, rebounded, and made another push upward. However, despite this growth, the price is nearing the resistance formed by the wedge's upper boundary, and this structure often implies a potential reversal once the market loses steam. Given this setup, I expect BTCUSDT to reject the upper edge and correct toward 95000, my short-term goal. This level aligns with the trend line, making it a logical area for the price to seek equilibrium again. If you like my analytics you may support me with your like/comment ❤️
Analysis

Bitcoin may rebound from seller zone and start to declineHello traders, I want share with you my opinion about Bitcoin. In the past, the price had been consolidating within a broad range, repeatedly rejecting support and resistance zones. The buyer zone between 79100 - 80300 provided a strong base, and from there, BTC began to grow, forming a bullish structure that led into an upward wedge. This growth accelerated once the price broke through the support area and continued upward until it approached the resistance level at 95500, which also overlaps with the seller zone. As the price moved inside the wedge, the bullish impulses weakened. Buyers lost strength near the resistance line of the wedge, and recent price action suggests that sellers are stepping in at the top. We’ve now seen multiple failed attempts to break higher, and the price is consolidating under resistance, forming pressure to the downside. This entire consolidation near the wedge resistance, especially inside a confirmed seller zone, indicates a likely reversal. The current structure shows signs of exhaustion, and if the support line of the wedge breaks, that would trigger a significant correction. Given this context, I expect BTC can make a bearish move toward TP1 at 91500 points. Please share this idea with your friends and click Boost 🚀

Euro can continue to move up inside upward channelHello traders, I want share with you my opinion about Euro. Looking at this chart, we can observe how the price has been moving confidently within the boundaries of a well-formed upward channel. After an extended period of consolidation inside the buyer zone, the market began forming higher lows and eventually broke out with strong bullish momentum. That breakout was followed by a smooth trend-building phase, where each correction found support at higher levels, a clear signal of growing buyer interest. As the price moved higher, it respected both the support line and the support level at 1.0910, reinforcing the structure of the channel. When the market reached the support area, it consolidated for a while before launching another impulse up, confirming the breakout and creating a new higher support zone. Now, the market has pulled back into the support zone, which aligns with the 1.1285 current support level and the lower boundary of the channel. Given the strength of the overall trend, the clear structure of the upward channel, and the reaction from a key support zone, I expect the pair to continue moving higher toward TP1 at 1.1600 points. Please share this idea with your friends and click Boost 🚀

BITCOIN - Price can exit from wedge and rose to $102K pointsHi guys, this is my overview for BTCUSDT, feel free to check it and write your feedback in comments👊
Some days ago, the price declined to $81600 level, after which it bounced and rose to $88500 points and then started to fall.
Also price entered to wedge pattern, where it fell to support line, breaking support level, but soon turned around and bounced up.
Price broke $81600 level again and continued to grow next, but later it corrected to support line.
Then, BTC rose from this line to $93000 level, broke it, and reached resistance line of wedge, after which corrected.
After correction, BTC fell to $93000 level and then rose back to resistance line of wedge, where it trades close.
In my mind, price can correct to support line and then bounce up to $102000 points, exiting from a wedge.
If this post is useful to you, you can support me with like/boost and advice in comments❤️

EURO - Price can drop to support level and then start to move upHi guys, this is my overview for EURUSD, feel free to check it and write your feedback in comments👊
Recently, price started to decline inside falling channel, where it reached support line firslty and then bounced up.
Price grew to the resistance line of the channel, which coincided with $1.0950 level, and then in a short time fell back to support line.
Next, Euro made an upward impulse, thereby exiting from channel, and also soon broke $1.0950 level.
After this, price rose a little and then made correction, after which coincided to move up inside pennant.
In the pennant pattern, the price broke $1.1320 level and later reached the resistance line, after which corrected.
Now, I think that the Euro can exit from pennant, fall to the support level, and then bounce up to $1.1510
If this post is useful to you, you can support me with like/boost and advice in comments❤️

2 Mai - Gold targeting 3318 ?💰 Gold on the Move – Bearish or Bullish? 🤔
Hey traders! 👋
On the 1H chart, Gold was chillin’ on a trendline starting from $3386 on Wed, Apr 23, climbing up till $3353 on Mon, Apr 28 📈. But then... it changed direction! 😬
Starting Wed, Apr 30, we saw a shift to a lower trendline at $3319, and today it’s trying to climb above $3300 🔄.
📉 Bearish vibes? We're eyeing a dip toward $3279.
📈 Bullish comeback? If Gold breaks above $3279, we might see some real momentum! 🚀
👉 What’s your take? Drop your thoughts in the comments! 💬
-------------------------------------------------------------------------
This is just my personal market idea and not financial advice! 📢 Trading gold and other financial instruments carries risks – only invest what you can afford to lose. Always do your own analysis, use solid risk management, and trade responsibly.
Good luck and safe trading! 🚀📊

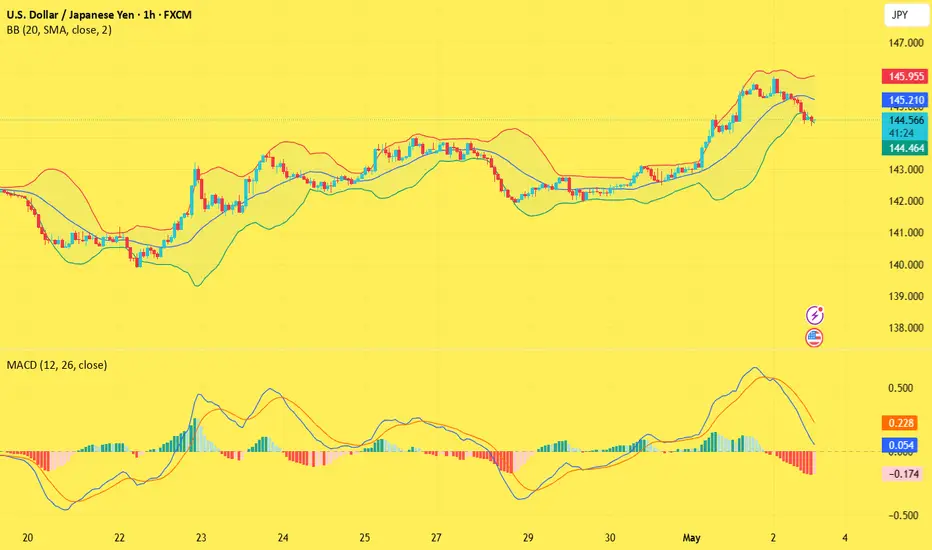
USD/JPY(20250502)Today's AnalysisToday's buying and selling boundaries:
144.67
Support and resistance levels:
147.49
146.44
145.75
143.58
142.90
141.84
Trading strategy:
If the price breaks through 145.75, consider buying, the first target price is 146.44
If the price breaks through 144.67, consider selling, the first target price is 143.58
Gold on Edge – Will NFP Trigger the Next Big Move?🚨 Gold at a Crossroads – Will NFP & White House Comments Trigger a Volatility Spike? ⚡
🧭 Macro Overview
Gold enters the US session with a mild rebound after a sharp selloff, following its historic climb to $3,500/oz. The recent drop was driven less by fundamentals and more by aggressive profit-taking, especially from retail flows in Asia, notably China.
Rather than a trend reversal, this correction looks like a healthy technical reset, just ahead of two major catalysts:
1️⃣ US Non-Farm Payrolls (May edition)
2️⃣ White House remarks on tariffs and trade strategy
These two factors will likely define gold’s direction heading into next week — either toward deeper support zones or a potential recovery rally into resistance.
📊 DXY & Macro Market Lens
The US Dollar Index (DXY) has bounced off its base near 98.xx, currently testing the 100.00 level. Whether the dollar strengthens further depends largely on today’s labour data and fiscal signals from Washington.
Traders should remain tactically neutral, relying on intraday timeframes like H1/H2 and respecting key price structure.
🔺 Key Resistance Levels
3,260
3,275
3,285
3,312
🔻 Key Support Levels
3,244
3,230
3,215
3,200
🎯 Trade Plan – Friday 3rd May, 2025
🔵 BUY ZONE A:
Entry: 3,232 – 3,230
SL: 3,226
TP: 3,236 → 3,240 → 3,244 → 3,248 → 3,252 → 3,256 → 3,260
🔵 BUY ZONE B:
Entry: 3,214 – 3,212
SL: 3,208
TP: 3,218 → 3,222 → 3,226 → 3,230 → 3,235 → 3,240
🔴 SELL ZONE:
Entry: 3,276 – 3,278
SL: 3,282
TP: 3,272 → 3,268 → 3,264 → 3,260 → 3,250
⚠️ Final Notes
Volatility may spike sharply during the NY session as NFP and political news collide.
This is the kind of session where traders can either capitalize massively or get caught offside — stay disciplined.
Avoid emotional entries — let price come to you, wait for confirmation, and stick to your TP/SL.
📣 Conclusion
We’re likely in a calm-before-the-storm scenario. Gold hasn’t made its real move yet — but when it does, it’ll be swift.
Prepare. Execute. Protect your capital.

Fundamental Market Analysis for May 2, 2025 EURUSDThe EUR/USD pair attracted moderate buying interest during the Asian trading session on Friday and demonstrates a desire to consolidate above the psychologically important level of 1.13000. At the moment, spot quotes seem to have broken a three-day series of declines, reaching a two-week low near 1.12650, recorded on Thursday, amid repositioning of market participants awaiting the publication of key macroeconomic indicators from the Eurozone and the United States.
Representatives of the European Central Bank (ECB) earlier expressed concern over the risks of lower inflationary pressures in the region. In this regard, market participants are waiting with special attention for the preliminary data on the consumer price index (CPI) in the eurozone. Indicators that turned out to be lower than forecasts may strengthen expectations of the ECB key interest rate reduction by 25 basis points following the results of the meeting in July. Such a development could put pressure on the single European currency and contribute to the resumption of the EUR/USD corrective movement from the level of 1.1575 - the maximum since November 2021, recorded last month.
In the United States of America, investors' attention is focused on the upcoming Non-Farm Payrolls report (NFP), according to forecasts of which the US economy could create only 130 thousand new jobs in April, which is significantly lower than the March value of 228 thousand. At the same time, the unemployment rate, according to preliminary estimates, will remain at 4.2%. These data may have a significant impact on expectations of further monetary policy steps by the Federal Reserve (Fed), which, in turn, will affect the dynamics of the US dollar and determine the short-term trajectory of EUR/USD.
Additionally, the persistent expectations of a looser monetary policy of the Federal Reserve System (FRS) restrain the potential for strengthening of the US dollar, despite its three-day rise to local highs. In particular, market participants have increased expectations for four 25 basis point interest rate cuts before the end of this year, after recently released statistics pointed to an unexpected contraction in US GDP - for the first time since 2022. As a result, the dollar bulls' positions remain limited, which provides support to the EUR/USD pair.
Trading recommendation: BUY 1.13100, SL 1.27500, TP 1.14200

XAU/USD (Gold) H1 Breakout (29.04.2025)The XAU/USD Pair on the H1 timeframe presents a Potential Selling Opportunity due to a recent Formation of a Breakout Pattern. This suggests a shift in momentum towards the downside in the coming hours.
Possible Short Trade:
Entry: Consider Entering A Short Position around Trendline Of The Pattern.
Target Levels:
1st Support – 3158
2nd Support – 3025
🎁 Please hit the like button and
🎁 Leave a comment to support for My Post !
Your likes and comments are incredibly motivating and will encourage me to share more analysis with you.
Best Regards, KABHI_TA_TRADING
Thank you.

#ETH #ETHUSD #ETHUSDT #ETHEREUM #Wyckoff #Analysis #Eddy#ETH #ETHUSD #ETHUSDT #ETHEREUM #Wyckoff #Analysis #Eddy
This analysis is based on the analytical style of the Wyckoff Distribution Structure of Schematic #1.
I have outlined for you the important parts of the Wyckoff style on the one-hour timeframe.
Currently, we are in Phase C of the Wyckoff Distribution Structure.
We have to wait for the completion of this phase and the start of Phase D of the Wyckoff Distribution Structure.
When will this structure be fully confirmed? When the Ethereum price falls to the 1750 support and gathers the final spring when this support is broken for the fall, we will enter a short position by getting the necessary confirmations based on our style and strategy.
💬 Note: The best entry point for short positions will be the 1720_1750 support break. if the Ethereum price UTAD and test formed, high-risk traders who are willing to trade in the opposite direction can enter a short position by getting confirmation in the time frames below 15 minutes.
Where will the targets be? The first target is 1500 and the second target can be 1000 dollars. Maybe next targets is : 800_500 dollars.
When can you safely close the position and enter a reverse trade, that is, long or buy? When a Wyckoff accumulation structure is formed at one of the targets.
The responsibility for the trade is yours and I have no responsibility for your failure to comply with the risk and capital management.
Good luck and be profitable.
I also invite you to review and view my latest analysis on Bitcoin & TOTAL3 on my page.

btc. SHORT to LONGwe saw a nice price rotation downwards, following the idea of NY giving up the SFP on tuesday and started looking for lower prices themselves.
SHORT entry running ASIA high at 2pm
entry . 95146
tp1 . 93453 . +1.78%
the 1h SUPPORT LEVEL of ASIA . 92902
held SUPPORT during that down price rotation.
LONG IDEA
see a rotation to dOpen / cw0.5 / value area Low / micro SFP / 2pm
entry . 94000
tp1 . 96.972
at 1 step extension of cw

Fundamental Market Analysis for March 01, 2025 USDJPYThe USD/JPY pair is trading with small losses, hovering around the mid-143.00s after disappointing US economic growth data and weak Japanese economic reports caused a divergence in sentiment between the two currencies. The US economy contracted 0.3 per cent in the first quarter of 2025, the first contraction since 2022, missing growth expectations and highlighting the impact of rising imports and government spending cuts. At the same time, Japan released weaker-than-expected industrial production and retail sales data, limiting the yen's gains even as global risk appetite declined.
On the macroeconomic front, the US Bureau of Economic Analysis reported that real GDP contracted 0.3% in Q1, missing the market forecast for a 0.4% increase and slowing sharply from the 2.4% growth in Q4 2024. The contraction was primarily driven by a 41 per cent rise in imports and lower government spending. Meanwhile, core PCE inflation, the Fed's preferred measure of inflation, fell to 2.3 per cent year-on-year, in line with expectations and below February's 2.5 per cent. Other data showed a slowdown in job creation, with the ADP report showing just 62,000 new jobs in April against expectations of 108,000.
Despite the softer data, personal spending remained flat in March, rising 0.7%, while incomes rose 0.5%. However, market sentiment turned cautious, with the Dow Jones Industrial Average falling more than 200 points to stagnate around 40,300.
In Japan, the yen weakened 0.5% against the dollar as industrial production and retail sales data disappointed, highlighting the fragility of the domestic economy.
Trade recommendation: BUY 144.20, SL 144.00, TP 145.00

USD/JPY(20250430)Today's AnalysisMarket news:
The European Central Bank expects prices to rise 2.9% over the next 12 months, up from 2.6% in February, according to a monthly survey released on Tuesday. This is the highest level since April 2024. The three-year indicator rose slightly to 2.5%. The ECB's first five-year forecast was 2.1%.
Technical analysis:
Today's long-short boundary:
142.32
Support and resistance levels:
143.13
142.83
142.63
142.01
141.81
141.51
Trading strategy:
If the price breaks through 142.32, consider buying, the first target price is 143.00
If the price breaks through 142.01, consider selling, the first target price is 141.81

GOLD - Price can correct to support area and then bounce upHi guys, this is my overview for XAUUSD, feel free to check it and write your feedback in comments👊
A few moments ago price entered to rising channel, where it at once broke $2885 level and reached resistance line of channel.
Then it corrected and then continued to move up in channel, but later it dropped to support area.
Price soon rose above $2885 level, making a fake breakout and after retesting this level, continued to grow.
Later Gold reached resistance line of channel and then made correction movement, exiting from channel and entered to pennant.
In pennant pattern, price made upward impulse, breaking $3275 level and at the moment it trades near $3275 level.
I think that Gold can exit from pennant, decline to support area, and then bounce up to $3440
If this post is useful to you, you can support me with like/boost and advice in comments❤️

HelenP. I Gold can correct to trend line and continue to growHi folks today I'm prepared for you Gold analytics. After the recent drop and partial gap-fill, the price seems to be forming a solid foundation for a potential continuation to the upside. The price previously rebounded from the lower levels near 2955 and established a strong bullish trend, respecting the ascending trend line multiple times. Each touch acted as a signal for buyers to step in, pushing the price toward higher zones. Eventually, the market broke through a major resistance area, which has now turned into a support zone between 3265 and 3295 points. This area is also reinforced by the trend line, which has been tested again recently. Importantly, the price left a gap during the impulsive move up, and after the correction, the gap was filled, and buyers immediately reacted. Now, Gold is trading slightly above the support zone, showing a clear bounce from both the trend line and horizontal structure. This confluence increases the probability of further bullish momentum. Given the price behavior, market structure, and technical context, I expect that XAUUSD will continue rising toward the 3425 points, that’s why it is my current goal. If you like my analytics you may support me with your like/comment ❤️

HelenP. I Bitcoin can make correction to trend lineHi folks today I'm prepared for you Bitcoin analytics. The market behavior of price has been quite telling recently. After a significant rally from the lower support area around 81200 points, the price gradually established an ascending trend line, forming a steady bullish structure. The rise was confirmed multiple times by the trend line acting as dynamic support, allowing buyers to push the price toward the higher zones. However, after reaching the local peak close to 95300, the bullish momentum slowed down. Price formed a range and began showing early signs of weakness. Despite attempts to move higher, each push was met with resistance, causing smaller impulses than earlier moves. Currently, Bitcoin is trading just under the 95300 - 95500 zone, near the upper boundary of the recent range. I expect BTCUSDT can face further rejection here and initiate a correction. The nearest key target is the 92000 points, located close to the ascending trend line and matching the support structure below. Given the fading momentum, recent price action, and important technical levels nearby, I anticipate a downward move toward 92000 points. If you like my analytics you may support me with your like/comment ❤️

Euro may drop to 1.1200 points, exiting from pennant patternHello traders, I want share with you my opinion about Euro. Earlier, the price was growing steadily inside an upward pennant, following a strong breakout from the buyer zone. This impulse pushed the market higher toward the current support level at 1.1300, where the price found a temporary stabilization. Afterward, EUR moved into a range phase, trading sideways between local highs and lows. Despite several attempts to break higher, the market repeatedly showed weakness near the upper boundary, resulting in multiple turnarounds. Each bounce up was followed by lower highs, forming the descending resistance line of the pennant, while buyers defended the support area. Currently, the market is squeezed between the resistance and support lines, forming a classic compression pattern. Price action reveals increasing pressure on the support, and recent rebounds are becoming weaker, a clear sign of buyers losing momentum. In my view, the overall market situation has shifted from a strong bullish impulse toward a potential downside correction. So, given the breakdown structure forming and the price testing the lower side of the pennant multiple times, I expect a bearish breakout soon. My current TP1 is the 1.1200 points level. Please share this idea with your friends and click Boost 🚀

Bitcoin Testing 95k as resistance TRENDLINE #Bitcoin at a CRITICAL juncture! Testing the downward trendline (double yellow) at 95K as resistance, originating from 107K in Dec.
This trendline has repeatedly rejected BTC, with multiple tests at 95K this week. Historically, rejections have led to drops to 82K support (tested 4x) or even the uptrend line at 77K (Mar/early Apr).
If BTC fails to break & hold above 95K by week's close, we may retest 82K on the 2023 uptrend (red line). BUT, if we break 95K and hold, we could target 109K, with a potential range of 125K-140K for new highs!
#Crypto #BTC #TechnicalAnalysis

btc . month . outlookLONG worked out nicely, BUT there was no SFP liguidity grab at cw/cmHigh
- finished LONG trade with 10pm (+2h tz)
- price dropped below entry . out of LONG . looking for lower new entry
As we're just before a new monthly open, possibility for retrace during Month May enhances
- This would give a nice new SWING LONG entry
- As well as a nice SHORT entry to ride the rotation downwards
Tuesday gave up a couple of SUPPORT levels . got me to shift SHORT for wednesday
- scaling SHORT at fib + cw0.75
Invalidation:
Running stops at 92.750 and recovering above cw0.5

Gold Regains Momentum Key Trading Setups Ahead of Volatile Week📌 Gold Regains Momentum – Key Trading Setups Ahead of Volatile Week 🔥📊
📈 Technical Overview
Gold (XAU/USD) started the week with a strong recovery after last week’s sharp drop. Price is currently stabilizing near the major support zone around 3,274 – 3,292, forming a fresh consolidation range that could lead to a bullish continuation — if key support holds.
Last week’s weaker-than-expected US employment data weakened the Dollar Index (DXY), supporting a rebound in gold. However, the market remains cautious ahead of today’s ADP Non-Farm Employment release, which could serve as a directional catalyst.
So far, gold is trading sideways, with mild corrective pullbacks, waiting for clear confirmation from upcoming data.
🔍 Key Support & Resistance Levels
Resistance: 3,336 – 3,352 – 3,357 – 3,366
Support: 3,305 – 3,292 – 3,274
🎯 Trade Setups for Today
🔵 BUY ZONE
Entry: 3,274 – 3,276
SL: 3,270
TP: 3,284 → 3,291 → 3,301 → 3,336
📝 A deeper dip into the 3,274 area could offer another long opportunity, but confirmation is key before entering.
🔴 SELL ZONE 1
Entry: 3,350 – 3,352
SL: 3,356
TP: 3,346 → 3,342 → 3,338 → 3,334 → 3,330 → 3,320
📝 Watch for rejection near 3,350. If price fails to break above, this zone could offer a solid intraday short.
🔴 SELL ZONE 2
Entry: 3,366 – 3,368
SL: 3,372
TP: 3,362 → 3,358 → 3,354 → 3,350 → 3,345 → 3,340
📝 If price is unable to hold above 3,366 resistance, look for sell opportunities targeting a drop back to 3,350 and below.
⚠️ Important Notes
Today’s session may be volatile due to ADP Non-Farm Employment expectations.
Geopolitical tension in Asia may also impact gold, so remain alert to surprise headlines.
Apply strict SL/TP risk management as markets prepare for Friday’s NFP release.
✅ Conclusion
We’re entering a pivotal session where gold is testing key zones just ahead of critical employment data. Use tight stops and clear confirmations for all trades.
🚨 Trade with discipline — stay patient, and be prepared for volatility.
💬 What’s your setup for today’s gold session? Watching for a breakout or fading the highs? Drop your view below! 👇👇👇

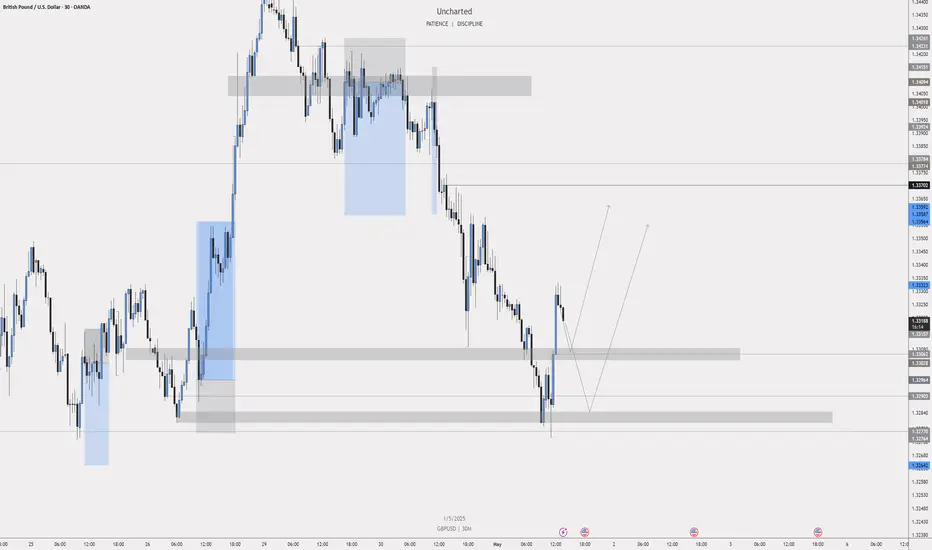
Fundamental Market Analysis for April 30, 2025 GBPUSDThe GBP/USD pair continues to fall for the second consecutive session, hovering near 1.3390 during Asian trading on Wednesday. The pair has been under pressure as the US dollar has strengthened amid renewed optimism over trade developments between the US and China. Traders are now turning their attention to the upcoming release of the March Personal Consumption Expenditure (PCE) price index, which is a key inflation gauge for the Federal Reserve.
The U.S. Dollar Index (DXY), which measures the dollar's exchange rate against six major currencies, remains above 99.00, suggesting U.S. Treasury yields are rising. The 2-year and 10-year US bond yields broke a four-day losing streak and were trading around 3.66 per cent and 4.17 per cent respectively at the time of writing.
On the data front, the JOLTS US job openings report released on Tuesday showed a decline in the number of open positions to 7.19 million in March - the lowest level since September 2024 - indicating a cooling in labour demand. The figure fell short of expectations and emphasised growing economic uncertainty.
Adding to GBP/USD's decline are rising expectations that the Bank of England (BoE) will cut rates at its May meeting. Lower inflation expectations in the United Kingdom (UK) and increasing global economic factors favour a rate hike.
Bank of England Governor Megan Green recently stated that tariffs proposed by US President Donald Trump could lead to lower inflation in the UK, although significant uncertainties remain over the broader economic impact and recent tax hikes for employers.
Trading recommendation: SELL 1.3390, SL 1.3420, TP 1.3300
