TA for FX,Indices and many More!(Week 17,28Apr25)Hello fellow traders , my regular and new friends!
Which pairs or instruments should we keep a look out for?
For me I am looking at :
potentially more pullback (down) on EURUSD and the majors.(stronger USD)
SNP might have a day or 2 of upside and pullback (chance for long on the change in daily trend)
Potential H&S on EurGbp and Gold.
BTC to see potential long if there's decent pullback.
NFP this week, BOJ interest rate release as well! Take note!
Do check out my recorded video for more insights!
Do Like and Boost if you have learnt something and enjoyed the content, thank you!
-- Get the right tools and an experienced Guide, you WILL navigate your way out of this "Dangerous Jungle"! --
Analysis

btc . w4 - wknd . SHORT but cautious - yet paytientfriday plan, was to SHORT (see prvs post)
sell zone
starts . friday open
ends . monday open
entry . 95.542
sl . -2.62%
10 sell orders . 1.52% spread
tp1 . 91.642 . +3.99%
funding . +0.01%
we are according to plan + collecting funding
tp1 adjusted to moderate, since bullish outlook coming from april.
tp2 . +10.11%

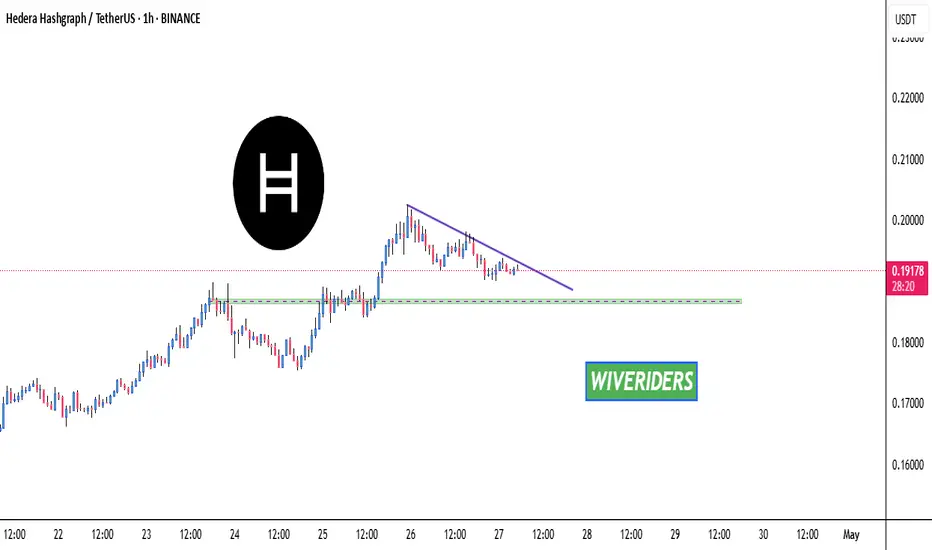
HBAR Approaching Green Support Level 🚨 HBAR Approaching Green Support Level 🚨
HBAR is nearing a significant green support level. This area could provide a potential bounce and a good entry point for a long position. Wait for confirmation of support before entering the trade.
📈 Technical Overview:
Support Level: Green zone.
Potential Entry: Long position upon confirmation of support at the green zone.
HelenP. I Bitcoin can rebound up from support zone to $96KHi folks today I'm prepared for you Bitcoin analytics. After breaking out of a prolonged sideways movement, the price entered a confident bullish phase that changed the market rhythm. This breakout came after the price consolidated for several days within the 83700 - 83000 support zone. During that period, the price formed a reliable foundation, and the trend line confirmed its strength, consistently holding the lower boundary of the structure. Once the price escaped this consolidation box, bulls quickly seized control, pushing BTC upward with strong momentum. The move took Bitcoin above the 94000 area, where it started to slow down and form a local peak. Now the price is pulling back, heading toward the nearest support zone between 92200 and 91600 points. This area matches Support 1 and historically acted as a zone of high buyer interest. Given the proximity of the trend line and the strength of this support zone, I expect that BTCUSDT will rebound after this correction. That's why I set my goal at 96000 points, a realistic target if the support holds and BTC resumes upward movement. If you like my analytics you may support me with your like/comment ❤️

GOLD - Price can continue to move up inside rising channelHi guys, this is my overview for XAUUSD, feel free to check it and write your feedback in comments👊
Long time price rising near the support line, but later it made a correction movement, breaking this line.
Then price had a sharp impulse that confirmed bullish structure and started to grow inside a rising channel.
After reaching the top boundary, the price reversed and started a pullback to the support area near $3265.
This zone also aligns with the channel base and acted as a bounce point before, making it a strong technical level.
Now the price is consolidating above this support, forming a higher low, which may confirm continuation.
As long as price holds, and I expect it to bounce from support line and push toward $3480 channel resistance.
If this post is useful to you, you can support me with like/boost and advice in comments❤️

BITCOIN AND ALT COIN ANALYSIS!I hope you guys enjoyed the video! If you have any questions or comments feel free to comment down below!

BTC/USDT Analysis: Approaching Resistance
Hello everyone! This is CryptoRobotics' trader-analyst with your daily market analysis.
Yesterday, Bitcoin tested our support zone at $92,000–$90,000 (strong buying imbalance) and immediately received a buyer reaction.
At the moment, we are very close to long-term resistance levels. The buying activity appears relatively weak, and cumulative delta continues to decline, indicating that sellers might be accumulating positions. In the near term, a correction from one of the identified sell zones is expected.
The buyer zone at $92,000–$90,000 remains active but has slightly shifted lower to $91,500–$90,000.
Sell Zones:
$95,000–$96,700 (accumulated volumes)
$97,500–$98,400 (aggressive pushing volumes)
$107,000–$109,000 (volume anomalies)
Buy Zones:
$91,500–$90,000 (strong buying imbalance)
$88,100–$87,000 (market sell absorption)
$85,500–$84,000 (accumulated volumes)
$82,700–$81,400 (high volume area)
Level at $74,800
$69,000–$60,600 (accumulated volumes)
Do you think we’ll see a correction, or will Bitcoin reach $100,000 first?
Share your thoughts in the comments — it’s always interesting to compare perspectives!
This publication does not constitute financial advice.

Gold Retreats After Trump Confirms China Talks 📌 Gold Retreats After Trump Confirms China Talks – Political Noise Drives Volatility 🧨📉
Gold (XAU/USD) saw a sharp intraday drop following comments from President Trump, who confirmed that trade talks with China are “ongoing” — despite China denying any official negotiations had taken place. The market interpreted this as a signal of de-escalation, prompting a short-term price correction.
Gold had previously rallied past $3,500/oz, supported by a weaker USD and strong demand from bargain hunters after last week’s sharp decline. However, the current political contradictions and tariff headlines are creating erratic moves across all asset classes.
🌍 Fundamental Context
The USD weakened, stocks lost momentum, and risk sentiment shifted after a confusing round of statements from the US and China.
Meanwhile, US jobless claims rose slightly, reflecting a resilient labour market amid tariff-related headwinds.
Today’s Core Retail Sales data in the US could add more volatility heading into the weekly candle close.
It’s Friday — expect possible liquidity sweeps and aggressive price spikes as the market prepares for weekend risk-off moves.
📊 Trading Outlook – 26 April
We're seeing signs of a tactical pullback, but long setups should be delayed until political headlines stabilise. Focus on intraday reaction zones — not aggressive positioning.
🔻 SELL ZONES
3384 – 3386
• SL: 3390
• TP: 3380 → 3376 → 3372 → 3368 → 3364 → 3360 → ???
3406 – 3408
• SL: 3412
• TP: 3400 → 3396 → 3392 → 3388 → 3384 → 3380 → 3370 → 3360
🟢 BUY ZONES
3288 – 3286
• SL: 3282
• TP: 3292 → 3296 → 3300 → 3304 → 3310
3270 – 3268
• SL: 3264
• TP: 3274 → 3278 → 3282 → 3286 → 3290
🛡️ Final Notes & Strategy
Avoid rushing BUY entries — allow Price to complete its corrective phase and wait for structure and confirmation.
Today’s Core Retail Sales (US) could trigger a fresh wave of volatility.
It’s also weekly close Friday, so prepare for potential false breaks and stop hunts.
✅ Stick to your TP/SL. Protect your capital first — clarity will come when the dust settles.
💬 Are you watching for a short-term bounce or planning to fade strength near resistance? Let us know in the comments below! 👇👇👇

HelenP. I Euro may decline to support zone and then start growHi folks today I'm prepared for you Euro analytics. After a prolonged sideways movement and an extended period of uncertainty, price has finally shifted gears. The pair, which had been trading inside a broad consolidation range, has recently demonstrated a clear bullish structure with strong upward momentum. The initial push started from the 1.0350 - 1.0400 support zone, where the price reacted several times, forming a solid base. From that point, bulls gradually gained control, leading to a breakout above both the upper consolidation boundary and the trend line. Following the breakout, the price surged through the next major support area around 1.0850 points, confirming the continuation of the bullish cycle. After this impulse, the Euro paused briefly around 1.1250 - 1.1300, establishing a new support zone before making another push higher. This new structure has now become a key area of interest, as price is currently testing it again from above. Now EUR is trading near 1.1330 points, within a tight consolidation that formed after touching the 1.1500 resistance. I expect that URUSD will undergo a temporary correction toward the support zone, followed by a continuation of the upward movement. My target remains at 1.1500, where the price may meet resistance once again. If you like my analytics you may support me with your like/comment ❤️

Euro may rebound from support line of wegde and continue growHello traders, I want share with you my opinion about Euro. For a while, price was consolidating in a flat range, bouncing between support near 1.0735 and resistance close to 1.0950 points. The price showed multiple rejections from the buyer zone, indicating strong interest from bulls around that area. Eventually, this led to a breakout to the upside, accompanied by a sharp impulse movement. After the breakout, the pair formed a steady upward wedge pattern, where both support and resistance lines were respected. This pattern helped channel the bullish pressure, allowing the price to gradually push higher while also offering clear correction zones. One of those zones, the support area, is particularly important. Price bounced off this area again recently, signaling that buyers are still in control. The market is currently recovering from a local correction and showing early signs of continued growth, as visible from the bounce off the wedge's support line and the area around the current support level. Given this structure, the breakout from range, the formation of the wedge, and the consistent support reaction, I expect the Euro may to continue its movement upward. So, that's why I set my TP at 1.1550 points. Please share this idea with your friends and click Boost 🚀

Gold can break support level and continue to declineHello traders, I want share with you my opinion about Gold. For a while, Gold was confidently moving within an upward channel, with each impulse supported by rebounds from the lower boundary. After breaking out of the buyer zone, the price made a strong bullish move, supported by momentum and healthy corrections. This movement continued up to the current support level at 3285, where the price began to stall. Then, a classic Head and Shoulders pattern has now fully formed. The left shoulder, head, and right shoulder are all visible and aligned with the support area, which now acts as the neckline of the pattern. This isn't random, it's a well-defined reversal signal forming after an extended bullish leg. The rejection from the right shoulder shows evident seller control, and the price is now testing the neckline from below. The support area has already been broken once, and any bounce from here appears corrective rather than impulsive. Given this setup, I expect that price can fully breakdown toward the 3060 level, which acts as both a strong historical support and my TP1. Please share this idea with your friends and click Boost 🚀

USD/JPY(20250425)Today's AnalysisMarket news:
Federal Reserve-①Hamack: If economic data is clear, the Fed may cut interest rates in June
②Waller: It will take until July to get a clearer understanding of how tariffs affect the economy. If tariffs lead to higher unemployment, interest rate cuts may be initiated. ③The Atlanta Fed GDPNow model predicts that the US GDP growth rate in the first quarter will be -2.5%. ④Kashkari: The frequent announcements from Washington have brought challenges to policymakers and everyone.
Technical analysis:
Today's buying and selling boundaries:
142.79
Support and resistance levels:
143.94
143.51
143.23
142.34
142.06
141.63
Trading strategy:
If the price breaks through 142.79, consider buying, the first target price is 143.23
If the price breaks through 142.34, consider selling, the first target price is 142.06

EURO - Price can correct to support area and then bounce upHi guys, this is my overview for EURUSD, feel free to check it and write your feedback in comments👊
After consolidating in a broad range for several weeks, Euro made a strong breakout and entered an ascending channel.
The price respected this pattern twice, forming clear support and resistance touches, and confirming trend direction.
Most recently, the Euro surged and reached the upper boundary of the new rising channel, but quickly pulled back.
Currently, it’s testing the $1.1380 support area, which also aligns with the channel base, creating a confluence zone.
Given this context, I anticipate a bounce from this support and continuation of bullish structure toward $1.1670
This level represents the channel top and may act as the next key resistance zone.
If this post is useful to you, you can support me with like/boost and advice in comments❤️

9 Simple Ratios Every Great Investor Uses - Buffett Included!Forget the hype, headlines, or hope. These 9 financial ratios are what real investors actually use to pick winners, but...
P/E? ROE? EPS? 🧐
- What are they, or better yet, WHO are they? 🤯
- How high is “too high”?
- Is a low number always good, or just a trap?
- Do all industries follow the same rules… or is that another myth?
Buffett. Greenblatt. Graham. Lynch.
They didn’t rely on vibes — they trusted fundamentals
After years of relying on charts, I built a 9-point fundamentals checklist to filter stocks faster and smarter. Now I’m sharing it with real-life examples and key insights to help you spot what really makes a stock worth owning:
Easy enough for new investors diving into fundamentals
Sharp enough to level up seasoned pros
Real enough to avoid hype
…but the truth is: these numbers did flag companies like Amazon, Apple, and Nvidia before the market gave them credit.
-----------------------------------------------------
✅ Quick Reference Table
Scan the table, then dive into the stories…
First Pro Tip: Bookmark this. You’ll check these before every stock pick.
-----------------------------------------------------
📊 1. P/E Ratio | Price-to-Earnings
What it tells you: How much you pay for each dollar of a company’s profit.
Short Example: A P/E of 20 means you pay $20 for $1 of profit. High P/E? Expect big growth or risk overpaying.
Strong: Between 15 and 25
Caution: Above 30 (unless fast growth)
Industry Averages:
- Tech: 25–40
- Utilities: 10–15
- Consumer Staples: 15–20
- Energy: 10–20
- Healthcare: 20–30
Story: In early 2023, NVIDIA’s P/E ratio hovered around 25, near the low end for tech stocks. Investors who saw this as a steal amid the AI boom were rewarded—NVIDIA’s stock made 4x by the end of 2024 as AI chip demand soared.
Contrast that with Tesla in Q1 2025, when its P/E spiked above 40 with slowing sales and Tesla’s stock dropped 50% in weeks.
Pro tip: A low P/E is not always good. If growth is weak or falling, it's often a trap.
Example: A utility company with a P/E of 30 is probably overpriced. A tech stock with 35 might still be fair — if growth justifies it.
-----------------------------------------------------
🧠 2. PEG Ratio | Price-to-Earnings-to-Growth
What it tells you: If a high P/E is worth it based on future profit growth. Whether the earnings growth justifies the price.
Short Example: A PEG below 1 means you’re getting growth at a fair price. High PEG? You’re overpaying.
Strong: Below 1
Caution: Above 2
Industry Averages:
- Software: below 1.5 is solid
- Consumer Goods: Below 2 is more realistic
- Tech: Below 1
- Consumer Staples: Below 1.5
- Healthcare: Below 1.2
- Financials: Below 1.5
- Energy: Below 1.3
Story: In mid-2022, Salesforce’s PEG was 0.8 (P/E 35, forward EPS growth 45%) as cloud demand surged. Investors who spotted this steal saw the stock climb 130% by the end of 2024. Meanwhile, Peloton in 2023 had a P/E of 20 but near-zero growth (PEG above 3). Its stock cratered -50% as fitness trends faded.
Story: NVIDIA’s PEG hit 0.9 in Q3 2023 (P/E 30, growth 35%) during AI hype, a steal for tech (average PEG below 1.2).
PEG filters hype. A stock can look expensive until you factor in growth.
-----------------------------------------------------
🧱 3. P/B Ratio | Price-to-Book
What it tells you: How much you pay compared to what the company owns (like buildings or cash).
Short Example: A P/B below 1.5 means you’re paying close to the company’s asset value. High P/B? Expect strong profits or risk.
Strong: Below 1.5
Caution: Below 1 + poor earnings = value trap
Industry Averages:
- Banks: Below 1.5
- Insurance: Below 1.3
- REITs: Use NAV (aim below 1.2)
- Tech: Often ignored
- Energy: Below 2
Story: In 2024, JPMorgan Chase’s P/B was 1.4, solid for banks (average below 1.5). Investors who bought enjoyed 100% gains.
n 2023, Bed Bath & Beyond’s P/B fell below 1 with collapsing earnings. It looked cheap but filed for bankruptcy that year.
Tip: Only use this in asset-heavy sectors like banking or real estate.
-----------------------------------------------------
⚙️ 4. ROE | Return on Equity
What it tells you: How well a company turns investor money into profits.
Short Example: An ROE above 15% means the company makes good money from your investment. Low ROE? Weak returns.
Strong: Above 15%
Caution: Below 10% unless in slow-growth industries
Industry Averages:
- Tech: 20–30%
- Consumer Staples: 15–25%
- Utilities: 8–12%
- Financials: 10–15%
- Healthcare: 15–20%
Story: Coca-Cola (KO) has kept ROE above 35% for years, a sign of brand power and pricing strength.
Eli Lilly’s (LLY) ROE stayed above 25% from 2022–2024, a healthcare leader (average 15–20%). Its weight-loss drug Mounjaro drove consistent profits, lifting the stock 150%+ in two years. Checking ROE trends helped investors spot this winner.
Tip: If ROE is high but D/E is also high, be careful, it might just be leverage.
-----------------------------------------------------
💰 5. Net Margin | Profitability
What it tells you: How much profit a company keeps from its sales or what % of revenue ends up as pure profit.
Short Example: A 10% margin means $10 profit per $100 in sales. Low margin? Tough business or high costs.
Strong: Above 10-15%+
Caution: Below 5%
Industry Averages:
- Software: 20–30%
- Retail: 2–5%
- Manufacturing: 8–12%
- Consumer Staples: 10–15%
- Energy: 5–10%
- Healthcare: 8–15%
Story: Walmart’s (WMT) 2% net margin looks tiny — but it’s expected in retail.
A software firm with 5%? That’s a warning — high costs or weak pricing.
In 2023, Zoom’s (ZM) net margin fell to 5% (down from 25% in 2021), well below software’s 20–30% average. Pricing pressure and competition crushed its stock quite a lot. Meanwhile, Apple’s 25% margin in 2024 (tech average 20%) remained a cash cow.
Tip: Margins show whether the company owns its pricing or competes on price.
-----------------------------------------------------
💣 6. D/E Ratio | Debt-to-Equity
What it tells you: How much debt a company uses compared to investor money.
Short Example: A D/E below 1 means more investor cash than debt. High D/E? Risky if profits dip.
Strong: Below 1
Caution: Above 2 (except REITs or utilities)
Industry Averages:
- Tech: 0–0.5
- Industrials: 0.5–1.5
- REITs: 1.5–2.5 (manageable due to structure)
- Utilities: 1–2
- Energy: 0.5–1.5
Story: In 2024, Tesla’s D/E dropped below 0.3 (tech average 0–0.5) as it paid down debt, signaling strength despite sales dips - a massive rally afterward.
Tip: Rising debt + falling profits = a storm coming. Always check both.
-----------------------------------------------------
💵 7. Free Cash Flow (FCF)
What it tells you: Cash left after paying for operations and growth investments.
Short Example: Apple’s $100 billion cash pile in 2024 funded stock buybacks, boosting shares. Low cash? Trouble looms.
Strong: Positive and growing
Caution: Negative for multiple years
Sector notes:
- Tech: Lots of cash (think billions)
- Industrials: Up and down, check trends
- REITs: Look at FFO (cash from properties), aim high
- Energy: Has cash, but swings with oil prices
- Healthcare: Steady cash, not too high
Story: Netflix had negative FCF while scaling content. Once costs stabilized, FCF turned positive and stock re-rated sharply.
Pro tip: Profits don’t mean much without real cash. FCF is often more honest.
Cash is king: Companies need cash to pay bills, reduce debt, or fund growth. If FCF is falling, they might be burning through cash reserves or borrowing, which isn’t sustainable.
Potential issues : This mismatch could signal problems like poor cash collection, heavy spending, or even accounting tricks to inflate profits.
-----------------------------------------------------
🚀 8. EPS Growth | Earnings Power
What it tells you: How fast a company’s profits per share are growing.
Short Example: EPS up 10% yearly means more profit per share, lifting stock prices. Flat EPS? No growth, no gains.
Strong: Above 10%
Caution: Below 5%, flat/negative for 3+ years
Industry Averages:
- Tech: 15–30%
- Staples: 5–10%
- REITs: 3–6% (via FFO growth)
- Healthcare: 10–15%
- Financials: 5–10%
- Energy: 5–15% (cyclical)
Story: In Q1 2024, NVIDIA’s forward EPS growth of 30% (tech average 20%+) fueled a rally as AI chips dominated. Checking forward estimates helped investors avoid traps like Intel, with flat EPS and a drop.
Pro tip: A stock with flat EPS and no dividend? There’s no reason to own it.
-----------------------------------------------------
💵 9. Dividend Yield | Passive Income
What it tells you: How much cash you get yearly from dividends per dollar invested.
Short Example: A 3% yield means $3 per $100 invested. High yield? Check if it’s sustainable.
Good: ~3–4%
Red Flag: Above 6% with a payout ratio above 80-90%
Industry Averages:
- Utilities: 3–5%
- REITs: 3–6%
- Consumer Staples: 2–4%
- Tech: 0–2%
- Energy: 2–5%
-----------------------------------------------------
💡 Final Thought: How to Use All of This
Top investors don’t use just one metric. They look at the whole picture:
Good growth? Check PEG.
Good profits? Confirm with ROE and margin.
Safe balance sheet? Look at D/E and cash flow.
Fair valuation? P/E + FCF Yield + P/B.
Real power = Combining metrics.
A company with P/E 15, PEG 0.8, ROE 20%, low debt, and positive FCF? That’s your winner.
A stock with P/E 8, but no growth, high debt, and negative cash flow? That’s a trap.
-----------------------------------------------------
Real-World Combos
🎯Winners:
Tech Gem: P/E 20, PEG 0.8, ROE 25%, D/E 0.4, growing FCF, EPS 20%+ (e.g., NVIDIA 2023: AI-driven growth, stock soared).
Energy Steal: P/E 15, P/B 1.5, FCF positive, Dividend Yield 3.5% (e.g., Chevron 2023: Cash flow king).
⚠️Traps:
Value Trap: P/E 8, flat EPS, D/E 2.5, negative FCF (e.g., Peloton 2023).
Overhyped Tech: P/E 50, PEG 3, Net Margin 5%, D/E 1.5 (e.g., Rivian 2024).
-----------------------------------------------------
🚀 Share your own combos!
What do you personally look for when picking a stock?
If you spotted something off in the numbers, or have a valuable insight to add — please, drop it in the comments.👇
💡 Let’s turn this into a thread that’s not just good but superb and genuinely helpful for everyone.
-----------------------------------------------------
Final Thought
“Buy great companies at fair prices, not fair companies at great prices.” – Warren Buffett
This guide gives you the map.
Charts, tell you when.
These numbers tell you what, and why.
And this post?
It’s just the beginning!
These 9 metrics are part one of a bigger series I’m building — where we’ll go even deeper, with more advanced ratios, smarter combos, and real case studies.
If this guide helped you see financial numbers a little clearer, there’s a good chance it’ll help your investor friend too, especially if they’re just starting their journey...🤝Share it with them!
I built this as much for myself as for anyone else who wants to get better.👊
If you made it this far — thank you! 🙏
...and super thankful if you hit "The Boost" on this post 🚀
Cheers,
Vaido

btc . w4 . fancy SHORTthe 'OTF - one time frame' Break of the monthly is still due.
There was no chance for LONGS during the week for retail buyers, only late buyers.
We've traded 2 days just under resistance, accumulating:
- late LONGS
- early SHORTS
I'm willing to SHORT now on friday, once the OTF has been hit.
Scalling in from cwHigh upwards
Invalidation would be to keep pumping and then potentialy SFP on monday for downside.
R:R is alright! I like to give myself a 3% invalidation range till SL.

GBP Rebounds on Retail Sales – But USD Still in Control📌 GBP Bounces on Strong Retail Sales, But USD Strength Keeps Pressure On 💷📉
The British Pound (GBP) rebounded on Friday after UK Retail Sales data surprised to the upside. According to the Office for National Statistics (ONS), retail sales rose by 0.4% in March, beating expectations of a -0.4% decline. On a yearly basis, growth accelerated to 2.6%, outpacing the forecast of 1.8%.
However, despite the positive data, traders remain confident the Bank of England (BoE) may still cut interest rates by 25 bps to 4.25% in the May meeting, due to persistent global uncertainties and softer inflation expectations.
Meanwhile, the US Dollar (USD) gained ground across the board as trade tensions between the US and China appeared to ease. Durable Goods Orders in the US jumped by 9.2% in March — a clear sign of business confidence and policy impact.
📊 Technical Outlook – GBP/USD
GBP/USD briefly recovered from an intraday low of 1.3280 but remains under pressure near key resistance.
On the upside, the psychological barrier at 1.3500 remains a major hurdle.
To the downside, the April 3rd high around 1.3200 now acts as strong support.
💼 Trading Plan
🟢 BUY ZONE:
Entry: 1.32500
SL: 1.32000
TP: 1.33300
🔴 SELL ZONE:
Entry: 1.34180
SL: 1.34700
TP: 1.33500
📌 Stay alert ahead of key BoE guidance and further US-China headlines — volatility may increase as we head into May.

AUDNZD BULLISH OR BEARISH DETAILED ANALYSISAUDNZD has finally broken out of a well-formed falling wedge pattern on the 12H timeframe, signaling a potential bullish reversal. After a sustained downtrend, price consolidated within the wedge, indicating decreasing bearish momentum. The recent breakout confirms buyer strength and opens the door for a fresh upside swing. The current price sits around 1.072, and based on technical structure and projected pattern targets, we could be heading towards the 1.105 zone.
From a fundamental standpoint, the Australian Dollar is gaining support due to rising commodity demand and hawkish tones from the RBA, hinting at a possibility of sustained higher interest rates. On the other hand, the New Zealand Dollar has been under pressure due to softer-than-expected CPI data and growing speculation that the RBNZ might be done with its tightening cycle. This divergence in central bank stance adds fuel to the AUDNZD bullish narrative. Today’s macro releases show stable Australian employment data and a dip in New Zealand’s retail figures, which further supports the bullish view.
This setup offers a solid risk-to-reward ratio, especially with a clean invalidation below 1.062. If the momentum sustains, price may accelerate quickly toward the 1.105 target. Market participants should also keep an eye on DXY (US Dollar Index) correlations and global risk sentiment, which could amplify volatility across AUD and NZD pairs.
As a professional trader, I’ll be monitoring price action closely near lower timeframes for confirmation entries and managing the trade with dynamic stop-loss adjustments. This breakout is technically clean, fundamentally supported, and strategically aligned with the current macro backdrop – making it a high-probability swing setup worth sharing.

Fundamental Market Analysis for April 25, 2025 GBPUSDAn event to watch out for today:
11:00 EET. CHF - The head of the SNB Martin Schlegel will deliver a speech
GBPUSD:
The GBP/USD pair is pulling back from its recent gains, hovering around 1.3290 during the Asian session on Friday. The pullback comes amid a strengthening US Dollar (USD), helped by a Bloomberg report that China may suspend a 125% tariff on some US imports, including medical equipment, ethane and aircraft leasing.
Sources familiar with the matter said officials are particularly scrutinising the possibility of removing tariffs on aircraft leasing. China's Ministry of Finance and General Administration of Customs have not yet commented. Further support for the dollar comes from optimism around trade talks with the US. Reuters reports progress in preliminary talks with key Asian allies, including South Korea and Japan.
The US Dollar Index (DXY), which tracks the dollar against six major currencies, is recovering previous losses and is trading near 99.80. However, the dollar faced headwinds after mixed labour market data. The US Department of Labour reported that initial jobless claims rose to 222,000 for the week ended April 19, slightly above expectations, while jobless claims fell 37,000 to 1.841 million for the week ended April 12.
In the United Kingdom (UK), the GfK consumer confidence index fell to -23 in April - its lowest level since November 2023 - amid rising living costs and growing concerns about global trade, missing forecasts of -22. Traders now await UK retail sales data and a final reading of the US consumer sentiment index from Michigan later in the North American session.
Trading recommendation: SELL 1.3270, SL 1.3300, TP 1.3170

USDJPY Buy UpdateUSDJPY Buyers stepping in fully...
Analyzing the information from what the yearly candle printed a strong buy is building up at these level

Lighten Up! After a rounding bottom where it looked as though the bulls were forming a base, we now see a long bearish red candle hinting at the bears denying a bullish breakout. I wouldn't close positions here, but I would lighten up on longs. Follow me for more simple to understand expert analysis. Thank you for reading. Now get out there and trade! :)

"XAU/USD at Crucial Support Zone"📈 Chart Overview
Instrument: Likely XAU/USD (Gold vs USD)
Date: April 22, 2025
Timeframe: Appears to be a short-term chart (possibly 1H or 4H)
🧠 Key Technical Elements
1. Exponential Moving Averages (EMAs)
50 EMA (Red): Currently at 3,406.818 — acting as short-term dynamic support/resistance.
200 EMA (Blue): Currently at 3,277.286 — indicating long-term trend direction.
The price is well above the 200 EMA, indicating a bullish long-term trend. However, it’s now testing the 50 EMA, suggesting a potential short-term inflection point.
2. Support and Resistance Zones
Immediate Resistance Zone: Around 3,430 – 3,440, which price recently rejected.
Key Support Zone: Around 3,385 – 3,390 (labeled “FOCUS ON THIS POINT”), which aligns closely with the 50 EMA.
Lower Support Zones:
3,310 – 3,320
3,240 – 3,260
🔍 Technical Scenarios Outlined on Chart
✅ Bullish Scenario (Upper Arrow Path)
If the price holds above the 3,385 support zone, especially with support from the 50 EMA:
We may see a bounce back to test and potentially break above the 3,430 resistance.
This would confirm a continuation of the uptrend.
⚠️ Bearish Scenario (Lower Arrow Path)
If the price fails to hold above 3,385:
A breakdown may lead to a drop toward 3,320, with possible continuation toward 3,240.
This would indicate a short-term bearish correction within a longer bullish trend.
🔑 Critical Price Level
Focus on the 3,385 zone — This is a confluence area where:
Horizontal support meets
50 EMA is located
A potential decision point for bulls vs. bears
🧭 Trading Strategy Considerations
For Bulls:
Look for bullish candlestick formations or volume confirmation near the 3,385 level.
Target a retest of the 3,430+ area with stops below 3,375.
For Bears:
Watch for strong bearish breakdown below 3,385.
First target: 3,320, second: 3,240, with stop-loss above 3,400.
📌 Conclusion
The chart illustrates a key inflection point. Price is at a decision zone — hold and bounce = continuation of bullish momentum, break = short-term correction. All eyes on how price reacts at the 50 EMA and support zone near 3,385.

BTC Approaches Breakout Zone in Ascending Triangle – Key Resist,📈 Chart Overview
Instrument: BTC/USD
Timeframe: Likely 4H or Daily
Indicators Used:
EMA 50 (Red) – 84,924.30
EMA 200 (Blue) – 85,558.47
🔍 Key Technical Observations
1. Ascending Triangle Formation
The chart shows a clear ascending triangle, a bullish continuation pattern.
Flat resistance zone: Around $88,700–$89,000.
Higher lows forming a solid upward sloping trendline, suggesting increasing buying pressure.
2. Price Above Key EMAs
Current price: $88,779.43, which is above both the 50 EMA and 200 EMA.
This indicates bullish momentum as price breaks above dynamic resistance levels.
3. Volume Consideration (Missing)
While volume is not visible on the chart, an ideal breakout from an ascending triangle should be accompanied by increasing volume to confirm validity.
🔄 Possible Scenarios
✅ Bullish Breakout
A confirmed breakout above $89,000 with strong volume can lead to a measured move toward:
Target = Triangle height ≈ $13,000 → Potential target: $101,500 – $102,000
Next resistance levels to watch: $92,000, $95,000, and $100,000 psychological zone.
❌ Fakeout or Rejection
If BTC gets rejected at resistance, watch for:
Retest of support trendline (~$86,000).
EMA 50 and 200 as dynamic support around $84,900–$85,500.
Breakdown below the trendline may signal a short-term correction to $80,000–$82,500.
📊 Conclusion
BTC is at a crucial decision point. The ascending triangle suggests bullish potential, but a breakout confirmation is essential. Price is above both major EMAs, signaling strength, but a rejection from resistance could invite short-term bears.

Bearish Reversal in Play! | Key EMA Rejection & Support Targets🔍 Chart Analysis Summary
🕐 Timeframe: Likely a short-term (H1 or H4) chart.
📈 Asset: Most probably XAU/USD (Gold) or a similar asset.
🔴 Trend Breakdown
📍 Previous Trend:
✅ Strong bullish momentum 📈 pushing price into a resistance zone.
📍 Current Price Action:
🚨 Bearish rejection from resistance 🟥
Price got rejected exactly at the resistance zone (gray box) and the EMA 50 line 🔴 — a classic setup for a reversal ⚠️
📉 Key Technical Levels
🟦 Resistance Zone:
🔹 Between 3,385 – 3,400 USD
🧱 This zone rejected price strongly (see red candles)
📌 Also aligned with EMA 50 (3,400.837) — confluence adds strength 💪
🟩 Support Zones:
First Support Zone – ~3,285 📉
💙 In line with the EMA 200 (3,285.687)
🛡️ Might cause a temporary bounce 📈
Second Support Zone – ~3,240
📉 Marked as the deeper support in the bear case 🕳️
💥 If the first support breaks, this becomes the next target 🎯
📊 Indicator Insights
EMA 50 (🔴 Red): 3,400.837 – acting as dynamic resistance 😤
EMA 200 (🔵 Blue): 3,285.687 – acting as dynamic support 🛡️
📉 Price breaking below EMA 50 = first bearish sign
📉 Approaching EMA 200 = watch for either a bounce 🏀 or a breakdown 💥
🎯 Bearish Setup Forecast
📉 Here's what the arrows show (strategy logic):
📉 Breakdown below resistance → strong bearish move
🎯 Target 1: First support (EMA 200 / ~3,285)
🔄 Minor pullback possible (fake bounce 🪃)
💣 Continuation lower toward next support (~3,240)
📌 Critical Zone to Watch 🔍
⚫️ The circle marked “FOCUS ON THIS POINT” is key:
📌 Failed retest = confirmation of resistance
📌 Price rejected this level + closed below = strong bearish signal 🚨
🧠 Professional Insights
Element Observation Emoji
Trend Shift Bullish ➡️ Bearish reversal 🔄📉
Momentum Bearish pressure increasing 💨🟥
Risk Point Resistance near EMA 50 ⚠️🧱
Trade Idea Short toward supports 📉🎯
Confirmation Rejection candle after retest 🕯️🔁
Focus Level EMA confluence near resistance 🎯📌
🛠️ Possible Trade Plan (for educational purposes only)
Short Entry: Below 3,385 (after rejection 🔻)
Stop-Loss: Above 3,405 (above EMA 50 🛑)
Target 1: 3,285 🧲
Target 2: 3,240 📉
