AT&T I Tipping Point : Short Opportunity with Head & ShouldersHey traders after a previous trade trade on the hood hitting targets of 16.4%. Today I bring you NYSE:T
Technical + Fundamental View
Pro Tip
- Breakdown below the Entry Line will be considered at Trade Initiation. (Risky Traders)
R:R= 5.4
- Rest can follow entry at day close post breakdown SL above Entry Candle.
- The Breakdown Below the Entry Line will confirm the head and shoulder pattern
Entry Line - 26.93
Stoploss - 27.53
Target 1 - 25.59 (Neckline of head and shoulder)
Target 2 - 24.74
Target 3 - 23.68
Technical View
- Head And Shoulder on Daily Time frame
- On the hourly timeframe, the chart looks weak, showing a potential double top pattern where the second peak is lower than the first, indicating growing investor fear.
Fundamental View
- High Debt: Over $140 billion in debt limits investment capacity and consumes significant cash flow.
- Network Issues: Poor service quality and outages risk losing customers to competitors.
- Strong Competition : T-Mobile and Verizon offer better plans, making customer retention harder.
- Market Saturation: The U.S. wireless market is nearly saturated, limiting new customer growth.
- Execution Risks: Growth and debt reduction depend on flawless asset sales and network upgrades; delays could harm finances and stock performance.
Additional Considerations
- AT&T’s valuation is higher than some peers, potentially capping upside.
- Telecom market competitiveness means growth hinges on successful 5G and fiber rollouts.
- Dividend yield (~3.9%) is attractive but lower than some rivals, which may impact income investors.
Analysis

Gold – Watching Key Resistance for Intraday Sell Plays📌 Gold Surges $80 off Support – Watching Key Resistance for Intraday Sell Plays 📉📈
Gold (XAU/USD) bounced sharply today — surging over 80 points from the support zone near $3,260, swept during the late U.S. session. This strong rebound came as buyers stepped in aggressively after a 250+ point crash earlier in the week.
Now, the market is pulling back from the 0.382 Fibonacci retracement zone, showing early signs of sell-side reaction. If this momentum continues, Asian and London sessions could push price lower to fill liquidity in the untested FVG region near 3,288.
🔁 Intraday Structure & Key Zones
After sweeping both sides of the range (80 up / 40 down), gold is now consolidating between 3,328 – 3,320. With intraday volatility ranging from 80–100 points, today’s focus will be on high-probability reaction zones.
🔴 SELL Bias for Today
Primary Resistance: 3,376 – 3,378
→ This zone is expected to act as the first defense for sellers.
If broken, watch the final resistance at 3,410 — a key structural level.
→ A clean breakout above 3,410 may invalidate the sell setup and shift the bias back to BUY.
🔍 News to Watch
⚠️ Unemployment Claims (U.S.) will be released during the New York session.
→ Given current market sensitivity, expect volatility to spike around this release.
🧭 Today’s Trading Zones
🟢 BUY ZONE
Entry: 3,230 – 3,228
SL: 3,224
TP Targets: 3,234 → 3,238 → 3,242 → 3,246 → 3,250 → 3,254 → 3,260
🔻 SELL ZONE #1
Entry: 3,376 – 3,378
SL: 3,382
TP Targets: 3,372 → 3,368 → 3,364 → 3,360 → 3,355 → 3,350
🔻 SELL ZONE #2
Entry: 3,408 – 3,410
SL: 3,414
TP Targets: 3,402 → 3,398 → 3,394 → 3,390 → 3,386 → 3,382 → 3,375 → 3,370
🛡️ Risk Management Note
The market remains extremely volatile and headline-driven. Stick to your trading plan and always respect TP/SL levels to protect your capital — especially during high-impact news releases.
💬 Are you planning to sell into resistance or wait for a deeper pullback to buy? Share your setups and ideas below! 👇👇👇

Fundamental Market Analysis for April 24, 2025 EURUSDEvent to watch out for today:
15:30 EET. USD - Number of Initial Jobless Claims in the U.S.
EURUSD:
EUR/USD rises towards the 1.1335 level during the early Asian session on Thursday. Easing concerns over potential tariff threats from US President Donald Trump are putting some pressure on the US Dollar (USD).
According to the Federal Reserve's (Fed) Beige Book report released on Wednesday, businesses facing the early stages of Trump's tariffs are looking for ways to pass on rising costs to consumers. Companies have reported receiving warnings from suppliers about price increases and are looking for ways not to absorb those increases, noting uncertainty about whether they can pass them on to customers.
Earlier this month, Trump imposed a basic import tax of 10 per cent or more on dozens of countries, but then unexpectedly suspended the taxes for 90 days to give countries a chance to negotiate lower rates. Nevertheless, trade policy uncertainty and concerns over slowing economic growth in the US could drive the dollar lower and create a tailwind for EUR/USD.
Last week, the European Central Bank (ECB) cut its main interest rate by a quarter of a percentage point to 2.25% at its April meeting. During a press conference, ECB President Christine Lagarde said that the US tariffs on EU goods, which have increased from an average of 3% to 13%, are already hurting the prospects of the European economy.
Trading recommendation: BUY 1.1350, SL 1.1320, TP 1.1430

Gold Drops $200 in Hours – Panic or Opportunity? 📌 Gold Plunges $200 – Volatility Surges Amid Fed Signals and Market Panic 🔥📉
📰 What Just Happened?
Yesterday, gold (XAU/USD) experienced one of its sharpest intraday drops in recent months, tumbling from the all-time high around $3,500 to as low as $3,318, losing nearly $200 in just a few hours.
This marked a significant correction following an extended bullish trend.
🔍 Key Drivers Behind the Crash
Fed-related commentary spurred aggressive profit-taking across the market.
The USD staged a technical rebound, exerting downward pressure on gold.
Rapid sentiment shifts triggered panic selling and liquidation flows.
🧭 What’s Next for Gold?
The $3,300–3,320 zone is now a crucial support — if this level holds, a technical recovery could unfold.
However, a break below $3,300 may expose gold to deeper downside targets near $3,250.
⚠️ Strategic Considerations
This is a high-volatility environment — flexibility and strict risk management are key.
Current sentiment is fragile. Unpredictable political headlines and mixed Fed signals are adding to the uncertainty.
In the latest development, Trump clarified he has no intention to fire the Fed Chair and hinted that China’s tariffs could be eased slightly — but not eliminated. These mixed messages continue to create sharp swings in price.
📊 Trade Plan
🔻 SELL ZONE #1:
Entry: 3,378 – 3,380
Stop Loss: 3,384
Take Profits: 3,374 → 3,370 → 3,366 → 3,362 → 3,358 → 3,350
🔻 SELL ZONE #2:
Entry: 3,408 – 3,410
Stop Loss: 3,414
Take Profits: 3,404 → 3,400 → 3,396 → 3,392 → 3,386 → 3,380
🟢 BUY ZONE:
Entry: 3,292 – 3,290
Stop Loss: 3,286
Take Profits: 3,296 → 3,300 → 3,304 → 3,308 → 3,312 → 3,316 → 3,320
The priority remains to sell into rallies near resistance while the downtrend unfolds. All trades should be protected with tight stop-losses, given the current unpredictability.
🧠 Key Takeaways
This is not a market for guessing — wait for price confirmation at key zones.
Focus on reaction zones, not forecasts.
Stay light, stay nimble, and manage risk carefully — news-driven volatility is at its peak.
💬 How are you positioning in this volatile gold market? Waiting for the bounce or selling the rallies? Let us know below! 👇👇👇

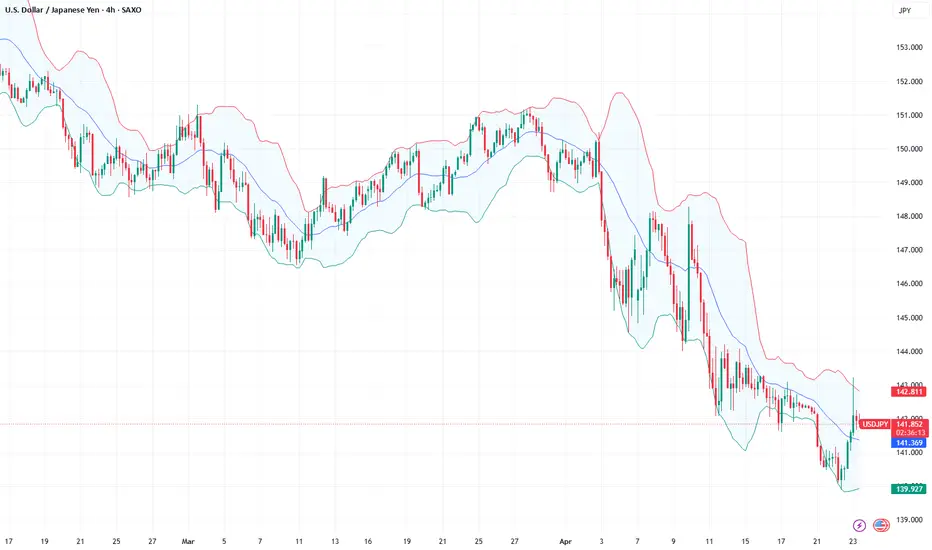
USD/JPY(20250424)Today's AnalysisMarket News:
The United States hit a 16-month low in April. The total number of new home sales in the United States in March was an annualized to a new high since September 2024.
Technical analysis:
Today's buying and selling boundaries:
142.82
Support and resistance levels:
144.93
144.14
143.63
142.01
141.50
140.71
Trading strategy:
If the price breaks through 143.63, consider buying, the first target price is 144.14
If the price breaks through 142.82, consider selling, the first target price is 142.01

HelenP. I Gold may continue fall to support zoneHi folks today I'm prepared for you Gold analytics. After a strong bullish impulse, the price of Gold reached a local peak and started to reverse. Before that, the uptrend was developing within a clearly defined ascending channel, where the trend line acted as dynamic support multiple times. Each time the price touched this line, it rebounded and continued climbing higher. However, the most recent upward movement ended with a sharp pullback, which marked the beginning of a potential correction. At the moment, the price is trading below the recent high and has already started forming a corrective downward move. XAUUSD is now heading toward the important support zone between 3190 and 3160 points. This area is not only a key horizontal level but also intersects with the trend line, making it a strong confluence zone that may act as a magnet for the price during this phase. I expect that the Gold will make a minor upward move before continuing to decline, targeting the support zone at 3190 points, which is my current goal. Given the recent price rejection from the resistance and the bearish momentum building, a move toward 3190 looks like the most probable path. If you like my analytics you may support me with your like/comment ❤️

Euro can drop from top part of range and fall to support levelHello traders, I want share with you my opinion about Euro. Recently, price continued to grow inside a well-defined upward channel, maintaining a steady structure of higher highs and higher lows. The move started after a clear breakout from the buyer zone, which marked a strong bullish impulse and confirmed support near the 1.0735 level. After this breakout, the price gradually climbed, eventually entering a horizontal range, where it started to consolidate between local support and resistance. The current support level has held firm and now aligns with the lower boundary of the range as well as the support area. At the moment, the Euro is approaching the upper boundary of the range. Given the repeated reactions from this resistance zone, I expect the price to make one more push upward, retesting the top of the range, and then reverse downward toward the lower boundary, with TP1 set at 1.1270, where demand and structure are likely to react again. This short-term setup aligns with the current channel structure, the strength of the support area, and the repeated rejection from the range highs. Please share this idea with your friends and click Boost 🚀

EUR/USD - Next leg up incoming?Since February, the EUR/USD currency pair has been in a strong and sustained uptrend, signaling a significant shift in market sentiment. What began as a recovery from the 1.02 level has quickly turned into a strong bullish movement, with the pair already reaching as high as 1.15 in just a matter of two months. This impressive rally marks a clear change in momentum, with price action showing classic bullish characteristics.
--------------------------------
What will we discuss
- Overall trend structure
- 4H Fair Value Gap
- Golden pocket fibonacci
- What to expect next?
--------------------------------
Overall trend structure
Over the past two months, the price action has maintained a clean and well-defined bullish structure. The consistent formation of higher highs and higher lows is a textbook sign of a strong uptrend. Each retracement has been shallow, with buyers stepping in above previous lows, and each rally has broken through key resistance zones, further confirming the prevailing bullish bias.
--------------------------------
4H Fair Value Gap (FVG)
During the latest move up to 1.15, EUR/USD formed a 4H FVG, just before a short-term rejection at the top. This unfilled imbalance now coincides with a key support area. Given this confluence, it’s highly likely that price could revisit this zone to partially or fully fill the gap. This would allow the market to rebalance, and potentially offer a strong foundation for another bullish leg.
--------------------------------
Golden pocket Fibonacci
Adding to the significance of this zone is the golden pocket Fibonacci retracement (0.618–0.65) from the latest upward swing, which lies between 1.14198–1.14274. This area happens to align perfectly with the midpoint of the 4H FVG, providing additional confluence and making it a major technical level to watch.
--------------------------------
What to expect next?
With both the 4H FVG and the golden pocket overlapping, the zone around 1.14198–1.14274 becomes a high-probability support area. Historically, the golden pocket is known to attract strong buying interest, and when coupled with the FVG, it strengthens the case for a bullish reaction. If price dips into this zone and finds support, it could mark the beginning of the next impulsive move higher, in line with the broader uptrend.
--------------------------------
Thanks for your support.
- Make sure to follow me so you don't miss out on the next analysis!
- Drop a like and leave a comment!

Fundamental Market Analysis for April 23, 2025 USDJPYThe Japanese yen (JPY) declined against its US counterpart for a second straight day on Wednesday and retreated further from the multi-month peak reached the previous day. The Trump administration officials' comforting comments on US-China trade talks triggered a sharp rebound in global risk sentiment, which in turn had a strong impact on traditional safe-haven assets, including the yen. Moreover, a slight recovery in the US dollar (USD) from multi-year lows, supported by easing concerns over Federal Reserve (Fed) independence, pushed the USD/JPY pair to a one-week high, a level above 143.000 during the Asian session.
Growing optimism that the US and Japan are moving closer to a temporary trade agreement is helping the yen, which reacted weakly to unimpressive domestic PMIs, to pause its intraday decline. In addition, strengthening expectations that the Bank of Japan (BoJ) will continue to raise interest rates in 2025 is keeping JPY bears from betting aggressively. Meanwhile, investors are losing confidence in the US economy amid Trump's rapidly shifting stance on trade policy. This, as well as bets that the Fed will soon resume its rate-cutting cycle, is holding back the dollar and taking the USD/JPY pair below 142.000 in the last hour.
Trading recommendation: SELL 141.700, SL 142.100, TP 140.500
BEARISH ON THE EUROI've taken a short position on EG, prior to PMI data being released over the next few hours.
Yesterday, I managed to get nice sells on this with the technicals provided, to the "weak low" as you see on the chart. Looking this morning, I expect this trend to continue and dont see a bullish angle on this pair yet until we see a deeper retracement - which is what Im involved in currently.
Fundamentally, Services PMIs tend to matter more for the UK, which is heavily services driven (80% of GDP), with manufacturing PMIs mattering more for Germany, the EU’s engine.
BoE - Slower to commit to cuts due to persistant wage growth and services inflation.
ECB - They are much more dovish in recent statements. Core inflation has been easing, and rate cuts are on the table as early as Q2/Q3.

NZDCAD Discretionary Analysis: Bounce at 0.83Hello traders and happy Easter Monday!
I'm expecting a bounce on NZDCAD. I'm interested in this 0.83 zone. It might turn into a strong bounce point. If the signs are there, I'm jumping in with a short.
Discretionary Trading: Where Experience Becomes the Edge
Discretionary trading is all about making decisions based on what you see, what you feel, and what you've learned through experience. Unlike systematic strategies that rely on fixed rules or algorithms, discretionary traders use their judgment to read the market in real time. It's a skill that can't be rushed, because it's built on screen time, pattern recognition, and the ability to stay calm under pressure.
There's no shortcut here. You need to see enough market conditions, wins, and losses to build that intuition—the kind that tells you when to pull the trigger or sit on your hands. Charts might look the same, but context changes everything, and that's something only experience can teach you.
At the end of the day, discretionary trading is an art, refined over time, sharpened through mistakes, and driven by instinct. It's not for everyone, but for those who've put in the work, it can be a powerful way to trade.

EUR/USD Bearish Setup Unfolding Below Key Resistance📊 Technical Analysis of EUR/USD (4H Chart)
🧭 Chart Overview:
Current Price: ~1.1350
Indicators Used:
EMA 50 (Red): ~1.1311 — acting as dynamic support.
EMA 200 (Blue): ~1.1114 — aligns closely with major support zone.
📌 Key Levels:
🔼 Main Resistance Zone: 1.1375 – 1.1400
Price has tested this zone multiple times, forming a potential double top pattern.
Strong bearish pressure observed each time price enters this area.
🔁 Minor Resistance (Retest Zone): ~1.1325 – 1.1345
Currently acting as a decision zone.
If price fails to hold above this level, it could turn into resistance on the next bearish leg.
🔽 Support Zone: 1.1100 – 1.1130
Converges with EMA 200 — making it a high-probability demand zone.
Potential target for the anticipated drop.
🧠 Price Action & Structure:
Market showed a strong bullish rally previously, breaking through resistance levels.
Now showing signs of exhaustion at the top.
Bearish scenario projected with a lower high forming below the main resistance, followed by a sell-off toward the support zone.
⚙️ Possible Scenarios:
Bearish Scenario (High Probability):
Price rejects the minor resistance → breaks below EMA 50 → continues lower to support.
Target: 1.1110 area.
Bullish Scenario (Low Probability):
Price reclaims and closes above 1.1375 with strong momentum.
Potential breakout and continuation toward 1.1450+.
🧩 Confluences Supporting Bearish Bias:
Lower high formation potential.
EMA 50 starting to flatten.
Failure to maintain momentum above main resistance.
Clean drop path toward 1.1110 if support breaks.
📉 Conclusion:
This setup favors short-term bearish movement, particularly if the price rejects around the 1.1345 level again. A breakdown below the minor resistance zone would likely trigger a sell-off toward the 1.1110 support, in line with the 200 EMA.

XAU/USD Target Achieved – $3,500 Successfully Hit 🔥 XAU/USD Target Smashed – $3,500 HIT! 🎯💰
Gold has officially reached $3,500, perfectly hitting our projected buy target!
This move confirms the strength of the bullish momentum and technical breakout setup.
🔹 Entry: Above $3,430
🔹 Final Target: ✅ $3,500 – Hit
🔹 Result: High-conviction setup delivered with precision
🔹 Trend: Remains bullish, but profit-taking expected at round number resistance
👏 Massive congrats to all who followed the plan — another clean win on XAU/USD!

BTC/USD Eyes $109K After Bullish Breakout!!🧠 Chart Type and Indicators:
Chart Type: Candlestick
Indicators Used:
EMA 50 (red line): 85,335.18
EMA 200 (blue line): 85,657.29
🔍 Technical Pattern Analysis:
Pattern Identified: Ascending Triangle
The price has formed higher lows (ascending trendline support) while repeatedly testing a horizontal resistance zone (~$88,000), forming an ascending triangle.
This is typically a bullish continuation pattern when it occurs after an uptrend, though in this context, it's forming after a consolidation, giving more significance to the breakout.
🚀 Breakout Confirmation:
The price has broken above the horizontal resistance and is currently trading at $92,766.51.
Volume is not visible but should be increasing during a valid breakout.
Both EMAs have been decisively breached to the upside, signaling momentum shift in favor of bulls.
🧩 Key Levels:
Support Zone (Post-Breakout Retest): ~$88,000
Previously a resistance zone, now likely to act as support.
Immediate Resistance: ~$96,000
Historical resistance zone shown on the chart with a horizontal black line.
Extended Target (measured move): ~$109,420
Based on the height of the triangle projected from the breakout point.
📈 Price Action Forecast:
Two possible scenarios (depicted with arrows on the chart):
Bullish Continuation:
A retest of the $88,000 zone followed by continuation to $96,000, then $109,420.
Short-Term Pullback:
Price may dip to retest the breakout zone (~$88,000), consolidate, then rally higher.
✅ Bullish Signals Summary:
Breakout from a bullish ascending triangle.
EMAs crossed and price holding above them.
Clear higher highs and higher lows formation.
Momentum suggesting further upside.
🧨 Risks to Watch:
False Breakout Risk: If the price fails to hold above $88,000 and falls back into the triangle range.
Macro Factors: Bitcoin remains sensitive to macroeconomic news and regulations that could disrupt technical setups.


GOLD (XAU/USD) Breakout Watch –Bullish Continuation or Pullback?🔍 Instrument Analysis: XAU/USD (Gold vs USD)
Timeframe: Likely 1H or 4H (based on candle structure)
Indicators:
EMA 50 (Red) – Current value: 3,365.25
EMA 200 (Blue) – Current value: 3,248.04
📈 Current Market Structure
Price: Trading at 3,433.62, in a strong uptrend with higher highs and higher lows.
Trend: Bullish, supported by price trading above both the 50 EMA and 200 EMA.
Key Zones:
Immediate Resistance: ~3,430 - 3,440 zone (currently being tested).
First Support Zone: ~3,315 - 3,330
Second Support Zone: ~3,250 - 3,270
🧠 Scenario Analysis
✅ Bullish Scenario (Primary Bias)
Price is attempting a break and retest of the resistance zone.
If a successful retest confirms it as support, next upside leg could target 3,480+.
Bullish continuation is favored as long as price holds above 3,385 (recent breakout level).
⚠️ Bearish Scenario (Secondary Bias)
If price fails to hold above 3,385, we may see a pullback to:
3,315 - 3,330 support area (reaction likely due to proximity to EMA 50).
A deeper retracement toward the 3,250 zone, aligned with EMA 200, which would be a critical level for bullish continuation or breakdown.
📊 EMA Insight
EMA 50 > EMA 200: Confirms bullish momentum.
The slope of both EMAs is upward, reinforcing current upward trend.
A test of the EMA 50 may offer a buy opportunity if structure holds.
🔔 Trade Outlook
Bullish bias remains intact above 3,385.
Look for bullish price action confirmation (bullish engulfing, pin bars, etc.) on retest of resistance-turned-support.
Monitor volume/activity around 3,385-3,400 for potential rejection or continuation clues.

GOLD SMASHES THROUGH $3,450🚨 GOLD SMASHES THROUGH $3,450 – IS THIS THE START OF A GLOBAL FINANCIAL RESET? 🚨
🔥 Unstoppable Surge in Motion 🔥
Gold has soared past $3,450 as Asian markets opened, climbing over $100 a day!
In just two weeks, gold is up by over $500 — this isn’t just a rally, it’s a major structural breakout.
A surge in demand from Chinese funds appears to be fuelling the rise, with increasing evidence that Asia is leading a strategic shift away from fiat risk.
💷 Is the Dollar in Decline? Investors Flee the Old System 💷
The US Dollar Index (DXY) has taken a sharp downturn — confidence in USD is clearly under pressure.
Capital is flowing out of the United States, signalling a move away from the traditional financial order dominated by the dollar.
This gold rally isn't just about price — it's a global vote of no confidence in the status quo.
📉 Implications for the UK
With the pound holding relatively stable against the dollar, this gold spike presents a unique hedge opportunity.
For UK investors, rising gold prices could help offset currency risk and inflation concerns — especially in the face of persistent market uncertainty and geopolitical tensions.
📊 Technical Overview 📊
Gold is currently testing critical resistance around $3,519.
A pullback may see it retest support at $3,416 or as low as $3,210.
Fibonacci levels indicate a likely consolidation zone around $3,416.
The momentum is strong — we could be in the early phase of a global asset rotation.
📈 2-Hour Gold Chart Insight
Recent charts show a parabolic move with significant volume, primarily from Asia-based buyers.
This is not a short-term speculative move — it's likely a long-term strategic repositioning.
🌍 What Comes Next? 🌍
Should gold maintain levels above $3,450, a move towards $3,600 and beyond looks increasingly likely.
Talk of a financial "reset" is no longer just fringe theory — it’s entering the mainstream conversation.
From a UK perspective, now could be the time to:
Re-evaluate gold as a portfolio stabiliser
Reconsider exposure to US-denominated assets
Anticipate further volatility across fiat currencies
📌 Key Price Levels to Watch:
Resistance: $3,519 / $3,601
Support: $3,416 / $3,210
Upside Target: $3,600+
📈 Suggested Trading Zones:
Buy Zone
Entry: $3,424 – $3,422
Stop Loss: $3,418
Take Profit Targets: $3,428 / $3,432 / $3,436 / $3,440 / $3,450
Sell Zone
Entry: $3,604 – $3,606
Stop Loss: $3,610
Take Profit Targets: $3,600 / $3,596 / $3,592 / $3,588 / $3,584 / $3,580
💬 What’s your take? Is gold signalling the end of USD dominance?
Is the UK prepared for a global monetary shake-up? Let’s discuss. 🪙

Fundamental Market Analysis for April 22, 2025 GBPUSDGBPUSD:
The GBP/USD pair is trading in positive territory around 1.3370 during the early Asian session on Tuesday. Concerns over slowing growth in the United States (US) and worries over the independence of the Federal Reserve (Fed) are driving the US Dollar (USD) lower and creating a tailwind for the major pair.
US President Donald Trump condemned Powell for continuing to maintain a “wait-and-see” monetary policy until there is clarity on how the new tariff policy will affect the economic outlook. In a Truth social media post, Trump warned that the US economy will slow down if Powell doesn't cut interest rates immediately.
Heightened uncertainty surrounding Trump's tariffs and rising trade tensions between the U.S. and China are undermining the U.S. dollar across the board.
On the other hand, softer UK consumer price index (CPI) inflation data for March and global uncertainty paved the way for an interest rate cut by the Bank of England (BoE) at its May meeting. Financial markets are now betting on an interest rate cut at the Bank of England's May meeting, estimating an 86% probability of this happening, according to LSEG data. This, in turn, could affect the Pound Sterling (GBP) exchange rate against the US Dollar.
Trading recommendation: BUY 1.3425, SL 1.3395, TP 1.3510

FET/USDT - Trendline Breakout (22.04.2025)The FET/USDT Pair on the M30 timeframe presents a Potential Selling Opportunity due to a recent Formation of a Breakout Pattern. This suggests a shift in momentum towards the downside in the coming hours.
Possible Short Trade:
Entry: Consider Entering A Short Position around Trendline Of The Pattern.
Target Levels:
1st Support – 0.553
2nd Support – 0.516
🎁 Please hit the like button and
🎁 Leave a comment to support for My Post !
Your likes and comments are incredibly motivating and will encourage me to share more analysis with you.
Best Regards, KABHI_TA_TRADING
Thank you.

USD/CAD - Channel Pattern (22.04.2025)The USD/CAD Pair on the M30 timeframe presents a Potential Selling Opportunity due to a recent Formation of a Channel Pattern. This suggests a shift in momentum towards the downside in the coming hours.
Possible Short Trade:
Entry: Consider Entering A Short Position around Trendline Of The Pattern.
Target Levels:
1st Support – 1.3771
2nd Support – 1.3745
🎁 Please hit the like button and
🎁 Leave a comment to support for My Post !
Your likes and comments are incredibly motivating and will encourage me to share more analysis with you.
Best Regards, KABHI_TA_TRADING
Thank you.

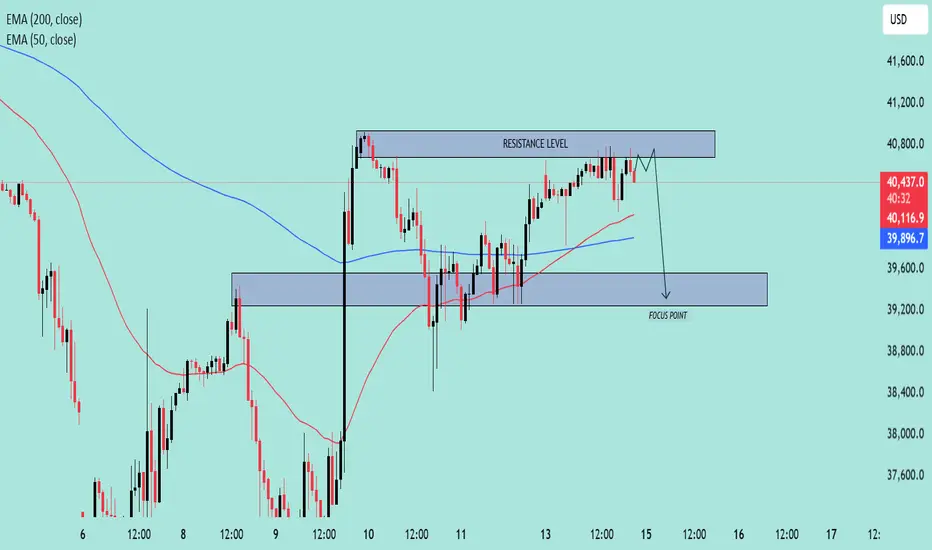
US30 Approaching Key Resistance–Potential Reversal Setup in Play🧠 Chart Overview
Asset: US30 (likely the Dow Jones Industrial Average)
Timeframe: Appears to be 1H or 2H
Indicators:
EMA 50 (Red): 40,119.5
EMA 200 (Blue): 39,897.3
Price at time of chart: Around 40,503
🔍 Key Technical Levels
🔴 Resistance Zone
Range: ~40,750 to 40,850
Price has tested this level multiple times and is currently hovering near it.
The resistance is holding, and no strong breakout has occurred.
🟦 Support / Focus Zone
Range: ~39,200 to 39,600
Marked as the “FOCUS POINT” – likely the expected target on a breakdown.
EMAs Insight:
Price is above both the 50 EMA and 200 EMA, suggesting short-term bullishness.
However, since it’s stalling at resistance, it could flip bearish on rejection.
🧭 Price Action Narrative
The chart suggests a potential fakeout above resistance, followed by a sharp rejection.
The path drawn shows a short-term dip, targeting the FOCUS POINT (support zone).
Rejection at resistance aligns with typical distribution behavior.
📌 Trade Idea (Bearish Bias)
Entry Idea: Short near or just above the resistance level (~40,800)
Target: 39,400 zone
Stop-Loss: Above the resistance level (~40,900+)
Risk/Reward: Favorable if price fails to break above resistance convincingly
📉 Bias: Bearish Reversal
Unless price breaks and closes above resistance with strong momentum, the chart favors a pullback scenario.
Gold (XAU/USD) Bullish Continuation Setup – Key Support Levels 📊 Chart Context & Setup
Chart Type: Candlestick
Indicators Used:
50 EMA (red): Currently at 3,199.009
200 EMA (blue): Currently at 3,123.168
Support Zone: Around 3,157.786 – 3,123.168
Current Price: Approximately 3,211.90
Focus Point (Target Zone): 3,283.810
🧠 Technical Analysis
🔹 Trend Analysis
Overall Trend: Bullish
Price is trading above both the 50 EMA and 200 EMA.
The EMAs are sloping upward, indicating strong momentum.
Golden Cross previously occurred (50 EMA crossing above 200 EMA).
🔹 Key Support & Resistance
Immediate Resistance Zone: Around 3,240
This area is acting as a potential rejection zone, with minor consolidation.
Support Zone (Highlighted): 3,157 – 3,123
This zone was previously a breakout level and now serves as a retest support.
It coincides with the 200 EMA, adding to its strength.
🔁 Scenarios Presented
Scenario A – Bullish Rejection from Immediate Support (3,199)
Price could hold above or near the 50 EMA.
Break and retest of minor resistance could lead to a push toward 3,283.81 (target).
This is a higher-risk entry as the support is not deeply tested yet.
Scenario B – Deeper Pullback to Major Support (3,157 – 3,123)
A drop below current price into the main demand zone.
Bullish engulfing or strong reaction in this zone would offer a high-probability long setup.
Ideal entry point for swing traders, especially if confirmed by volume or bullish candlestick reversal.
🎯 Trade Strategy Suggestion
✅ Long Setup
Entry Option 1: On bullish rejection above 3,199 with confirmation.
Entry Option 2 (Preferred): At strong support zone 3,157 – 3,123 with bullish reversal signal.
Target: 3,283.81
Stop Loss:
For Entry 1: Below 3,157
For Entry 2: Below 3,100 or 200 EMA, depending on aggressiveness
📌 Conclusion
This chart illustrates a classic bullish continuation setup with two potential entry scenarios:
A minor pullback and bounce from the 50 EMA.
A deeper retracement into a strong support zone aligned with the 200 EMA.
The uptrend remains intact as long as the price holds above the 200 EMA and the major demand zone. A break below 3,100 would invalidate the bullish outlook short-term

Fundamental Market Analysis for April 21, 2025 EURUSDEUR/USD broke out of a multi-day trading range and hit a new high since February 2022 around 1.1485 during the Asian session on Monday.
Despite “aggressive” comments from Federal Reserve (Fed) Chairman Jerome Powell, uncertainty over US President Donald Trump's trade policy continues to undermine the dollar. Last Wednesday, Powell said the Fed would likely keep the benchmark interest rate unchanged and wait for more clarity before considering any policy adjustments. Meanwhile, Trump's retaliatory tariff announcements undermined investor confidence in U.S. economic growth and drove the dollar to a two-year low early in the new week.
The aforementioned factors largely offset the European Central Bank's (ECB) soft decision last week and served as a tailwind for EUR/USD. On Thursday, the ECB cut interest rates for the seventh time in a year and warned that economic growth would be hit hard by US tariffs, bolstering the case for further policy easing in the coming months.
Moving forward, traders this week will be focused on scheduled speeches by ECB President Christine Lagarde on Tuesday and a number of influential FOMC members this week. In addition, the market's focus will be on the release of flash PMI indices, which could provide new insights into the state of the global economy. This, in turn, may give some impetus to the US dollar and EUR/USD.
Trade recommendation: BUY 1.1520, SL 1.1465 , TP 1.1565.
