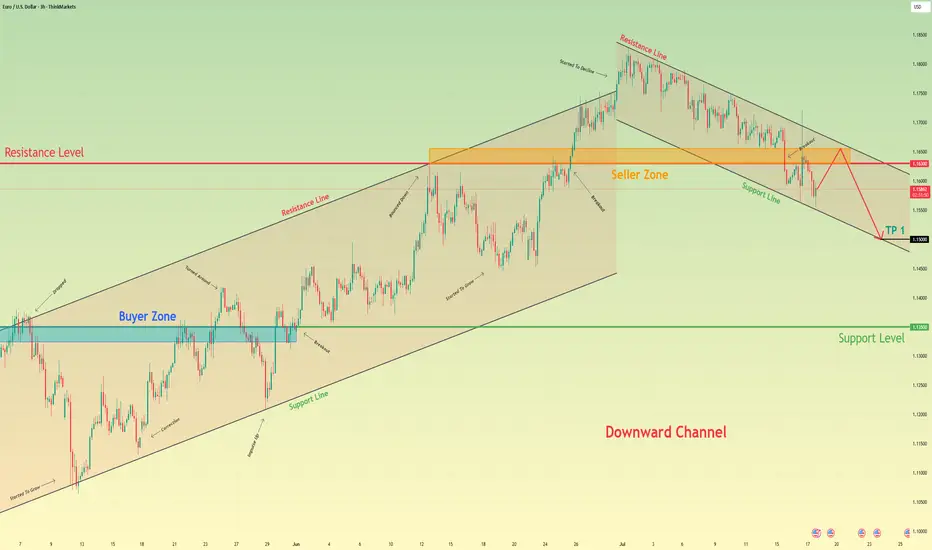
Euro may reach seller zone and then continue to fall in channelHello traders, I want share with you my opinion about Euro. The price pair has recently shifted its market structure, establishing a clear downward channel after breaking its previous uptrend. Before this breakdown, the price was consistently trading within an Upward Channel, repeatedly finding support in the buyer zone (1.1325–1.1350) and reversing upward. The bullish momentum eventually faded when the price failed to break the major horizontal resistance level at 1.1630. This failure triggered a strong bearish impulse, leading to a decisive breakout below the channel's support line and confirming a trend reversal. Currently, the price is making a corrective move up inside the newly formed downward channel, which appears to be a classic retest of the broken structure from below. I expect this upward move to stall as it approaches the heavy confluence of resistance formed by the channel's upper Resistance Line and the horizontal seller zone at 1.1630–1.1655. After testing this area, I anticipate a rejection and the beginning of a new bearish leg down. That's why I've set my TP at the 1.1500 level — it aligns perfectly with the support line of the current downward channel, making it a logical target for sellers. Please share this idea with your friends and click Boost 🚀
Disclaimer: As part of ThinkMarkets’ Influencer Program, I am sponsored to share and publish their charts in my analysis.
Analysis
Fundamental Market Analysis for July 17, 2025 EURUSDThe euro is edging back toward the 1.16 – 1.17 range highs after headlines suggesting former U.S. president Donald Trump might try to dismiss Fed Chair Jerome Powell and a softer-than-expected U.S. Producer Price Index (PPI) print pressured the dollar. Political noise around the Fed’s independence, coupled with a cooling inflation pulse, has pushed market pricing toward a longer policy pause; the pair is hovering near 1.16250 at the time of writing.
Fundamental support also stems from the upcoming 24 July ECB meeting. Governing-Council commentary reveals a split between hawks and would-be doves, yet consensus that euro-area inflation remains above target makes an aggressive rate cut unlikely for now. Meanwhile, subdued U.S. Treasury yields—futures price a 95 % probability of no change this month and only 50 bp of total easing over 12 months—help narrow the U.S.–German 10-year spread to about 150 bp.
Against a backdrop of ongoing U.S. trade tensions and steady inflows into euro-area assets, that narrower spread leaves room for EURUSD to grind toward the 1.1680 target if sentiment stays risk-positive.
Trading recommendation: BUY 1.16250, SL 1.15950, TP 1.16800

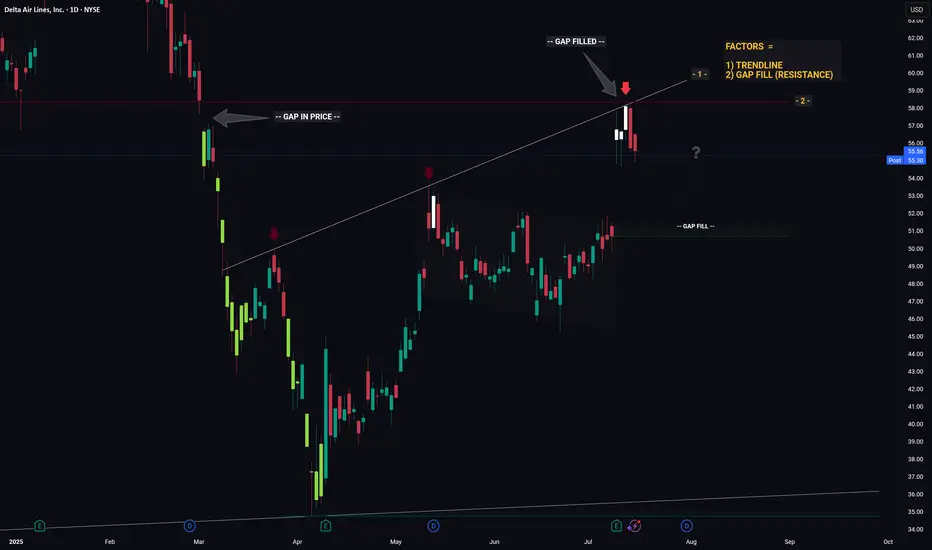
DELTA - Converging Levels Creates Huge Resistance - Retrace?Hello Traders!
Whichever Hedge Fund that is responsible for the recent price action in DELTA mustve been in a generous mood... because theyre giving us an excellent hint as to what price will likely do next.
And what hint might that be you ask...
1) Trendline (connecting the recent highs)
2) Gap Fill (Resistance)
Individually these factors are relatively strong, however when combined they essesntially create a strong barrier that will be very hard for price to break through. Think about it like a wall made from Captain Americas shield... now try and break through that.. aint gonna be easy.
So whats next for price? If I was a betting man (and I am, incase you were wondering) I would say theres a high probability that price is going to trade down from this resistance level then retrace to the gap fill below. From the gap fill level we will likely see a bounce.
Thanks, I hope you found this post educational or helpful and best of luck on your trading journey!
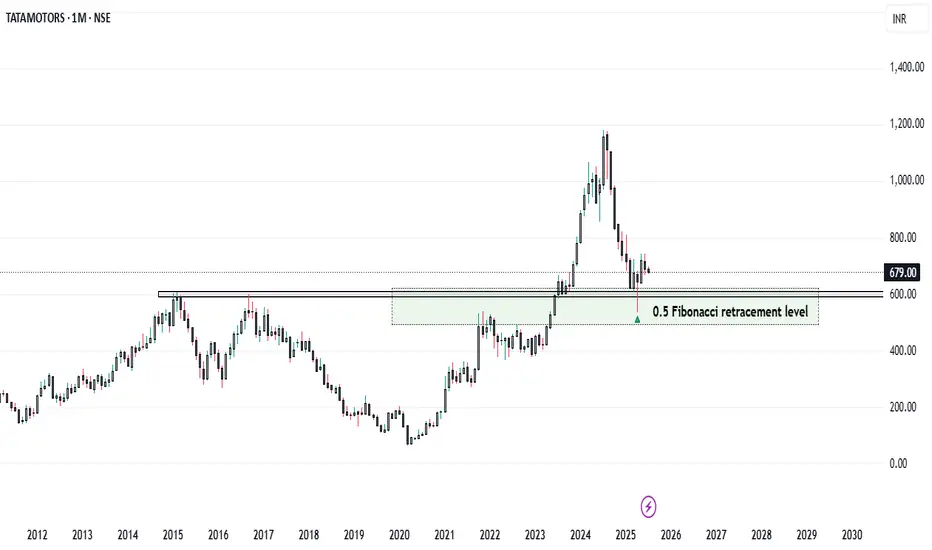
Tata Motors: From Profit Pressure to Growth Potential... Company Overview
* Name: Tata Motors Ltd.
* Industry: Automotive
* Key Segments: Passenger Vehicles (PV), Commercial Vehicles (CV), Electric Vehicles (EV), Jaguar Land Rover (JLR)
* FY25 Milestone: The Automotive business became debt-free
Q4 FY25 Performance Overview
* Net Profit: ₹8,556 crore (Down 51% YoY)
* Reason for Decline:
* High base due to deferred tax benefit in Q4 FY24
* Lower domestic volumes in PV and CV segments
* Reduced operating leverage amid falling demand
* Revenue: Marginal YoY increase (Consolidated revenue at record level for FY25)
* Positive Developments Despite Profit Decline :
* JLR Profitability Improvement
* Profit rose despite slightly lower revenue
* Supported by higher volumes and reduced depreciation
* Debt-Free Automotive Division:
* Major financial milestone for FY25 :
* Record Annual Revenue:
* Highest consolidated revenue in Tata Motors' history
* Future-Focused Investments:
* Capital allocation towards EVs, new product development, and manufacturing capacity
Strategic Growth Drivers – Reasons for Optimism
1. Electric Vehicle (EV) Leadership
* Tata Motors holds a dominant position in India’s EV market
* Plans to launch 10 EV models by 2026
* Battery Gigafactory is expected to begin production in 2026
* Strong alignment with India’s clean mobility goals
2. Expanding Product Portfolio
* Focused on SUV and ₹10–20 lakh price segments
* Upcoming launches:
* Curvv EV
* Harrier EV
* Sierra EV
* Strategy to cater to diverse customer preferences
3. Improving Financial Health
* Targeting 10% EBITDA across PV and EV divisions
* Demerger of CV and PV businesses to streamline operations and unlock value
4. Strong Base in Commercial Vehicles
* Market leader with 37.83% share in EV segment
* CV recovery is expected with infrastructure and rural demand growth
5. Supportive Macroeconomic and Policy Environment
* Government incentives: FAME II, PLI scheme
* EV-friendly policies encouraging domestic manufacturing
* Economic tailwinds: rising disposable income, urbanization, rural penetration
Risks and Challenges Ahead
* Intensifying Competition:
* Pressure from Maruti Suzuki, Hyundai, and new players
* Global Geopolitical and Trade Risks:
* US tariffs, material shortages (e.g., rare earths for EVs)
* Domestic Demand Slowdown:
* Inflation and high interest rates are affecting affordability
* Jaguar Land Rover’s Transition Challenges:
* EV transformation complexity
* Global demand volatility
* Production ramp-up hurdles
Conclusion
Tata Motors is at a pivotal juncture. While short-term profitability has taken a hit due to exceptional prior-year gains and cyclical volume pressures, the company’s fundamentals remain strong. Its leadership in EVs, ambitious expansion plans, and a now debt-free automotive business position it for long-term success.
However, realizing this potential depends on:
* Execution of its EV roadmap
* Sustained domestic demand
* Managing global uncertainties
* Staying competitive in an evolving auto landscape
Strategic Verdict:
Short-term caution, long-term confidence.
Tata Motors appears well-poised for a resilient comeback, driven by structural transformation and market-aligned growth strategies.
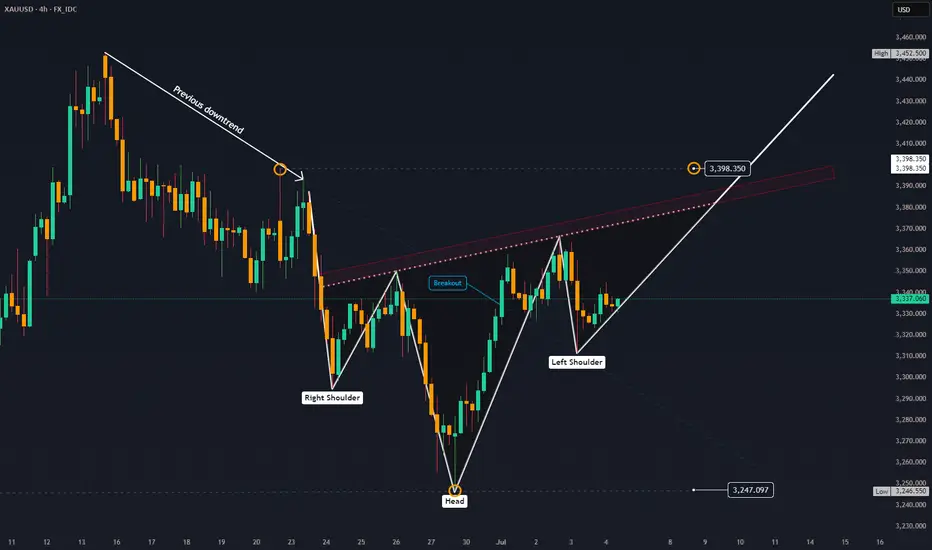
GOLD - Price can start to decline and break support levelHi guys, this is my overview for EURUSD, feel free to check it and write your feedback in comments👊
Gold initially traded inside a steady falling channel, carving lower highs at $3390 and lower lows around $3285 as bears held sway.
A brief fake breakout at $3365 briefly flipped sentiment, but sellers quickly reasserted control and pushed price back toward the channel floor.
Buyers then absorbed selling at the $3285 support area, sparking a rebound into a rising wedge pattern marked by converging trendlines.
Within this wedge, three minor breakouts failed to trigger sustained rallies, underscoring persistent resistance near the upper boundary.
I anticipate Gold to roll over from the wedge’s ceiling and break below $3365, targeting the wedge’s lower support line at $3310
If this post is useful to you, you can support me with like/boost and advice in comments❤️
Disclaimer: As part of ThinkMarkets’ Influencer Program, I am sponsored to share and publish their charts in my analysis.

Euro may fall to support area and then start to growHello traders, I want share with you my opinion about Euro. The price previously moved inside a wedge formation, where it tested the buyer zone and showed a strong reaction from this area. After that, the pair broke out upward and started to trade inside an upward channel, building momentum and forming a clear bullish structure. Later, the price created a pennant pattern, often considered a continuation signal. But before continuing the upward trend, I expect the Euro to first exit from the pennant and decline toward the support area. This zone was previously resistantce, and now it may turn into a strong support. Now the price is trading near the pennant resistance, but I don’t expect a breakout right away. The market needs to correct before it resumes the uptrend. Once the price reaches the current support level or slightly lower, it may find demand again and bounce. That’s why I expect the Euro to retest the support zone and then grow further toward TP 1 - 1.1850 points. This target aligns with the upper border of the upward channel and would complete the continuation move after the pennant breakout. Given the previous structure, bullish momentum, and patterns on the chart, I remain bullish after the correction and expect the price to rise from the support zone. Please share this idea with your friends and click Boost 🚀
Disclaimer: As part of ThinkMarkets’ Influencer Program, I am sponsored to share and publish their charts in my analysis.

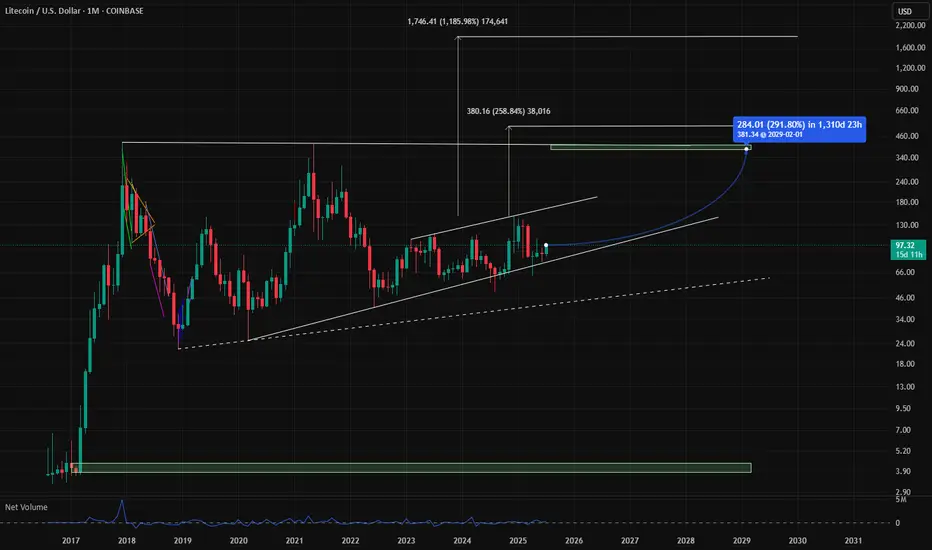
LTC Targets 400$ + 1900$ Litcoin LTC Targets for the next run are atm +290% is a realistic szenario. The addvanced targets at 1900$ are very impressiv but remember there are only 21 Mio. Coins too, like BTC because it is the fork and think about an alternative payment methode like btc, would be a reason for 1900$ pro LTC. So in Crypto is nothing unreal if you could imagine, but first of all approx. 400$ are a good direction. GM
EUR/USD - Daily Chart (Wedge Breakout) (16.07.2025) The EUR/USD Pair on the D1 timeframe presents a Potential Selling Opportunity due to a recent Formation of a Wedge Pattern. This suggests a shift in momentum towards the downside in the coming Days.
Possible Short Trade:
Entry: Consider Entering A Short Position around Trendline Of The Pattern.
Target Levels:
1st Support – 1.0956
2nd Support – 1.0625
💡 Fundamental & Sentiment Context
Euro under pressure amid renewed concerns over EU‑US trade friction .
The USD is strengthening, supported by safe‑haven flows amid tariff uncertainties.
🎁 Please hit the like button and
🎁 Leave a comment to support for My Post !
Your likes and comments are incredibly motivating and will encourage me to share more analysis with you.
Best Regards, KABHI_TA_TRADING
Thank you.
Disclosure: I am part of Trade Nation's Influencer program and receive a monthly fee for using their TradingView charts in my analysis.

Fundamental Market Analysis for July 16, 2025 USDJPYEvent to Watch Today:
15:30 EET. USD – Producer Price Index
USDJPY:
USD/JPY has stabilized around 148.900, maintaining upside potential due to:
Interest Rates: The Fed keeps yields elevated (10-year bonds at 4.46%), while the Bank of Japan maintains an ultra-loose policy, keeping real yields negative.
Political Uncertainty: Upcoming elections in Japan and possible fiscal tightening reduce the yen’s appeal.
Dollar Demand: Trade frictions and geopolitical risks drive safe-haven flows into the dollar.
A break above 149.000 could open the path to 149.500. Support at 148.600 remains a critical barrier for the bullish scenario.
Trade Recommendation: BUY 149.000, SL 148.700, TP 149.900

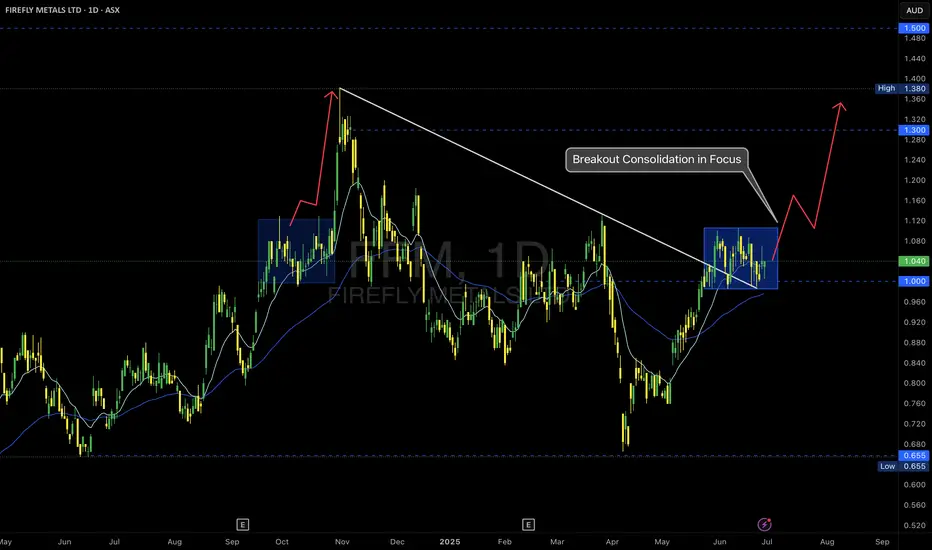
FFM -- ASX – Breakout Consolidation in Focus
📝 Description
Firefly Metals is setting up a classic breakout continuation scenario after reclaiming the $1.00 psychological level and breaking the long-term trendline resistance.
🔹 Key Observations:
• Trendline Break: The descending trendline from the prior high was decisively breached, signaling a structural shift.
• Accumulation Zone: Price has consolidated in a tight range above $1.00, forming a bullish flag or box accumulation.
• EMA Cluster Support: Both the 15 and 60 EMAs are aligned below the consolidation, providing dynamic support.
🔹 Potential Scenarios:
✅ Bullish Continuation:
A clean breakout above the top of the blue box could trigger a momentum rally toward $1.30 and ultimately the $1.38–$1.50 resistance levels.
✅ Deeper Pullback:
If price loses the $1.00 support decisively, a retracement to retest the breakout base is possible.
Trade Plan:
I am monitoring for a confirmed breakout candle with volume expansion to validate the continuation thesis.
• Entry trigger above the range high ($1.10 area)
• Stops below recent swing low / $1.00 level
• First target: $1.30 resistance
As always, risk management first—no breakout, no trade.
#MJTrading
#FFM #FireflyMetals #ASXTrading #BreakoutSetup #TechnicalAnalysis #PriceAction #TradingPlan #ChartOfTheDay #AustralianStocks #MomentumTrading #MJTrading
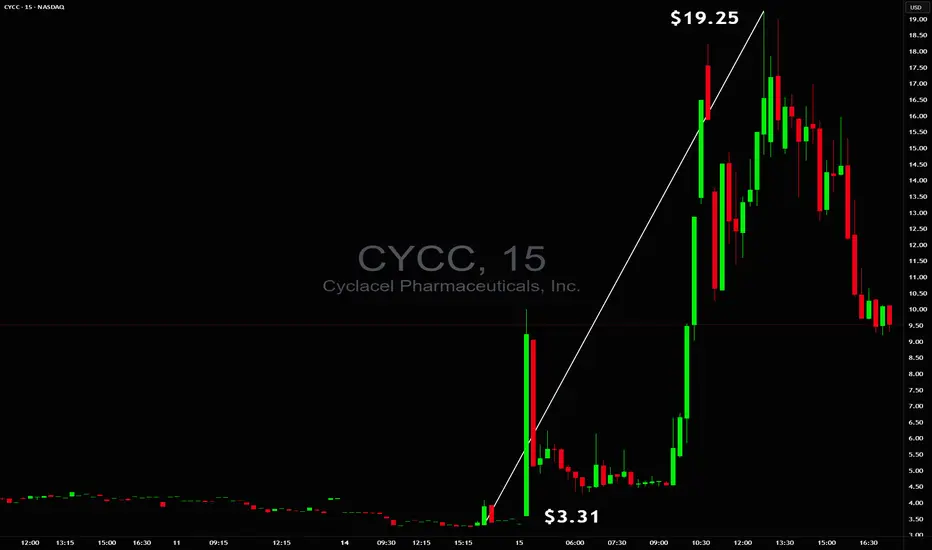
$3.31 to $19.25 in minutes$3.31 to $19.25 in minutes 🚀 but without a safe trade setup ❌ NASDAQ:CYCC
Too unstable to trade early while end of day there was a chance for power squeeze but even on 60M+ volume, tiny float and huge borrow fee they were able to reverse it so safe stop had to be respected ✔️
NVIDIA -- Major Resistance // Confluence of 3 FactorsHello Traders!
WOW... This chart is quite incredible I must say.
It's amazing how price is currently at an exact point where 2 major trendlines converge which also nearly coincides with the 1.618 Fibonacci extension. Price closed almost to the penny just above the major trendline connecting the prior highs. It will be very interesting to see what price does over the next few days.
What Does These Converging Trendlines Mean?: Think of a trendline like a wall... Depending on how "strong" the trendline is, this wall could be made from wood all the way through to vibranium straight from Captain Americas shield! These two trendlines converging would likely resemble a steel wall and would be extremely hard to penetrate. (Although there are no gurantees in trading)
What To Watch For: I will be watching to see if price can both break and confirm above both resistance trendlines. It will take MEGA buying pressure to accomplish this and would likely mean continuation to the upside. If price cannot break and confirm above then we will likely see a large retrace to support.
Thanks everyone and best of luck on your trading journeys!

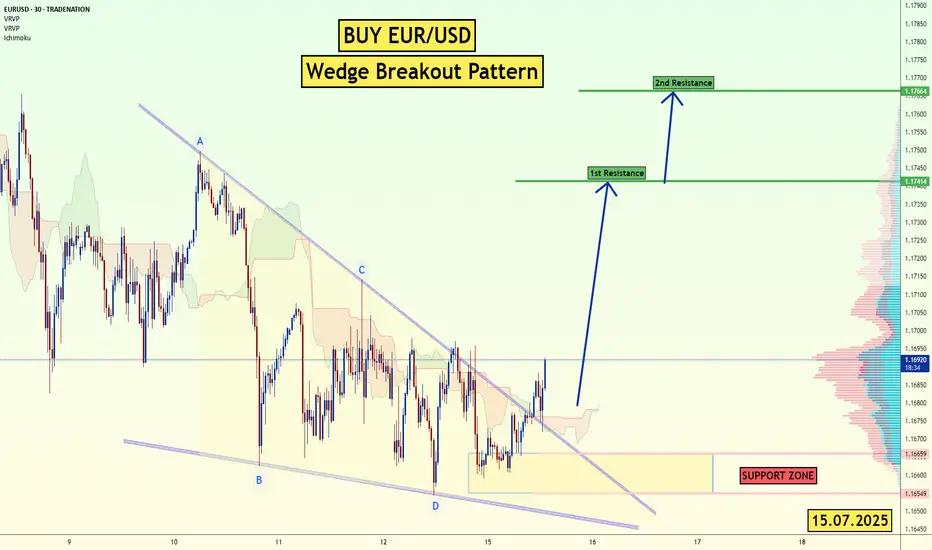
EUR/USD - Wedge Breakout (CPI- Today) 15.07.2025 The EUR/USD pair on the M30 timeframe presents a Potential Buying Opportunity due to a recent Formation of a Wedge Breakout Pattern. This suggests a shift in momentum towards the upside and a higher likelihood of further advances in the coming hours.
Possible Long Trade:
Entry: Consider Entering A Long Position around Trendline Of The Pattern.
Target Levels:
1st Resistance – 1.1741
2nd Resistance – 1.1766
🎁 Please hit the like button and
🎁 Leave a comment to support for My Post !
Your likes and comments are incredibly motivating and will encourage me to share more analysis with you.
Best Regards, KABHI_TA_TRADING
Thank you.
Disclosure: I am part of Trade Nation's Influencer program and receive a monthly fee for using their TradingView charts in my analysis.
AVAX/USDT - H4 - Wedge Breakout (29.06.2025)The AVAX/USDT pair on the H4 timeframe presents a Potential Buying Opportunity due to a recent Formation of a Wedge Breakout Pattern. This suggests a shift in momentum towards the upside and a higher likelihood of further advances in the coming Days.
Possible Long Trade:
Entry: Consider Entering A Long Position around Trendline Of The Pattern.
Target Levels:
1st Resistance – 21.77
2nd Resistance – 24.35
🎁 Please hit the like button and
🎁 Leave a comment to support for My Post !
Your likes and comments are incredibly motivating and will encourage me to share more analysis with you.
Best Regards, KABHI_TA_TRADING
Thank you.

TURBO/USDT - H4 - Wedge Breakout (29.06.2025)The TURBO/USDT pair on the H4 timeframe presents a Potential Buying Opportunity due to a recent Formation of a Wedge Breakout Pattern. This suggests a shift in momentum towards the upside and a higher likelihood of further advances in the coming Days.
Possible Long Trade:
Entry: Consider Entering A Long Position around Trendline Of The Pattern.
Target Levels:
1st Resistance – 0.005173
2nd Resistance – 0.005994
🎁 Please hit the like button and
🎁 Leave a comment to support for My Post !
Your likes and comments are incredibly motivating and will encourage me to share more analysis with you.
Best Regards, KABHI_TA_TRADING
Thank you.

XAUUSD 1440M forecast Based on the latest available information for July 15, 2025, the overall sentiment for XAUUSD (Gold) in the next 24 hours leans towards a bullish outlook, though with potential for short-term fluctuations and pullbacks.
Key Drivers for Bullish Outlook:
Escalating Trade Tensions: US President Donald Trump's ongoing tariff and trade policies are a significant factor. New tariffs and threats against various countries (EU, Mexico, Japan, South Korea, Brazil, Canada) are creating global economic uncertainty, which typically boosts gold's appeal as a safe-haven asset.
Geopolitical Uncertainty: Broader geopolitical risks, including those related to Russia and Ukraine, also contribute to safe-haven demand for gold.
Inflation Concerns: Tariffs are linked to inflation concerns. Gold performs strongly in a high-inflation environment, and market expectations are shifting towards a more gradual easing of interest rates by the Fed, allowing for inflation to be a potential driver.
Central Bank Demand: Central banks globally, particularly the US and China, continue to be strong buyers of gold, indicating a sustained structural trend of higher gold purchases.
Technical Support: Several analyses point to gold finding support at key levels (e.g., around $3340-3345, 200 EMA), suggesting potential for bounces and continuation of an upward trend.
"Buy on Dip" Strategy: Many analysts are recommending a "buy on dip" strategy, indicating an underlying bullish bias and viewing any short-term declines as buying opportunities.
Factors to Watch (Potential for Pullbacks/Volatility):
Short-Term Weakness/Consolidation: Some technical indicators suggest short-term weakness or consolidation, with gold testing resistance levels (e.g., $3375-3380, $3400).
US Dollar Strength: While trade tensions can weaken the dollar, there are mixed signals. A stronger US dollar can put downward pressure on gold prices as it makes gold more expensive for holders of other currencies.
Inflation Data and Fed Signals: Investors are closely watching US inflation data (CPI) and signals from Federal Reserve officials regarding interest rate cuts. While some expect cuts later in the year, any hawkish surprises could temper gold's rise.
Trade Deal Hopes: Any signs of de-escalation in trade tensions or progress towards agreements could temporarily reduce safe-haven demand for gold.
Specific Price Levels Mentioned:
Resistance: $3375-3380, $3400, $3432, $3450-3470, $3500 (all-time high).
Support: $3340-3345, $3325-3330, $3289-3303, $3240-3246.
In summary, the prevailing sentiment for XAUUSD over the next 24 hours appears to be bullish, driven by ongoing global trade tensions and safe-haven demand. However, be prepared for potential short-term pullbacks or consolidation as the market digests new information and tests key resistance levels.
For those interested in further developing their trading skills based on these types of analyses, consider exploring the mentoring program offered by Shunya Trade.
I welcome your feedback on this analysis, as it will inform and enhance my future work.
Regards,
Shunya Trade
⚠️ Disclaimer: This post is educational content and does not constitute investment advice, financial advice, or trading recommendations. The views expressed here are based on technical analysis and are shared solely for informational purposes. The stock market is subject to risks, including capital loss, and readers should exercise due diligence before investing. We do not take responsibility for decisions made based on this content. Consult a certified financial advisor for personalized guidance.
USD/JPY(20250714)Today's AnalysisMarket news:
① Fed's Goolsbee: The latest tariff threat may delay rate cuts. ② The Fed responded to the White House's "accusations": The increase in building renovation costs partly reflects unforeseen construction conditions. ③ "Fed's megaphone": The dispute over building renovations has challenged the Fed's independence again, and it is expected that no rate cuts will be made this month. ④ Hassett: Whether Trump fires Powell or not, the Fed's answer to the headquarters renovation is the key.
Technical analysis:
Today's buying and selling boundaries:
147.02
Support and resistance levels:
148.39
147.88
147.55
146.49
146.15
145.64
Trading strategy:
If the price breaks through 147.55, consider buying, and the first target price is 147.88
If the price breaks through 147.02, consider selling, and the first target price is 146.49

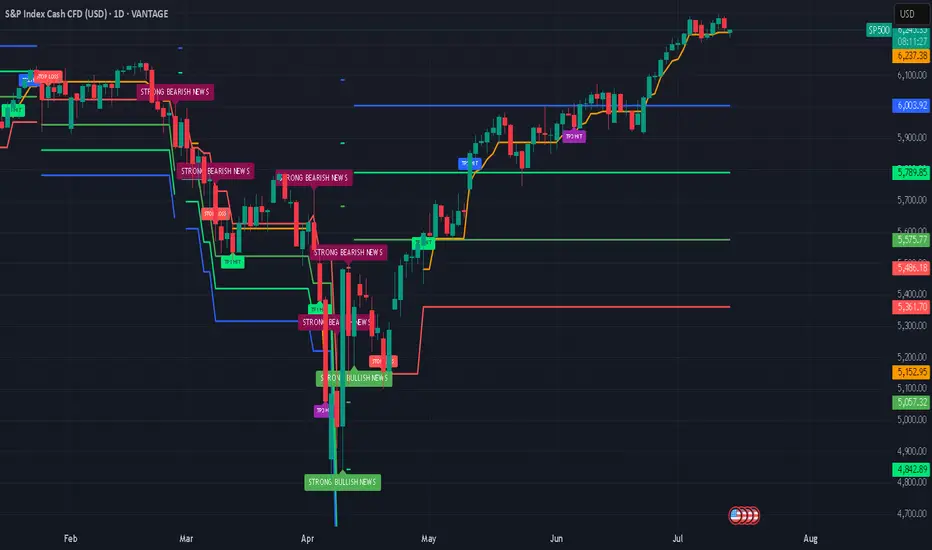
S&P 500: Defying Tariff Headwinds, Breaking RecordsThe S&P 500 has staged a remarkable rally in 2025, shattering all-time highs and capturing global attention. This surge has unfolded despite the negative economic overhang of renewed tariff threats and ongoing trade tensions, raising critical questions for investors: How did the market overcome such headwinds, and what lies ahead for both the short and long term?
The Rally Against the Odds
Tariff Turbulence: Earlier this year, President Trump announced sweeping new tariffs, sparking fears of supply chain disruptions and higher costs for American companies. Historically, such moves have triggered volatility and corrections.
Market Resilience: Despite these concerns, the S&P 500 not only recovered losses from the spring but surged to new record highs, with the index climbing over 23% since April’s lows. Major tech companies, especially those leading in AI and innovation, have been at the forefront of this advance.
Investor Sentiment: The rally has been fueled by optimism around potential Federal Reserve rate cuts, robust corporate earnings, and expectations of long-term economic growth—even as the immediate impact of tariffs remains uncertain.
Short-Term Correction: A Healthy Pause?
While the long-term outlook remains bullish, several indicators suggest the market may be due for a short-term correction:
Narrow Market Breadth: The current rally has been driven by a handful of mega-cap stocks, leaving the median S&P 500 stock well below its own 52-week high. Historically, such narrow leadership often precedes periods of consolidation or pullbacks.
Valuation Concerns: Stock valuations are at elevated levels, and some analysts warn that earnings growth could slow as companies adapt to higher input costs and shifting trade policies.
Correction Forecasts: Some strategists predict the S&P 500 could correct to around 5,250 by the third quarter of 2025, citing factors like slowing consumer spending and persistent policy uncertainty.
Long-Term Outlook: Higher Highs Ahead
Despite the potential for near-term volatility, the long-term trajectory for the S&P 500 remains positive:
Fed Policy Tailwinds: Anticipated rate cuts and lower bond yields are expected to provide further support for equities, encouraging risk-taking and higher valuations.
Corporate Adaptation: Companies are actively offsetting tariff impacts through cost savings, supply chain adjustments, and strategic pricing.
Growth Sectors: Innovation in technology, productivity gains, and deregulation are setting the stage for sustained profit growth, especially in sectors like AI, robotics, and defense.
Key Takeaways for Investors
Stay Disciplined: While a short-term correction is possible, history shows that markets often rebound strongly after periods of volatility.
Diversify Exposure: With market gains concentrated in a few names, diversification and active stock selection are more important than ever.
Focus on Fundamentals: Long-term investors should look beyond headlines and focus on companies with resilient earnings and adaptive business models.
The S&P 500’s ability to break records in the face of tariff headwinds is a testament to the underlying strength and adaptability of the U.S. economy. While short-term bumps are likely, the path ahead still points toward new highs for those with patience and perspective.
This article is for informational purposes only and does not constitute investment advice. Always consult with a financial advisor before making investment decisions.
#spx500 #stockmarket #analysis #economy #us #nasdaq #fed #bonds #rates #trading
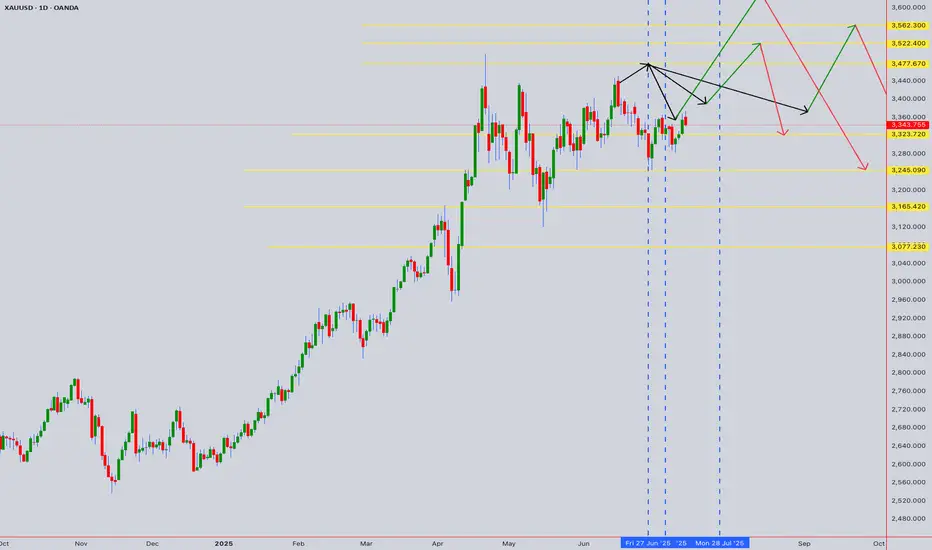
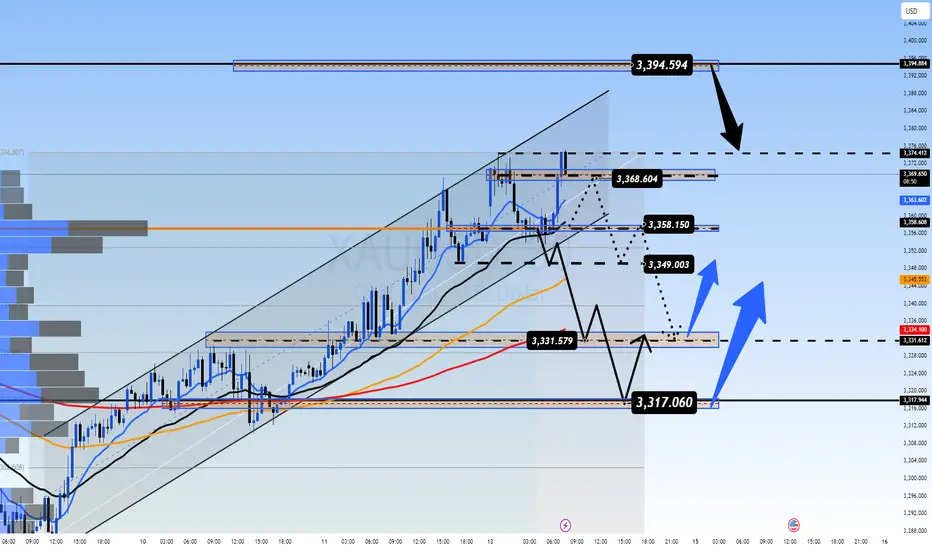
Early Week Pullback Ahead of Key Economic ReleasesGold Outlook – 14 July | Early Week Pullback Ahead of Key Economic Releases
🌍 Market Sentiment & Macro Overview
Gold has started the week with a sharp retracement after filling prior liquidity gaps (FVG) from the past two weeks.
This early weakness signals a risk-off tone as traders adopt a cautious stance ahead of a heavy macroeconomic calendar and geopolitical trade discussions.
This week’s high-impact events include:
📌 US CPI (Inflation Data)
📌 US PPI (Producer Prices)
📌 Unemployment Claims
📌 Retail Sales Figures
These data points will likely set the tone for price action through the second half of the week, with potential for sharp moves in gold.
📉 Technical Snapshot – M30 Chart Structure
Price swept minor liquidity above recent highs
Pulled back by more than $15 from the short-term top
Currently trading below the intraday VPOC (~3358), suggesting short-term bearish momentum
If the selling pressure holds, we may see a move toward:
⚠️ 333x zone — initial liquidity pool
❗ 332x zone — deeper liquidity grab before any bullish reversal
🧭 Trading Plan – Key Zones and Setup
📥 Buy Setup: 3331 – 3329 (Zone of Interest)
Stop Loss: 3325
Target Levels:
TP1: 3335
TP2: 3340
TP3: 3344
TP4: 3350
TP5: 3360 – 3370
✅ A highly reactive zone — ideal for intraday long setups if price sweeps into this area and shows bullish confirmation (e.g., volume spike or rejection wick).
📤 Sell Setup: 3393 – 3395 (Resistance Re-Test)
Stop Loss: 3399
Target Levels:
TP1: 3390
TP2: 3386
TP3: 3382
TP4: 3378
TP5: 3374 – 3370 – 3360
📉 Potential scalp zone if price retests resistance with signs of exhaustion. Monitor closely for bearish structure confirmation.
📊 Key Support & Resistance Levels
Resistance Zones:
3358
3368
3374
3394
Support Zones:
3349
3340
3331
3318
These zones remain relevant for both momentum trades and reversion setups.
⚠️ Strategy Considerations
At the time of writing, gold is trading indecisively around the M30 VPOC. No clear breakout has occurred yet.
⏳ Wait for volume confirmation during the London session
🚫 Avoid impulsive entries based on emotions or FOMO
✅ Stick to your risk parameters and let price come to your level
🧠 Summary & Bias
Gold is experiencing an early-week technical correction after recent strength.
The market is in "wait-and-see" mode, with macro drivers likely to dictate direction from mid-week onwards.
📍 Watch the 3331–3329 zone closely — it remains the most attractive level for long setups.
📍 The 3393–3395 zone is a key area to fade strength if price struggles at resistance.
Patience and precision are key this week. Let the market reveal its intention, and trade accordingly.
Fundamental Market Analysis for July 14, 2025 EURUSDThe euro remains under pressure: on Monday the pair slipped to 1.16750 after the European Commission extended its pause on retaliatory tariffs against the United States until 1 August. With no resolution in sight, the trade dispute keeps European exporters on edge and turns the dollar into a safe-haven choice for investors looking to limit risk.
Additional support for the greenback comes from rising real yields. The 10-year U.S. Treasury rate is holding above 4.40 %, locking in a wide spread over German Bunds. That has led futures traders to price in just one 25 bp Federal Reserve rate cut for the rest of the year, reducing the euro’s relative appeal.
Macro data from the euro area offer little relief. German industrial production rose only 0.2 % m/m in May, while the July ZEW expectations index slid back into negative territory. With the ECB having already delivered a June cut and projecting lower inflation ahead, inward capital flows to the eurozone remain subdued.
Trading recommendation: SELL 1.16750, SL 1.17050, TP 1.16200

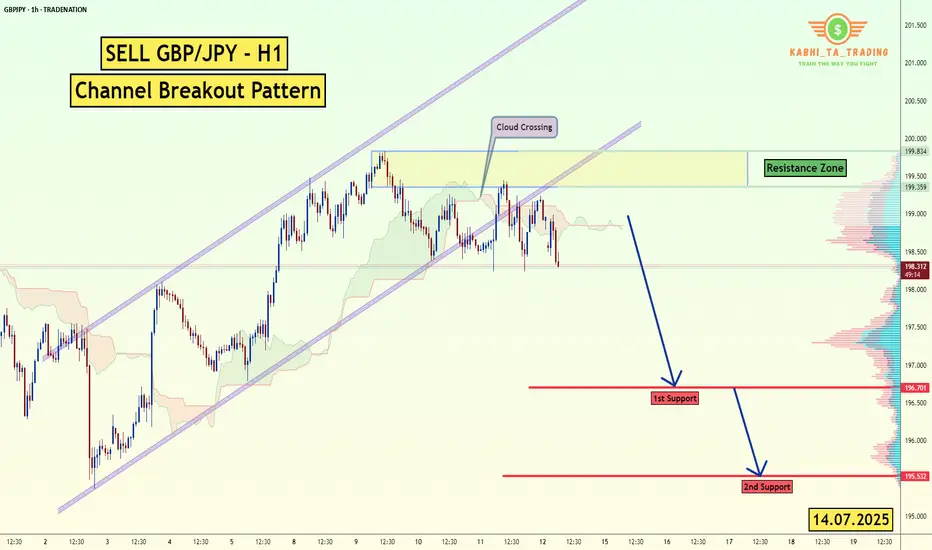
GBP/JPY -H1- Channel Breakout (14.07.2025)The GBP/JPY Pair on the H1 timeframe presents a Potential Selling Opportunity due to a recent Formation of a Channel Breakout Pattern. This suggests a shift in momentum towards the downside in the coming hours.
Possible Short Trade:
Entry: Consider Entering A Short Position around Trendline Of The Pattern.
Target Levels:
1st Support – 196.70
2nd Support – 195.53
🎁 Please hit the like button and
🎁 Leave a comment to support for My Post !
Your likes and comments are incredibly motivating and will encourage me to share more analysis with you.
Best Regards, KABHI_TA_TRADING
Thank you.
Disclosure: I am part of Trade Nation's Influencer program and receive a monthly fee for using their TradingView charts in my analysis.
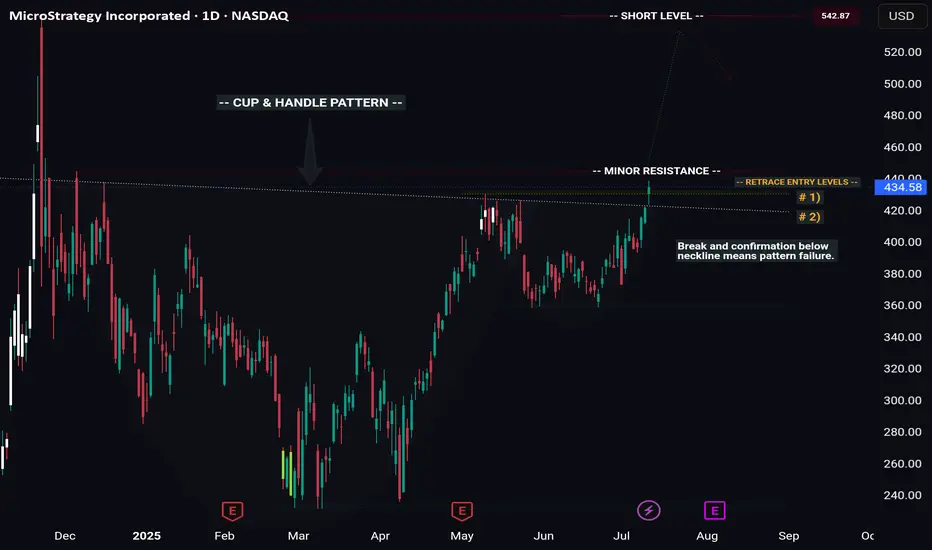
MSTR -- Cup & Handle Breakout // Long & Short SetupsHello Traders!
There is a beautiful cup and handle pattern that has formed on MSTR (Microstrategy).
This pattern offers us a wonderful long setup, as well as a potential short at the all time high.
Pattern Failure: If price both breaks and confirms below the C&P neckline the pattern is void.
Price will likely temporarily pull back from the all time high, giving us our short setup. However you'll want to be in and out quick considering price will likely continue to new highs after pulling back.
I will be swing trading the long setup and likely day trading the short setup.
Have fun and best of luck to everyone on their trading journey!
Looking for catalysts - Gold Outlook July 7 - July 11, 2025All about last week you can find here:
FX_IDC:XAUUSD Gold is currently seeking fresh catalysts this week. 🧐
While the economic calendar appears light for this time of year, a lack of economic data doesn't mean nothing is happening. Geopolitical events, especially tariff wars or other flashpoints, remain significant. Are there increasing signs for peace in the Middle East between Israel and Hamas? 🕊️
This week Gold could take advantage from an exisiting reversal head and shoulders pattern and painting pitchfork in the chart shows possibillities for Upside targeting $3400.
## Geopolitical News Landscape 🌍📰
Israel / Iran ⚔️🛑☢️
After fierce clashes in June, a **ceasefire** began June 24. 🇮🇷 Iran's Supreme Leader reappeared July 6, claiming victory 🎤. Tehran has now **banned IAEA inspectors** ❌🔍. Over 900 Iranians reportedly killed ⚰️.
🔮 Outlook: ⚠️ Nuclear tensions growing, diplomacy frozen 🧊. Regional powers remain on high alert 🚨.
India / Pakistan 🗻🔫🕌
Tense calm in Kashmir 😐. India launched its sacred **Amarnath Yatra** 🕉️ under heavy security 🛡️. Pakistan killed 30 militants near the Afghan border ⚔️, while China 🐉 admitted sharing intel 📡.
🔮 Outlook: Diplomatic track stays open 🕊️, but **border flare-ups** and water disputes 💧 remain volatile 🔥.
Gaza Conflict 💣🏘️🕊️
Israel launched deadly airstrikes ✈️, including one on a beach café ☕🏖️ killing 22. Dozens more died 💔. IDF admitted accidental strikes on aid sites 🚚❌. U.S.-led talks seek a **60-day truce** 🤝.
🔮 Outlook: Ceasefire possible 🛑, but **humanitarian crisis** worsening 🚨🩺. Trust remains fragile 💔.
Russia / Ukraine ⚔️
Zelenskyy 🇺🇦 and Trump 📞 discussed new air defense aid 🎯. Russia answered with **massive drone strikes** on Kyiv 🚁🔥. NATO boosts arms shipments 🔫 and backs Ukraine’s domestic weapons production 🏭.
🔮 Outlook: War grinds on ⚙️. No peace in sight, with **global stakes** rising 📈.
U.S. / China Trade War 💼📦🔥
With new tariffs looming 📆💣, Treasury said “multiple deals” are near 🤝. Trump claimed a **partial deal with China** 🐉, though tariffs remain high 📊.
🔮 Outlook: More piecemeal deals 🍰, but a **full-scale trade reset** looks unlikely before elections 🗳️.
🌍 Global Trade War 📉🚢💸
Trump’s shifting tariffs 🎯 hurt global growth 🌐. Markets hit record highs 📈 but investment chills ❄️. The 💵 dollar had its sharpest 6-month drop 📉 in decades.
🔮 Outlook: Businesses remain cautious ⚠️. **Supply chains** reroute 🔄. No global rebound without clarity 🔍.
Trump vs. Powell 💥🏛️📉
Trump demanded Powell’s resignation ❌📉, accusing him of weak rate policy 📊. Powell held firm 🧊, citing inflation risks 📈. Trump eyes replacements 👀🪑.
🔮 Outlook: Fed independence 🏛️ under fire 🔥. **Rate policy** may get politicized ahead of 2025 elections 🗳️.
📈 U.S. Inflation 🛒💰🧾
Inflation slowed to 0.1% 🐢, but tariffs raised prices on appliances 🔌 (+4.3%) and toys 🧸. Fed projects 3% inflation by year-end 📊.
🔮 Outlook: As **tariffs bite** 🦷, inflation likely to climb 📈. Fed stays cautious 🧐 on cuts.
Technical View 📐📈
Analysis Period: May 25 - June 6, 2025 | Forecast: June 7-11, 2025
1. ICT (Inner Circle Trader) Methodology Analysis 🧠
Market Structure
Higher Timeframe Bias: The chart shows a clear bullish market structure with higher highs and higher lows from the major low around 3,250. 🐂
Current Structure: Price is in a consolidation phase after reaching highs near 3,370, showing potential distribution. ⚖️
Key ICT Concepts Identified:
Fair Value Gap (FVG): Multiple gaps visible during the strong rally from 3,250 to 3,370. 💨
Order Blocks: Significant demand zone around 3,250-3,260 level (major accumulation area). 📦
Liquidity Zones:
Buy-side liquidity above 3,370 (recent highs). 💸
Sell-side liquidity below 3,320 (recent consolidation lows). 📉
Market Maker Models: Classic accumulation-manipulation-distribution pattern visible. 🔄
Session Analysis:
London Session: Shows strong directional moves. 🇬🇧
New York Session: Continuation of trends with increased volatility. 🗽
Asian Session: Consolidation and range-bound behavior. 🌏
2. Gann Analysis 🧙♂️
Gann Angles & Time Cycles:
Primary Trend: 1x1 angle supporting the bullish move from 3,250. ↗️
Resistance Angles: 2x1 and 3x1 angles providing resistance around current levels. 🚧
Time Cycles:
7-day cycle showing completion around June 2-3. 🗓️
14-day cycle suggesting potential reversal window June 7-9. ⏳
Gann Price Levels:
Major Support: 3,250 (1/8 level). 🛡️
Current Resistance: 3,370 (7/8 level). 🛑
Next Target: 3,400 (full octave completion). 🎯
Geometric Relationships:
Price squared relationship suggests 3,380-3,400 as natural resistance. 📐
Time-price balance indicates consolidation period before next major move. 🕰️⚖️
3. Fibonacci Analysis ✨
Retracement Levels (from 3,250 low to 3,370 high):
23.6%: 3,341.6
38.2%: 3,324.2
50.0%: 3,310.0
61.8%: 3,295.8
78.6%: 3,265.6
Extension Levels:
127.2%: 3,402.6
161.8%: 3,444.2
200.0%: 3,490.0
Current Analysis:
Price has respected the 23.6% retracement level multiple times. ✅
Strong support confluence at 38.2% level (3,324). 💪
Extension targets suggest potential move to 3,402-3,444 range. 🚀
4. Institutional Levels Analysis 🏦
Psychological Levels:
3,300: Major round number providing support. 💯
3,350: Mid-level resistance. 📊
3,400: Next major psychological target. 🎯
Institutional Order Flow:
Accumulation Zone: 3,250-3,280 (heavy institutional buying). 💰
Distribution Zone: 3,350-3,370 (profit-taking area). 💸
Breakout Target: 3,400+ (next institutional objective). ⬆️
Volume Analysis:
High volume on the initial move up from 3,250. 📈
Decreasing volume during consolidation (typical distribution pattern). 📉
Volume expansion needed for breakout confirmation. 💥
5. Cycle Timing Analysis ⏰
Short-Term Cycles:
3-day cycle: Currently in compression phase. 🤏
7-day cycle: Completed around June 2-3. ✅
14-day cycle: Due for completion June 7-9. ⏳
Medium-Term Cycles:
Monthly cycle: Bullish momentum phase. ⬆️
Quarterly cycle: In expansion phase. 🌟
Cycle Projection:
Next major cycle turn expected June 7-9. 🔄
Potential for either breakout or correction during this window. 🤞
6. FORECAST: June 7-11, 2025 🔮
Primary Scenario (60% probability): Bullish Breakout 🚀
Target 1: 3,400-3,410
Target 2: 3,440-3,450
Catalyst: Break above 3,370 with volume. 💥
Timeline: June 7-9 initial move, June 10-11 extension.
Secondary Scenario (35% probability): Corrective Pullback ⬇️
Target 1: 3,320-3,325 (38.2% Fibonacci)
Target 2: 3,300-3,310 (psychological support)
Catalyst: Failure to break 3,370 resistance. 🚫
Timeline: June 7-8 decline, June 9-11 consolidation.
Low Probability Scenario (5% probability): Deep Correction 📉
Target: 3,280-3,290 (61.8% Fibonacci)
Catalyst: Major risk-off sentiment. 😱
Timeline: Extended throughout the week.
7. Key Assumptions & Risk Factors 🤔
Bullish Assumptions:
Continued institutional accumulation at current levels. 🏦
Breakout above 3,370 with confirming volume. ⬆️
Favorable macroeconomic backdrop for gold. 🌍
Weakness in USD supporting gold prices. 💵
Geopolitical tensions maintaining safe-haven demand. 🕊️
Bearish Risk Factors:
Profit-taking at psychological 3,400 level. 🤝
Stronger USD due to economic data. 💹
Reduced safe-haven demand. 📉
Technical failure at key resistance levels. 🚧
Central bank policy shifts. 🏛️
8. Trading Recommendations 💡
Entry Strategies:
Bullish Setup: Buy on pullback to 3,340-3,345 with stop below 3,320. 🎯
Breakout Play: Buy break above 3,372 with stop below 3,350. 🚀
Conservative: Wait for retest of 3,324 support area. patiently 🧘
Risk Management:
Position Size: Limit to 2-3% of portfolio per trade. 📏
Stop Loss: Always use stops below key support levels. ⛔
Take Profit: Scale out at Fibonacci extension levels. 💰
Key Levels to Watch:
Immediate Resistance: 3,365-3,370 🛑
Support: 3,340-3,345 🛡️
Breakout Level: 3,372 🚀
Major Support: 3,320-3,325 💪
9. Conclusion ✅
The XAUUSD chart presents a constructive bullish setup with multiple confluences supporting higher prices. The completion of various cycles around June 7-9 suggests a potential catalyst for the next major move. While the primary bias remains bullish targeting 3,400+, traders should remain alert to the possibility of a corrective pullback to test lower support levels. 🧐
The institutional accumulation pattern, combined with favorable Gann angles and Fibonacci projections, supports the bullish thesis. However, proper risk management is essential given the potential for volatility around key psychological levels. ⚠️
Please take the time to let me know what you think about this. 💬
-------------------------------------------------------------------------
This is just my personal market idea and not financial advice! 📢 Trading gold and other financial instruments carries risks – only invest what you can afford to lose. Always do your own analysis, use solid risk management, and trade responsibly.
Good luck and safe trading! 🚀📊