GOLD TRADING PLAN – After Breaking ATH & Sharp CorrectionGOLD TRADING PLAN – After Breaking ATH & Sharp Correction
🔥 Former U.S. President Donald Trump has officially announced a comprehensive global tariff policy, targeting multiple countries and regions. This sparked:
📉 A major sell-off in risk assets
💵 A sharp weakening in the U.S. Dollar
🪙 A strong rally in gold, reaching a new All-Time High (ATH) at 3167 as a preferred safe-haven asset
📉 Latest Market Reaction – Gold Corrects from ATH
After a strong bullish breakout, gold is now pulling back from its peak, driven by profit-taking and investor caution ahead of key economic data — including the upcoming Nonfarm Payrolls (NFP) report.
Despite the short-term pullback, the overall trend remains bullish on higher timeframes.
📐 Technical Overview
Yesterday, we identified and traded a symmetrical triangle pattern, which broke out sharply as expected. Now, price is retesting previous breakout zones — where new long opportunities may form.
📌 Focus on BUY setups during the Asian & EU sessions, and be cautious during the U.S. session due to expected volatility.
🔍 Key Technical Levels
🔺 Resistance Levels:
3167 (ATH) – 3175 – 3185 – 3198 – 3206
📝 (These are psychological levels & Fibonacci extensions. Wait for clear candle confirmation before entering.)
🔻 Support Levels:
3140 – 3132 – 3120 – 3112 – 3106 – 3100
🛒 TRADE PLAN
🟢 BUY ZONE: 3112 – 3110
🛑 Stop Loss: 3106
🎯 Take Profits: 3116 – 3120 – 3124 – 3128 – 3132 – 3136 – 3140
🔴 SELL ZONE: 3167 – 3169
🛑 Stop Loss: 3173
🎯 Take Profits: 3162 – 3158 – 3154 – 3150
⚠️ Final Notes
📈 The uptrend is still in play — no need to FOMO sell near the highs.
⏳ Be patient, wait for price to react at key support/resistance zones.
🚫 Avoid overtrading or rushing into trades — tariff news has major global impact.
📅 Stay sharp ahead of Friday’s NFP release — we'll reassess trend direction after the data.
✅ Stick to your risk management: follow your TP/SL strictly.
Wishing you safe & profitable trades! 💼📊
Analysis

Gold (XAU/USD) : Bullish Setup with Key Demand Zone🔹 Trend Line & Demand Zone 📈
* The trend line shows an upward trend. 🚀
* The demand zone 🟦 acts as strong support, where buyers are likely to step in.
🔹 Price Action 🔍
* Price is bouncing off the demand zone ➡️ Bullish Signal 📊🔥
* Higher lows forming, indicating potential upward momentum.
🔹 Trade Setup 🎯
✅ Entry Point: Near the demand zone 🟦
❌ Stop Loss: 🔽 3,099.26 (Below demand zone)
🎯 Target Point: ⬆️ 3,148.58 (Key resistance area)
🔹 Expected Movement 🏆
* A slight pullback 📉 before a strong push up 📈💪
* If price holds the demand zone, 🚀 potential rally ahead!
🔹 Risk-to-Reward Ratio ⚖️
* Favorable trade setup ✅ High reward, controlled risk 🎯
🔹 Final Verdict 🔥
📊 Bullish Bias ✅ As long as demand zone holds!
🚨 Warning: If price breaks below 3,099.26, expect further downside!

USD/JPY(20250403)Today's AnalysisMarket news:
US trade policy-① Trump signed an executive order to establish a 10% "minimum base tariff" for all countries, and will impose reciprocal tariffs, including 20% for the EU, 24% for Japan, 46% for Vietnam, and 25% for South Korea. The tariff exemption for goods that meet the USMCA will continue, and the tariff for those that do not meet the requirements will remain at 25%; ② The US Treasury Secretary called on countries not to retaliate; ③ The base tariff will take effect on April 5, and the reciprocal tariff will take effect on the 9th. In addition, the 25% automobile tariff will take effect on the 3rd, and the automobile parts tariff will take effect on May 3rd; ④ Gold bars, copper, pharmaceuticals, semiconductors and wood products are also not subject to "reciprocal tariffs".
Today's buying and selling boundaries:
149.61
Support and resistance levels
150.97
150.46
150.13
149.08
148.75
148.24
Trading strategy:
If the price breaks through 148.75, consider buying, the first target price is 149.08
If the price breaks through 148.24, consider selling, the first target price is 148.00

Fundamental Market Analysis for April 3, 2025 EURUSDEUR/USD saw a bullish spike on Wednesday after the Trump administration announced tariffs that were less severe than many investors expected given President Donald Trump's flurry of tariff threats over the past 72 days. While the specific tariff proposals are unclear, U.S. consumers should prepare for flat 10 percent tariffs on all imports, significant 25 percent tariffs on all automobiles and auto parts, and “reciprocal” tariffs imposed at different rates depending on the country.
In addition, Trump has reiterated his intention to impose additional tariffs on goods such as copper, microchips, and other important imported consumer goods that are vital to the U.S. economy. As these tariffs are likely to drive up consumer prices in the coming months and there is no obvious alternative in the market to obtain foreign goods without incurring high import duties, inflationary pressures are expected to rise soon and persist longer than desired. According to Federal Reserve (Fed) officials, the uncertainty of the Trump administration's trade policy is likely to keep interest rates elevated for an extended period beyond previous expectations.
European economic indicators are likely to remain moderately light for the rest of the trading week. Meanwhile, new US Non-Farm Payrolls (NFP) data is expected this Friday. The NFP report could have a significant impact on the markets as the US economy moves into a post-tariff phase, and the March labor statistics will be a key indicator of the impact of the Trump administration's tariff strategy.
Trading recommendation: BUY 1.09100, SL 1.08400, TP 1.10300


EURO - Price can bounce from support level to top part of flatHi guys, this is my overview for EURUSD, feel free to check it and write your feedback in comments👊
Some days ago, price entered a wedge pattern, bounced down from the resistance line to the support line, and broke the $1.0415 level.
Next, the price turned around and started to grow. In a short time, it rose to the $1.0415 level and broke one more time.
Then, price some time traded between resistance line with $1.0415 level and later corrected to support line of wedge.
After this, EUR made a strong upward impulse, thereby exiting from wedge pattern and starting to trades inside flat.
In flat, price reached top part and then made a correction movement to $1.0735 support level and turned around.
In my mind, Euro can correct to support level and then rise to $1.0950 top part of flat.
If this post is useful to you, you can support me with like/boost and advice in comments❤️

ADP in Focus: Will Strong Jobs Data Trigger Gold Pullback?🟡 GOLD MARKET BRIEF – Early Asian Surge Meets Resistance Ahead of Key US Jobs Data
Gold kicked off the day with a sharp rally during the Asian session, driven by consistent demand from Asian and Middle Eastern investors — a pattern we’ve seen forming repeatedly during early sessions lately.
However, price reacted swiftly at the 3130–3135 resistance zone, exactly as mapped out in yesterday’s trading plan. With sellers stepping in again, my outlook remains:
🔻 Look for reaction-based SELL opportunities in the Asian and London sessions, especially if price pulls back into key resistance.
📉 Technical Outlook:
Gold is approaching the apex of a symmetrical triangle pattern, suggesting a breakout is imminent.
✅ As always: Wait for the breakout — then trade the retest in the confirmed direction.
📰 Fundamental Focus:
All eyes today will be on the US ADP Non-Farm Employment report, which tends to offer early clues ahead of Friday’s NFP.
Should the data come in stronger than expected, USD could gain traction — likely applying downward pressure on Gold, in line with our target zone around 308x–307x.
🧭 Key Technical Levels:
🔺 Resistance: 3128 – 3135 – 3142 – 3148
🔻 Support: 3110 – 3100 – 3080 – 3070
🎯 Trade Plan:
🟢 BUY ZONE: 3102 – 3100
SL: 3096
TP: 3106 – 3110 – 3114 – 3118 – 3122 – 3126 – 3130
🔴 SELL ZONE: 3148 – 3150
SL: 3154
TP: 3144 – 3140 – 3136 – 3132 – 3128 – 3124 – 3120
📌 Caution: With ADP on deck during the US session, expect a spike in volatility.
Stick to clear levels, protect capital, and trade with discipline — not emotion.
Let the market come to you.
— AD | Money Market Flow

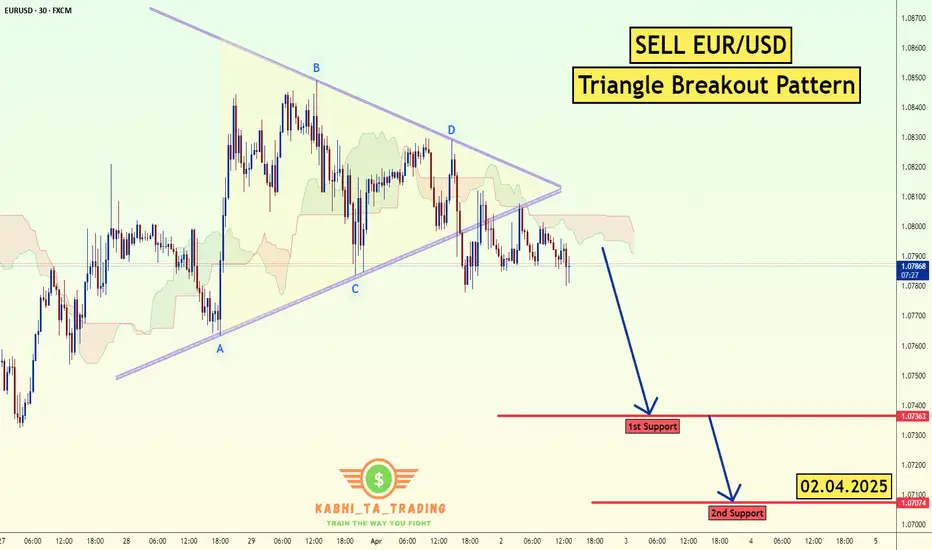
EUR/USD Triangle Breakout (02.04.2025)The EUR/USD Pair on the M30 timeframe presents a Potential Selling Opportunity due to a recent Formation of a Triangle Breakout Pattern. This suggests a shift in momentum towards the downside in the coming hours.
Possible Short Trade:
Entry: Consider Entering A Short Position around Trendline Of The Pattern.
Target Levels:
1st Support – 1.0736
2nd Support – 1.0707
🎁 Please hit the like button and
🎁 Leave a comment to support for My Post !
Your likes and comments are incredibly motivating and will encourage me to share more analysis with you.
Best Regards, KABHI_TA_TRADING
Thank you.
Fundamental Market Analysis for April 2, 2025 USDJPYThe Japanese Yen (JPY) fails to capitalise on the previous day's modest gains against its US counterpart and attracts fresh sellers during Wednesday's Asian session. The USD/JPY pair, however, remains in the range it has been in since the beginning of this week as traders await a new catalyst before positioning for the next leg of directional movement. As such, attention will remain focused on US President Donald Trump's announcement of retaliatory tariffs later today.
Meanwhile, speculation that the slowdown in the economy caused by the tariffs may force the Bank of Japan (BoJ) to keep policy steady for now is undermining the yen. However, investors seem convinced that the BoJ will continue to raise interest rates amid signs of rising inflation in Japan. This is a significant divergence from the growing confidence that the Federal Reserve (BoJ) will resume its rate-cutting cycle in June, and should support the lower-yielding Japanese Yen.
Trade recommendation: SELL 150.00, SL 150.90, TP 148.60

USD/JPY(20250402)Today's AnalysisToday's buying and selling boundaries:
149.55
Support and resistance levels
150.70
150.27
149.99
149.11
148.83
148.40
Trading strategy:
If the price breaks through 149.99, consider buying, the first target price is 150.27
If the price breaks through 149.55, consider selling, the first target price is 149.11

USOIL Daily Analysis: Bullish Reversal from Key Support USOIL (WTI Crude Oil) daily chart showing price action analysis.
Key Observations:
Support Zone:
A strong demand zone is marked around $65-$66, which has acted as a reversal area in the past.
The price has recently bounced off this zone, indicating potential buyer interest.
Current Price Action:
Price is currently trading at $68.25.
A bullish move started from the support region, with a higher low formation suggesting potential upside momentum.
Potential Scenario:
The chart suggests a pullback before continuation to the upside.
If the support holds, $70-$72 could be the next target.
If price fails to hold above $66, further downside towards $64 may be possible.
Outlook:
Bullish Bias 📈 as long as the price remains above the demand zone.
Watch for a higher low confirmation before entering a long trade.
Breakout above $70 could signal a stronger rally.

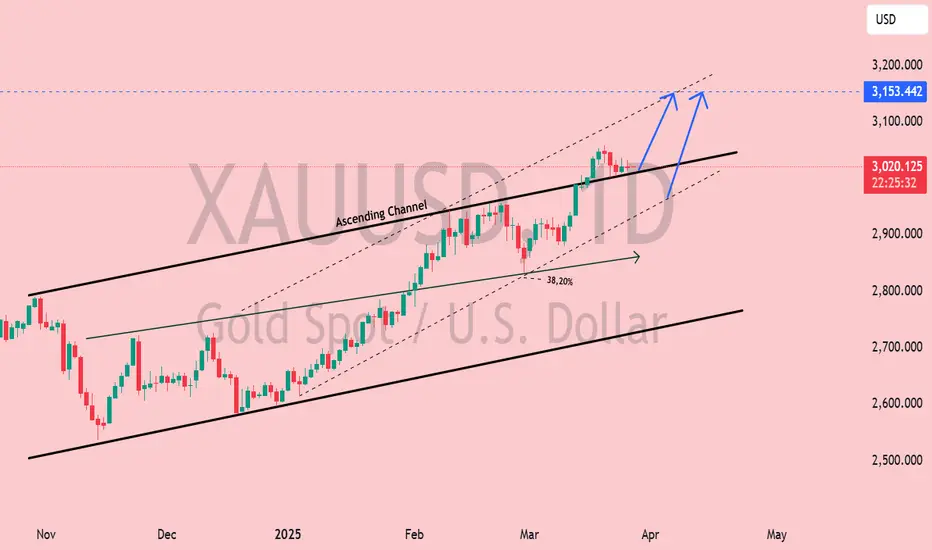
XAU/USD Gold Bullish Momentum – Targeting $3,153+?📊 XAU/USD Daily Analysis – Bullish Continuation in Ascending Channel
🔹 Market Structure & Trend Analysis
Gold (XAU/USD) remains in a well-defined ascending channel, respecting both dynamic support and resistance levels. The trend remains bullish, with higher highs and higher lows forming since late 2024. Currently, price is trading near the upper boundary of the channel, suggesting strong bullish momentum.
🔹 Key Technical Levels
Resistance Zone: $3,153 – $3,200 (potential breakout target)
Current Price: $3,020 (holding above key mid-range support)
Support Levels:
Channel Midline Support: ~$2,980
38.2% Fibonacci Retracement: ~$2,900 (potential corrective zone)
Channel Bottom Support: ~$2,700 (strong demand area)
🔹 Bullish Scenario 🟢
A break and close above $3,153 would confirm a bullish breakout, opening the door for a rally toward $3,200 and beyond.
Momentum remains strong, with price structure favoring continued upside as long as it stays above the midline of the channel.
🔹 Bearish Scenario 🔴
Failure to break above $3,153 could trigger a short-term pullback toward $2,980 - $2,900, where buyers may re-enter.
A confirmed breakdown below the ascending channel would invalidate the bullish setup and expose $2,700 - $2,600 as potential downside targets.
🔹 Conclusion & Trade Considerations
Bias: Bullish as long as price remains inside the ascending channel.
Entry Considerations: Retest of $3,020 - $2,980 as support could offer a high-probability long setup.
Breakout Confirmation: A daily close above $3,153 strengthens the bullish case for continuation.
BITCOIN | 4H | KEY POINTS Hey traders, what's up
I've marked the key levels for Bitcoin on the chart. Right now, it's holding within the 4-hour supply and demand zone. But if this level breaks, I expect Bitcoin to drop all the way down to around $78K.
For spot buyers, there’s no real risk at the moment. But if you're trading on margin and currently in the red, be extra cautious.
The market will liquidate you first, then move on its way.
Big thanks to everyone supporting my analysis with likes
I will provide continuous updates under this analysis.

#COMP #COMPUSDT #Compound #Update #Analysis #Eddy#COMP #COMPUSDT #Compound #Update #Analysis #Eddy
COMPUSDT.P (( 3 Signals Analyzed on the chart ))
Update on the analysis of this currency for you, dear followers,
Everything is very clear on the chart and Important areas of the upper time frame for scalping are identified and named.
This is based on a combination of different styles, including the volume style with the ict style.
Based on your strategy and style, get the necessary confirmations for this scalping setup to enter the trade.
I have analyzed for you the 3 moves that this currency is going to make in its upcoming trends. For you, follow moves 1, 2 & 3 in order according to the comments left on the chart. First, take a long scalp from the first marked point to the red marked lines and then follow the second move. The best short point is to the low demand area, which is the green area. The red line with the entry of snipers is the text. Finally, follow and for the third move in the green marked demand area, look for confirmation for swing trading and also long-term spot investment.
It is never too late to buy and invest. Do not rush and do not be fooled by the positive movements and reactions of the market. Wait for the price to reach its valuable areas. In the analysis of the Compound currency, as you can see, there is a strong demand area that is intact. Be patient until the price falls from the decision or extreme flips to the green area of the important demand area. Be sure to check this currency in your Daily & Weekly time frame and draw the areas. Then refer to the weekly, daily and four-hour time frames and draw the lower time areas and look for confirmation for volatility.
Do not rush to invest and buy spot and let the price reach the support area.
Be successful and profitable.
"In the previous analysis of the Comp currency, we caught a beautiful pump. I hope you enjoyed and benefited from that analysis."
Review and view previous Comp currency analysis :

#PONKE #PONKEUSDT #PONKECOIN #MEMECOIN #MEME #Analysis #Eddy#PONKE #PONKEUSDT #PONKECOIN #MEMECOIN #MEME #Analysis #Eddy
PONKEUSDT.P Higher Time Frame Analysis
⚠️ (( "WARNING" : This is an Requested Analysis & I do not recommend investing large amounts of money in it because it is a meme coin.)) ⚠️
Important areas of the higher time frame are identified and labled.
Everything is clear and I have clearly drawn the important areas in the chart and the labels and names of the areas are included. Depending on your analytical style, you can get the necessary confirmations and see the reduction from the marked areas to the specified targets.
This Analysis is based on a combination of different styles, including the volume style with the ict style.
Based on your strategy and style, get the necessary confirmations for this analysis to buy entery the trade.
Don't forget risk and capital management.
The responsibility for the transaction is yours and I have no responsibility for not observing your risk and capital management.
💬 Note : The price can go much higher than the first target, and there is a possibility of a 200% pump on this currency. By observing risk and capital management, obtaining the necessary approvals, and saving profits in the target, you can keep it for the pump.
Be successful and profitable.

Is This the Start of ETH’s Next Mega Rally?#Ethereum just bounced off its strongest support since 2020! 🔥
This trend has held firm for 5 years, and ETH is respecting it once again.
This could be the start of the next big rally if history repeats.
Bullish momentum loading?
What’s your ETH target for this cycle? 👇

Gold Eyes Fresh Highs Amid Geopolitical Tensions🟡 Gold Eyes Fresh Highs Amid Geopolitical Tensions & Quarter-End Volatility
Gold started April with a strong bullish gap, reaching another all-time high during the Asian session. Price is now trading near the upper bound of a multi-day structure, supported by ongoing geopolitical risks, macro uncertainty, and flight-to-safety flows.
European and UK traders should remain cautious today, as end-of-month volatility may lead to fake breakouts, stop hunts, and liquidity grabs – especially ahead of key U.S. economic data later this week.
🧠 Market Context:
Risk sentiment remains fragile as global equities faced pressure overnight.
Safe haven demand is elevated following weekend headlines tied to geopolitical conflict and natural disaster risks in Asia.
Traders are also watching the market’s reaction to Trump’s softened tone on tariffs — potentially shifting macro flows in risk assets.
🔍 Technical Outlook:
Price action remains bullish overall, but the pair is extended at current levels.
Expect high volatility today as monthly candles close — with a chance of both upside wicks and liquidation dips.
Scalping or reacting at well-defined zones is preferred over chasing.
🧭 Key Technical Levels:
🔺 Resistance: 3158 – 3166 – 3172 – 3180
🔻 Support: 3133 – 3122 – 3111 – 3100
🎯 Trading Plan:
🟢 BUY ZONE: 3122 – 3120
SL: 3116
TP: 3126 – 3130 – 3134 – 3138 – 3142 – 3146 – 3150
🔴 SELL ZONE: 3170 – 3172
SL: 3176
TP: 3166 – 3162 – 3158 – 3152 – 3148 – 3144 – 3140
⚠️ Final Note:
Today’s session could be chaotic with month-end flows and low liquidity pockets.
Stick to clean setups. Wait for confirmation. Always use SL/TP.
📌 If you found this plan helpful, like & follow for daily setups and institutional-level insights.
📊 Trade with structure, manage your risk, and let the market come to you.

ETH - When will this downtrend finally stop?Ethereum (ETH) has been stuck in a prolonged downtrend, and the bearish scenario is now playing out. On the 4-hour chart, ETH recently broke below its rising trend line after forming a rising wedge that typically signals further downside. This breakdown confirms the potential for further downside.
At the same time, on the weekly timeframe, ETH has perfectly retested its resistance and failed to push higher, reinforcing overall market weakness. With failing to break resistance it is likely that ETH could face continued weakness and move towards the weekly support area at 1500.
Thanks for your support.
- Make sure to follow me so you don't miss out on the next analysis!
- Drop a like and leave a comment!

#COMP #COMPUSDT #Compound #Analysis #LONG #Eddy#COMP #COMPUSDT #Compound #Analysis #LONG #Eddy
COMPUSDT.P Ready For Long Entry
Important areas have been identified, the entry point has been touched in advance, and the pullback has been made on a lower timeframe, and it is ready to long entry upon receiving confirmation.
This is based on a combination of different styles, including the volume style with the ict style.
Based on your strategy and style, get the necessary confirmations for this scalping setup to enter the trade.
Don't forget risk and capital management.
The responsibility for the transaction is yours and I have no responsibility for not observing your risk and capital management.
Note: The price can go much higher than the second target, and there is a possibility of a 40% pump on this currency. By observing risk and capital management, obtaining the necessary approvals, and saving profits in the targets, you can keep it for the pump.
Be successful and profitable.

Gold Spot (XAU/USD) Price Analysis – Key Zones & Potential Movem🔵 Key Price Levels:
Current price: 🟠 $3,130.99
DEMA (9): 🔵 $3,138.21
Target price: 🎯 $3,174.92
📌 Zones Identified:
🟢 Demand Zone (Support) ⬇️: Strong buying interest, potential bounce area. If price falls here, buyers may step in.
🟡 RBR Zone (Rally-Base-Rally) 🔄: A mid-level area where price could consolidate before moving up.
🔴 Supply Zone (Resistance) ⬆️: Sellers might emerge, causing a reversal or slowdown in price movement.
📈 Potential Price Action:
🔹 Scenario 1 (Bullish 🐂): A retrace to the RBR Zone 🟡 could lead to a bounce 📈 toward the Target 🎯 at $3,174.92.
🔹 Scenario 2 (Bearish 🐻): If price drops below the Demand Zone 🟢, it may signal a trend reversal 📉.
🔹 Breakout Confirmation: If price breaks above the Supply Zone 🔴, it may continue rallying 🚀 toward the target point.

Fundamental Market Analysis for April 1, 2025 GBPUSDOn Monday, the GBP/USD pair was traversing the charts in familiar territory, passing a familiar accumulation zone as investors awaited the latest iteration of US President Donald Trump's tariff threats. The Trump administration intends to enact a broad catalog of tariffs against virtually all US trading partners starting April 2.
Specific details of the Trump administration's tariff plans this week remain vague and elusive, but the main tariff threats remain “retaliatory” tariffs on all countries that have their own tariffs on imports of U.S. goods, regardless of the economic context. Retaliatory tariffs on Canada and the European Union are also expected, as well as additional flat tariffs on copper and automobiles.
The UK economic data release schedule remains loose this week, however, fresh US Nonfarm Payrolls (NFP) employment data is due out later this week. The release of NFP could be an important factor for the markets as the US economy transitions into a post-tariff economic environment, and the March labor data will serve as an “indicator” of the impact of the Trump team's tariff plans.
Trading recommendation: SELL 1.29250, SL 1.30000, TP 1.28650

AUD/USD 1-hour downtrend - Will 0.6200 Trigger a Reversal?The AUD/USD pair has been trending downward on the 1-hour chart, maintaining strong bearish momentum. In its latest move lower, it formed a significant 1-hour Fair Value Gap (FVG), aligning closely with the 0.786 Fibonacci retracement level.
Given this confluence, there is a possibility that AUD/USD could revisit this level to reject and continuing its decline. However, if bearish pressure persists, the pair may extend its drop toward the key 4-hour support at 0.6200.
A potential bullish engulfing candle at this 0.6200 support level could signal a shift in market structure, indicating a possible change of character to the upside. However, it is still uncertain if we will revisit this 4-hour support.

HelenP. I Gold is still rising and can reach 3115 pointsHi folks today I'm prepared for you Gold analytics. Some time ago, the price tested Support 2 at the 2985 level, which coincided with the support zone between 2985 and 2976 points. This area provided strong support, resulting in a bullish reaction that pushed Gold significantly higher. After bouncing from this key support zone, the price began a steady upward movement, eventually breaking above Support 1 at the 3055 level. This breakout was an important signal, as buyers continued to dominate, driving Gold further up. Following this breakout, the price continued its bullish momentum, clearly holding above the trend line, which has repeatedly acted as reliable support during this rise. Recently, Gold reached the support zone at 3055-3065 points again, retested it, and confirmed the strength of the buyers with a quick upward reaction. Currently, the price is trading comfortably above this support zone and remains firmly bullish in structure. Given the recent bullish impulse, the successful retest of the support zone, and the continuing hold above the trend line, I expect the price to move upward toward my current goal at 3115 points. If you like my analytics you may support me with your like/comment ❤️
