CADJPY analysis for a Sell!!!!Here’s a sell-side analysis for CAD/JPY on the 2H chart based on your updated screenshot:
⸻
Pair: CAD/JPY
Timeframe: 2H
Current Price: ~104.656
Market Bias: Short-term bearish shift from previous bullish trend
⸻
Sell Analysis Overview:
1. Bearish Structure Forming Below 105.300–105.600
• Price recently broke below a major support zone (~105.300–105.600), which is now turning into a resistance zone.
• This rejection aligns with the concept of structure flipping — previous support now acting as resistance.
• The marked “Sell Structure Forming Below” zone highlights this key area for short positions on pullbacks.
2. Multiple Rejections at 105.866
• There are clear lower highs forming, with repeated rejections around 105.866 (circled).
• Each attempt to push higher has failed, showing strong bearish pressure and exhaustion from buyers.
3. Breakdown of Key Moving Averages
• Price has closed below both the 50 EMA and 100 EMA, which are beginning to curl downward — a common signal of a trend reversal.
• Momentum has shifted, and sellers are currently in control.
4. Liquidity Grab + Breakdown
• After a false breakout to the upside, price grabbed liquidity around 105.866 and quickly reversed.
• This aligns with smart money behavior: sweeping highs before dropping — a classic bearish trap.
5. Short-Term Target Zone
• The current bearish move has a clear downside target in the 103.600–103.800 zone, which is marked as an “Area of Liquidity”.
• If this zone breaks cleanly, extended targets sit around 101.800–101.400, where fresh demand and buy structure are likely to form.
⸻
Sell Plan & Risk Management:
• Entry Idea: Wait for a pullback into the 105.300–105.600 zone to look for bearish confirmation (e.g., bearish engulfing, rejection wick).
• Stop Loss: Above 105.866 (invalidates structure)
• Take Profit Levels:
• TP1: 103.600 (liquidity zone)
• TP2: 101.800 (demand zone)
• TP3: 101.400 (long-term structure support)
⸻
Final Thoughts:
CAD/JPY is now showing early signs of a bearish trend reversal after a clean breakdown of structure and liquidity sweep at highs. As long as the price remains below 105.600, the bias remains bearish. A bounce from 104.500 could temporarily delay the drop, but deeper downside is likely if that level gives way.
Analysis

EUR/USD Weekly Forecast: Rising Wedge Breakdown & Bearish TargetChart Overview:
The provided EUR/USD daily chart displays a well-structured Rising Wedge pattern, which eventually led to a significant bearish breakdown. The analysis highlights key levels, including resistance, support, stop loss, and a downside target, all of which contribute to a well-planned trade setup. The market structure suggests a strong bearish continuation, targeting lower price levels based on technical projections.
1. Chart Pattern: Rising Wedge Formation & Breakdown
A Rising Wedge is a bearish reversal pattern that forms when price creates higher highs and higher lows, but the slope of the trendlines indicates weakening bullish momentum. This pattern is often a signal of upcoming bearish price action once a breakout occurs.
Pattern Breakdown Analysis:
The price moved inside the wedge, showing a gradual upward trend with declining momentum.
Upon reaching a key resistance level, price faced strong rejection (marked with a red circle).
The bearish breakdown below the wedge confirmed the pattern, leading to a sharp decline.
A retest of the broken wedge followed before continuing downward.
This confirms a classic bearish trend reversal, making it a strong technical setup.
2. Key Levels and Trade Setup:
🔹 Resistance Level (Major Supply Zone)
The resistance zone (highlighted in beige) acted as a strong supply area, where buyers lost control.
Price reached this resistance multiple times but failed to sustain above it.
A bearish reversal initiated from this level, marking the beginning of a downward trend.
🔹 Support Level (Key Demand Zone)
The support zone (also highlighted) represents a major demand area where price previously reversed.
This level aligns with historical price action, making it a critical area to monitor for potential reactions.
🔹 Stop Loss Placement
A stop loss is placed above the previous high within the resistance zone to protect against false breakouts.
If price invalidates the breakdown and moves above this level, the bearish setup would no longer be valid.
🔹 Price Target Projection
The breakdown suggests a potential drop towards 1.00874, as indicated by the 100% measured move.
This aligns with previous historical support, making it a realistic downside target.
3. Trade Execution Plan: How to Trade This Setup?
📌 Entry Strategy:
Traders can enter short after confirmation of the breakdown and a potential retest.
A sell position can be initiated around the resistance turned support after a pullback rejection.
📌 Stop Loss Strategy:
A stop loss should be set above the resistance zone (around 1.12208) to minimize risk.
This ensures protection against a bullish breakout invalidation.
📌 Take Profit Strategy:
The first take profit target is set at the support level near 1.04498.
The final take profit target is at 1.00874, which aligns with the full measured move projection.
4. Conclusion & Market Sentiment
🔸 Bearish Market Bias – The breakdown of the rising wedge confirms strong bearish momentum.
🔸 Key Resistance Held Strong – The price was unable to break above, confirming seller dominance.
🔸 Downside Target Aligns with Previous Support Levels – A confluence of technical signals supports further decline.
Final Thought:
This chart presents a high-probability bearish trade setup in EUR/USD. The combination of a rising wedge breakdown, clear resistance rejection, and a defined downside target makes it an ideal short-selling opportunity. Traders should watch for price action confirmations and risk management strategies before executing trades.
🚨 Risk Disclaimer: Always apply proper risk management and confirm signals before trading. Market conditions may change, so monitoring price behavior is crucial for trade adjustments.

COIN Geometry analysis up 3 hours chartSTCK Coin is poised for upward momentum in the next few days. The price has shown strong support, and key indicators suggest a bullish trend ahead. Watch for a potential breakout as market conditions

PI – Potential Head & Shoulders Pattern Forming📉 PI – Potential Head & Shoulders Pattern Forming
We may be seeing a possible Head & Shoulders structure on the chart — a classic bearish pattern.
If the neckline breaks, this could trigger a downside move, so watch closely for confirmation!
⚠️ Not confirmed yet — stay alert and manage your risk.
📍 Key zone: Neckline support area.
🔔 Follow for more updates and live trade setups

Weak US Economic Data Could Drive Prices Higher - 28.03.2025Gold prices have been on a strong upward trend, reaching a high of $3,059. The upcoming US economic data release on March 28, 2025, could provide new momentum for gold, particularly with the following key indicators in focus:
- Core PCE Price Index (MoM)
- Personal Spending (MoM)
- Personal Income (MoM)
Current forecasts suggest a slowdown in inflation and weaker economic activity, which could create a bullish environment for gold.
Economic Data Expectations and Market Implications
The Core PCE Price Index, the Federal Reserve’s preferred measure of inflation, is expected to rise by 0.2%, down from the previous 0.3%. This signals a slowdown in price pressures, increasing the likelihood of the Fed adopting a more dovish stance in the coming months. If inflation continues to decline, expectations for rate cuts could strengthen, which would be supportive of gold prices.
Personal spending is forecasted to increase by 0.3% - 0.5%, a modest recovery from the previous decline of -0.2%. However, this remains a weak rebound, suggesting that consumers are still cautious. Slower spending means less inflationary pressure, which could further encourage the Fed to ease monetary policy.
Personal income is expected to rise by 0.3% - 0.4%, significantly lower than the previous 0.9% increase. A slowdown in income growth could weigh on consumer spending and overall economic activity, reinforcing the case for lower interest rates.
Impact on Gold Prices
The combination of declining inflation, weak spending, and slower income growth increases the likelihood that the Federal Reserve will cut interest rates sooner rather than later. Gold, which tends to perform well in a lower interest rate environment, could see further gains as a result.
Key bullish factors for gold include:
Lower inflation expectations: A weaker Core PCE Price Index supports a more accommodative Fed stance.
Sluggish consumer spending: Less inflationary pressure gives the Fed room to cut rates.
Slower income growth: Weaker earnings could further dampen economic momentum, increasing demand for safe-haven assets like gold.
The main risk to gold prices would be a surprise shift in market sentiment. If the Fed remains cautious and delays rate cuts, gold could face short-term resistance. However, given the current data outlook, the overall trend remains positive.
Trading Idea: Long Position on Gold (XAU/USD)
Given the softer economic data, gold prices could continue their bullish momentum. If inflation shows signs of easing and economic activity slows, traders may start pricing in Fed rate cuts more aggressively, pushing gold higher.
A potential long trade setup could be to enter a buy position around $3,050 - $3,065, targeting $3,080, with an extended upside potential.
To manage risk, a stop-loss below could be placed to account for potential short-term pullbacks.
Conclusion
The upcoming US economic data release suggests a cooling economy, which could lead to increased expectations of Fed rate cuts. This would be a bullish catalyst for gold, reinforcing its role as a hedge against monetary easing.
A long position on gold around $3,065, with targets at $3,080, could be an attractive setup in the short term. Risk management remains key, with a stop-loss set close below.
If economic data confirms a weakening trend, gold could soon test new highs. Stay alert to market reactions and Fed commentary! 🚀
-------------------------------------------------------------------------
This is just my personal market idea and not financial advice! 📢 Trading gold and other financial instruments carries risks – only invest what you can afford to lose. Always do your own analysis, use solid risk management, and trade responsibly.
Good luck and safe trading! 🚀📊

Euro can exit from pennant and rebound up from support areaHello traders, I want share with you my opinion about Euro. The price was previously trading inside an upward channel, where it consistently rebounded from the support line and moved toward the resistance line. After a final bounce from the lower boundary, EUR made a strong breakout and exited the channel, triggering a powerful bullish impulse. This move brought the price directly to the current support level at 1.0745, which overlaps with the support area. After reaching the local high, the price turned around and entered a correction phase, forming an upward pennant pattern. Inside this structure, we can see how EUR respected both the resistance line and the rising support line of the pennant. Recently, the price rebounded from the support line again, showing signs of strength near the support area, and is now consolidating at the edge of the pennant. This setup often signals an upcoming breakout. I expect the price to break above the resistance line of the pennant and continue its bullish move toward TP1, which is set at 1.0950 points. Please share this idea with your friends and click Boost 🚀

BITCOIN - Price can reach support level and then start to growHi guys, this is my overview for BTCUSDT, feel free to check it and write your feedback in comments👊
Some time ago, the price long time traded near $83700 level, broke it and started to grow inside an upward wedge.
Firstly, BTC rose to the resistance line of the wedge and then corrected to the support level, after which it reached the $87800 level.
After several attempts to break resistance, price turned around and dropped, thereby exiting from wedge.
Now it is correcting and approaching support level, slowly moving toward $83700 key support level.
In my opinion, when BTC reaches $83700 level, it can turn around and start to grow to the $87800 resistance level.
If this post is useful to you, you can support me with like/boost and advice in comments❤️

$ZIL is sitting on a strong!GETTEX:ZIL is sitting on a strong long-term support line
Every touch in the past led to a solid move up.
Now back at the same zone — eyes on a potential bounce toward $0.02–$0.03.
Retweet if you're bullish!
#Altcoins #Crypto

BTC PoV - 48.000$?Bitcoin has recently gone through a period of strong volatility, dropping from a peak of $109,000 in January 2025 to around $85,000, showing a significant decline from its all-time highs. Predictions for Bitcoin’s future are mixed: some analysts, like Geoffrey Kendrick from Standard Chartered, foresee a potential price increase reaching an all-time high of $112,000 to $130,000 in the coming months, driven by factors like evolving regulatory policies and improvements in the macroeconomic environment. However, there are also more pessimistic forecasts warning of a continued decline, primarily linked to uncertainty in trade policies and global instability. In this context, i have identified several strategic support areas for a potential Bitcoin purchase, such as the zones around $76,000, $65,000, $58,000, and $48,000. These levels could represent buying opportunities if the market continues to drop, awaiting a potential rebound. However, if Bitcoin were to fall further below these levels, we could see a greater weakness in the market, leading to devastating losses not just for Bitcoin but for the entire cryptocurrency sector. Larger declines could undermine investor confidence and cause increased volatility, affecting the entire crypto ecosystem. Therefore, while there are bullish scenarios for Bitcoin, it’s crucial to carefully monitor support levels and take into account the uncertainty surrounding the market, adopting a thoughtful investment strategy and weighing the risks carefully.

ETH PoV - 1.600$? Ethereum is going through a phase of challenges and opportunities, with its current price approaching the target i've set for a potential purchase of $1600. In recent months, Ethereum has faced a significant price correction, with Ether's value dropping by about 40%, largely due to the growing competition from other blockchains like Solana and Cardano, which are gaining popularity due to their speed and low transaction costs. Additionally, the rise of memecoins and recent developments in the cryptocurrency regulatory landscape have shifted attention away from Ethereum, while other cryptocurrencies, such as Bitcoin, seem to enjoy greater favor among investors. Internally, Ethereum is still facing delays and challenges related to technical updates, as well as some tensions within the developer community, which has made it harder to maintain market leadership. The decision not to acquire Ether for a U.S. cryptocurrency reserve by the Trump administration has also disappointed many investors, fueling outflows from ETFs invested in Ethereum. Despite these difficulties, long-term prospects for Ethereum remain positive. In fact, some analysts suggest that if demand and supply stabilize, and if Ethereum can overcome internal challenges and effectively respond to competition, it could reach new all-time highs, with a target potentially surpassing $5000 in the next 12 months. This scenario is supported by the continued interest in ETFs that invest in Ether, the expansion of its network, and improvements in regulations, which could further incentivize institutional and retail adoption. Ultimately, while there are risks to consider, investing in Ethereum could be highly rewarding in the long term, with the possibility that the cryptocurrency could recover ground and set new value records in the next 12 months. Achieving a $5000 target, however, will depend on Ethereum's ability to innovate, address internal issues, and navigate the evolving regulatory landscape, but if it can maintain its central role in the cryptocurrency ecosystem, it may continue to grow significantly.

CHILLGUY: The Perfect Range Play Before Lift-Off!CHILLGUY has been in solid sideways accumulation, with a few deviations along the way. Now, it’s sitting near the bottom of the range, setting up for a strong move up. A sharp breakout is on the table, targeting a gap fill.
Entry: Now
TP: 0.03-0.04
SL: 0.022
Stay tuned and follow me so you don’t miss the next big setups! 🚀

#KAITO #KAITOUSDT #Analysis #Eddy#KAITO #KAITOUSDT #Analysis #Eddy
Everything is clear and I have clearly drawn the important areas in the chart and the labels and names of the areas are included. Depending on your analytical style, you can get the necessary confirmations and see the reduction from the marked areas to the specified targets.

DXY Monthly Analysis: Key Support Holding, Bullish Move Ahead?📊 DXY Monthly Chart Analysis (March 27, 2025)
Key Observations:
Current Price Action:
The U.S. Dollar Index (DXY) is trading near 104.267, with notable resistance ahead.
Price is consolidating within a key demand zone (~102.5–104) after rejecting higher levels.
Technical Levels:
Support Zone: 100.2–104 (Highlighted in purple)
Resistance Zone: 112.5–114.7 (Highlighted in purple)
Major Resistance: 114.77 (Previous high, acting as a supply zone)
200-MA Support: Located below current price, offering a long-term bullish confluence.
Market Structure:
Price remains in a higher time-frame bullish trend but is experiencing a correction.
The "BOSS" level (Break of Structure) suggests a prior bullish breakout.
If the demand zone holds, a bullish continuation towards 112.5–114.7 is possible.
Projected Move:
A bounce from 102–104 could trigger a rally toward the upper resistance zone (~112.5).
A break below 100.2 could indicate a shift in trend and further downside.
Conclusion:
DXY is at a critical decision point. Holding the current support zone (~102–104) could fuel a bullish continuation toward 112–114, while a breakdown below 100.2 would weaken bullish momentum.

XAU/USD Analysis–Bearish Continuation Within Descending Channel📉 Gold (XAU/USD) H1 Analysis – March 26, 2025
🔻 Descending Channel Formation:
The price remains confined within a downward-sloping channel, signaling continued bearish pressure.
Lower highs and lower lows confirm the short-term downtrend.
📍 Key Levels & Structure:
Current Price: $3,019
Resistance Zone: Around $3,025 - $3,030 (upper boundary of the channel)
Support Zone: $3,000 psychological level and potential lower boundary near $2,985
📌 Market Imbalance (MB) Not Filled:
A minor liquidity gap remains unfilled above, indicating a possible short-term retest before continuation.
📉 Bearish Expectation:
If price fails to break above the resistance trendline, we could see a drop toward $3,000 or even lower.
Watch for rejection signals at the upper boundary for short opportunities.
🔎 Trade Considerations:
Bearish Bias: Short entries from resistance with targets at $3,010 - $3,000.
Invalidation: A breakout above $3,030 could signal bullish strength.

EURO - Price can correct to support area and rise to $1.0955Hi guys, this is my overview for EURUSD, feel free to check it and write your feedback in comments👊
Some days ago price started to grow inside a rising channel, where it broke the $1.0345 level and then it reached the resistance line.
Next, price made correction to support line of channel and then it quickly reached $1.0345 level and broke it again.
After this, price continued to grow in the channel, and later, it exited from it and rose to $1.0765 level.
Soon, price broke this level and started to trades inside flat, where it reached top part of flat and some time traded near.
Then it started to decline, so, now I expect that Euro can bounce up from support area and rise to $1.0955 points.
If this post is useful to you, you can support me with like/boost and advice in comments❤️

HelenP. I Gold will break trend line and continue to fallHi folks today I'm prepared for you Gold analytics. A while back, the price climbed to the level labeled Support 2, which also aligned with the support zone. After breaking through this level, it began to consolidate. This was followed by a retest, after which the price continued its upward movement and eventually reached Support 1 — a level that matched the upper boundary of the previous range. From there, a correction took place, bringing the price down to the trend line. Shortly after, gold resumed its climb and nearly reached the upper edge of the consolidation area again, but another correction to the trend line followed. Then, XAUUSD continued to rise, eventually reaching Support 1 and breaking above it, effectively exiting the range. Following this breakout, gold rallied to 3056 points before pulling back to the trend line. Since then, the price has been moving upward along this line. Currently, I anticipate that XAUUSD could rise to around 3050 points once more, then reverse and break below the trend line, continuing its downward move. In this scenario, my goal is set at 2980 points. If you like my analytics you may support me with your like/comment ❤️

HelenP. I Bitcoin may grow to trend line and then drop to $82200Hi folks today I'm prepared for you Bitcoin analytics. Looking at the chart, we can observe how Bitcoin made a strong upward impulse, reaching the trend line and breaking through the resistance level that aligned with the resistance zone. After that move, the price began to decline within a wedge pattern and soon dropped below the same resistance level, effectively breaking it again. BTC then attempted to recover, climbing back up, but the growth was short-lived — the price failed to hold and fell toward the support level, eventually breaking below it and even dipping under the resistance once more. Following this drop, Bitcoin reversed and gained momentum. Shortly after, it broke through the 82200 level, successfully retested it, and continued moving higher. Later on, the price reached the trend line again — a level that also acted as resistance — but failed to break above and started pulling back from that area. At this point, I anticipate that BTCUSDT may retest the trend line once more before making a move downward toward the support level, potentially breaking out of the wedge pattern. For now, my goal is the 82200 support level. If you like my analytics you may support me with your like/comment ❤️

WhiteBIT Coin $WBT: Getting Ready for a New ATHMarkets often react to major events, whether political statements or high-profile initiatives in the crypto industry. For instance, the impact of Donald Trump’s economic policies and regulatory decisions on asset prices and the market capitalization of crypto exchanges has been widely discussed - coinmarketcap.com
In particular, market volatility following such developments has led to a decline in the market value of leading crypto exchanges. However, beyond global factors, internal ecosystem growth drivers also play a crucial role.
One such trigger could be the International Crypto Trading Championship (ICTC)—WhiteBIT’s trading tournament, which will be the first-ever global live-streamed trading competition.
What does this mean for WhiteBIT Coin?
Increased platform activity → higher demand for internal assets.
Greater trader engagement → potential impact on trading volumes and liquidity.
Media exposure of the event → attracting global attention to the WhiteBIT ecosystem.
Currently, WBT is trading at $29.20 (-0.26% over the past 24 hours), down 6.29% from its ATH of $31.16. However, given the growing interest in the platform and the impact of market supply dynamics, this tournament could act as a catalyst for reassessing current price levels. If exchange activity intensifies, it’s reasonable to expect that WBT could retest its ATH zone or even break through it.
Whether this scenario plays out remains to be seen. But one thing is certain—ICTC will be a key indicator of WBT’s momentum and overall market sentiment. 🔥
What are your thoughts? Will this tournament give WBT a new boost?

XAU/USD - H1 Chart - Trendline Breakout (27.03.2025)The XAU/USD pair on the H1 timeframe presents a Potential Buying Opportunity due to a recent Formation of a Breakout Pattern. This suggests a shift in momentum towards the upside and a higher likelihood of further advances in the coming hours.
Possible Long Trade:
Entry: Consider Entering A Long Position around Trendline Of The Pattern.
Target Levels:
1st Resistance – 3051
2nd Resistance – 3065
🎁 Please hit the like button and
🎁 Leave a comment to support for My Post !
Your likes and comments are incredibly motivating and will encourage me to share more analysis with you.
Best Regards, KABHI_TA_TRADING
Thank you.

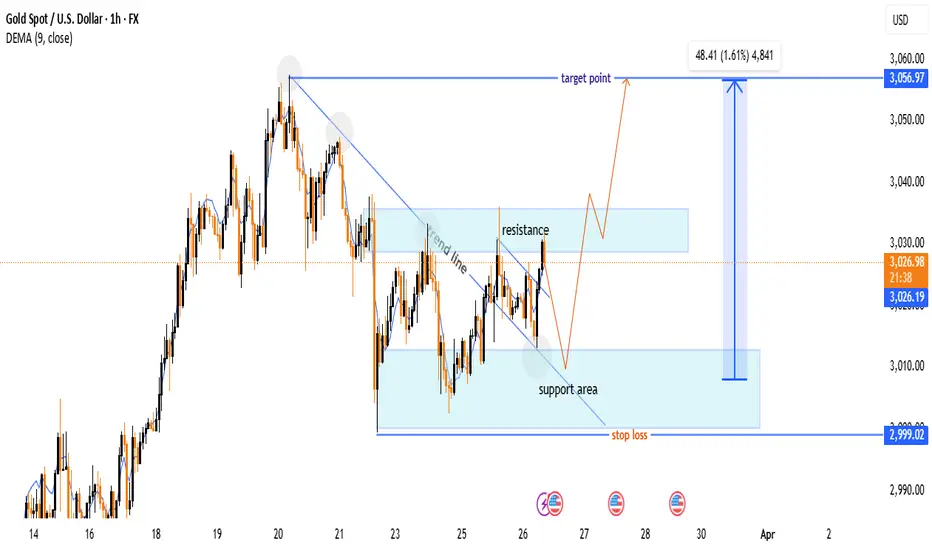
Gold (XAU/USD) Bullish Breakout – Trade Setup & Key Levels🔍 Key Observations:
🔹 Trend Line Breakout:
📉⬇️ A downward trend line was broken, signaling a potential bullish reversal.
📈✅ The price has moved above the trend line, confirming the breakout.
🔹 Support & Resistance Zones:
🟦 Support Area: $3,000 - $3,010 (Buy Zone)
🟥 Resistance Area: $3,030 - $3,040 (Sell Pressure)
📊 Trade Setup:
✅ Buy Plan:
🔄 Wait for a pullback to the support zone (🟦 light blue area) before entering.
🎯 Target: $3,056.97 📈🏁
🛑 Stop Loss: $2,999.02 ❌🚨
📈 Indicators & Confirmation:
📊 DEMA (9-period) = $3,026.48 (near the current price, suggesting a neutral-to-bullish trend).
🔥 Conclusion:
🔵 Bullish Setup Active 🚀
⚠️ Wait for price reaction at support before entering.
❌ If price drops below $2,999, the setup is invalidated.
📌 Final Tip: Watch for a bullish candlestick pattern 📊 at support before executing the trade! 🎯
GDP Data in Focus – Gold Traders Prepare for Volatility⚠️ GDP Data in Focus – Gold Traders Prepare for Volatility
🟡 Market Brief – 27/03/2025
📰 Trump’s Latest Tariff Remarks Leave Markets Unshaken
Earlier this morning (end of US session), Donald Trump made new comments on tariff policy.
However, unlike previous occasions, his speech did not trigger significant market volatility.
He stated:
“Reciprocal tariffs will be eased, broadly applied to all countries, but not harshly.”
🔹 A 25% import tariff on cars will take effect from April 2
🔹 No additional tariffs for now on semiconductors or pharmaceuticals
→ It appears the market had already priced in this announcement, resulting in a muted reaction.
📊 Today’s Spotlight – Final US GDP (q/q)
This is the broadest measure of inflation, reflecting price changes for all goods and services included in GDP.
Given the weakness in recent US inflation indicators (CPI & PPI),
AD anticipates today’s GDP may also come in weaker than expected.
⚠️ However, market reaction might remain limited (≈30 pts),
as Core PCE data tomorrow is expected to be the true driver of weekly volatility.
🟡 Gold Strategy – Intraday Setup
Gold may retest resistance levels or recent highs,
before a potential strong move to the downside – the BIG SHORT scenario AD has been tracking.
📌 Plan for Today:
Look for intraday BUY opportunities during the Asian and European sessions,
especially near key support levels marked on the chart.
🧭 Key Technical Levels:
🔻 Support: 3019 – 3011 – 3002 – 2988
🔺 Resistance: 3036 – 3046 – 3056
🎯 Trade Zones – 27/03:
🟢 BUY ZONE: 3002 – 3000
SL: 2996
TPs: 3006 – 3010 – 3014 – 3018 – 3022 – 3026 – 3030
🔴 SELL ZONE: 3055 – 3057
SL: 3061
TPs: 3051 – 3047 – 3042 – 3038 – 3034 – 3030
🧠 Final Note:
This week’s volatility hinges on two major macro releases:
✅ Today’s Final GDP report
✅ Tomorrow’s Core PCE data
→ During Asia & London sessions: respect the levels and trade reactively
→ For New York session: stay alert — AD will update instantly if needed
Good luck, trade safe, and stay disciplined.
— AD | Money Market Flow

$NEO is back at its historical demand zone!NASDAQ:NEO is back at its historical demand zone 👇
Accumulated here for over 6 years — every bounce from this range led to massive rallies.
If it plays out again, $25–$45 isn't far-fetched.
Low risk, high reward? You decide.

CHF/JPY Triangle Pattern (27.3.25)The CHF/JPY Pair on the M30 timeframe presents a Potential Selling Opportunity due to a recent Formation of a Triangle Pattern. This suggests a shift in momentum towards the downside in the coming hours.
Possible Short Trade:
Entry: Consider Entering A Short Position around Trendline Of The Pattern.
Target Levels:
1st Support – 169.06
2nd Support – 168.46
🎁 Please hit the like button and
🎁 Leave a comment to support for My Post !
Your likes and comments are incredibly motivating and will encourage me to share more analysis with you.
Best Regards, KABHI_TA_TRADING
Thank you.
