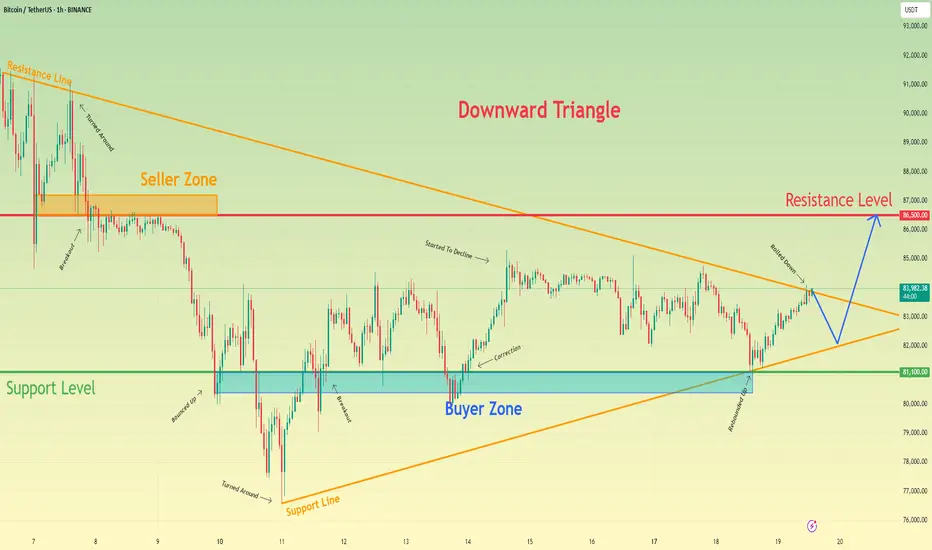
Bitcoin can exit from triangle and rise to resistance levelHello traders, I want share with you my opinion about Bitcoin. On the chart, we can see that the price entered a downward triangle, where it rebounded from the resistance line and dropped to the resistance level. After that, BTC bounced from the 86500 level, climbed back to the resistance line of the triangle, and then started to decline. Soon, it broke through 86,500 and reached the support level, which coincided with the buyer zone. BTC then broke this support and dropped further to the support line of the triangle before reversing and beginning to rise. In a short time, the price reached 81100, broke through it, and made a retest before continuing its upward movement. However, it later corrected back to the buyer zone, then climbed to 85000, and started declining again. Shortly after, the price dropped to the support level and then rebounded to the resistance line of the triangle. Given this price action, I expect BTC to correct toward the support line of the triangle before bouncing back up and breaking out of the pattern. From there, I anticipate further growth toward the 86500 resistance level, which is why I have set my TP at this level. Please share this idea with your friends and click Boost 🚀
Analysis
Gold can continue to grow inside upward channelHello traders, I want share with you my opinion about Gold. This chart shows how the price initially rebounded from the support level, which aligned with the buyer zone, but soon reversed and dropped back down to the support line. After hovering near this line, the price entered a triangle pattern, where it bounced off the resistance line and fell to the support line, breaking below the support level. Following that move, the price reversed upward and returned to the buyer zone, where it consolidated briefly before declining again to the support line. From there, it bounced and began to climb. Shortly after, the price broke through the 2915 level and eventually exited the triangle pattern. From that point, the price started trending upward within an ascending channel, reaching the current support level, which overlaps with a key support area, before rising to the resistance line of the channel. Recently, the price pulled back to the support zone once again, and I believe there’s a good chance it will decline a little below from this area and continue its upward move within the channel, aiming for the resistance line. For this scenario, my TP is set at 3080. Please share this idea with your friends and click Boost 🚀

Solana’s Cup-and-Handle Setup: A Bullish Trap or Opportunity?Recent analysis suggests Solana (SOL) is forming a large cup-and-handle pattern, with a potential false breakout on the fifth wave before a flash crash in mid to late April. Some traders believe this correction could set the stage for a stronger breakout on the seventh wave, possibly pushing SOL past its current pattern high and toward the upper boundary of a broadening wedge formation. Despite short-term volatility, this multi-year structure supports a long-term bullish outlook.
In the near term, market structure remains uncertain, with SOL facing downward pressure despite bouncing from $120. While this level has historically been strong support, the depth of the correction and multiple broken levels suggest caution. Analysts remain divided on the next move—some expect consolidation between $120 and $180, while others warn of a potential drop to $80 if market conditions worsen. Monitoring key support and resistance levels will be crucial for traders navigating the next phase.

BITCOIN - Price can bounce up to $87K, breaking resistance levelHi guys, this is my overview for BTCUSDT, feel free to check it and write your feedback in comments👊
Price entered to wedge and at once dropped to support line, breaking two levels, after which it bounced up.
Soon, it broke $80200 level and then tried to grow, but failed and made a correction to $80200 support level.
Later BTC rose to $85400 level and then some time traded near, after which it turned around and corrected to support line.
Then price in a short time rose to resistance line of wedge, breaking the resistance level, but a not long time ago fell back.
Bitcoin broke $85400 level and continued to decline, and in my mind, it can soon reach support line of wedge.
After this movement, I expect that BTC can bounce up to $87000, breaking resistance level.
If this post is useful to you, you can support me with like/boost and advice in comments❤️

Fundamental Market Analysis for March 21, 2025 EURUSDFederal Reserve (Fed) Chairman Jerome Powell downplayed the danger to the economy from US President Donald Trump's tariff threats, which seem to exist in a quantum state where they both exist and don't exist at the same time. According to Fed Chairman Powell, downside risks have certainly increased thanks to repeated tariff threats, but Fed policymakers continue to insist that US economic data remains strong, albeit off recent highs.
The Federal Reserve Bank of Philadelphia's (Fed) manufacturing activity survey for March fell to 12.5 m/m, down from the previous reading of 18.1 and down for the second month in a row, but held the brakes and fell less than the median market forecast of 8.5. US weekly initial jobless claims also rose less than expected at 223,000 new jobless claimants, up from 220,000 the previous week. Investors had expected the figure to be 224k. Sales of existing homes in the US also rose by almost a third of a million transactions more than expected, rising to 4.26 million units in February from a revised January figure of 4.09 million. Market watchers had expected a slight slowdown to 3.95 million.
With little in the way of economic data on Friday, investors will have a week's worth of events to digest. Traders will also keep an eye on any social media developments from President Trump.
Trade recommendation: SELL 1.0850, SL 1.0930, TP 1.0760

USD/JPY(20250321)Today's AnalysisToday's buying and selling boundaries:
148.63
Support and resistance levels:
149.40
149.11
148.92
148.33
148.14
147.85
Trading strategy:
If the price breaks through 148.92, consider buying, the first target price is 149.11
If the price breaks through 148.63, consider selling, the first target price is 148.33

What is a Rising Wedge? - Opportunities on GALA and ARWEAVE!What is a rising wedge?
A rising wedge pattern is a bearish chart formation that signals either a potential trend reversal or the continuation of a downtrend. It occurs when the price consolidates within two upward-sloping, converging trendlines, indicating weakening momentum.
Key Characteristics of a Rising Wedge:
1. Higher Highs and Higher Lows – The price moves upward, but the momentum gradually weakens.
2. Converging Trendlines – Both the upper and lower trendlines slope upward while moving closer together, suggesting a loss of strength in the trend.
3. Breakout Direction – The pattern typically breaks below the lower trendline, confirming a bearish reversal.
How to Trade a Rising Wedge:
• Wait for Confirmation – A breakdown below the lower trendline with increased volume confirms the pattern.
• Set a Target – Measure the height of the wedge and project it downward, often aiming for the starting point of the wedge.
• Use a Stop-Loss – Place a stop-loss just above the recent swing high to manage risk.
Rising wedge on GALA and ARWEAVE
There will be some opportunities with the rising wedge pattern on GALA Games and ARWEAVE. With the projected downside move in BTC and ETH, these falling wedges could play out perfectly. The stop-losses are around 5%, so make sure to manage your risk accordingly.
Keep an eye on both setups for possible trade opportunities in the coming hours/days!
Thanks for your support.
- Make sure to follow me so you don't miss out on the next analysis!
- Drop a like and leave a comment!
Lets chat in the comment section. See you there :)

A possible short-term bullish set-up on EURCAD?Well, it seems that FX_IDC:EURCAD could be forming either a bullish pennant, or a falling wedge pattern in the near-term. Both patterns tend to result in a bullish breakout. However, we still require a confirmation. Without it, there is still a chance to see a move lower.
MARKETSCOM:EURCAD
Let us know what you think in the comments below.
Thank you.
74.2% of retail investor accounts lose money when trading CFDs with this provider. You should consider whether you understand how CFDs work and whether you can afford to take the high risk of losing your money. Past performance is not necessarily indicative of future results. The value of investments may fall as well as rise and the investor may not get back the amount initially invested. This content is not intended for nor applicable to residents of the UK. Cryptocurrency CFDs and spread bets are restricted in the UK for all retail clients.

GOLD (XAU/USD) Trading Plan: Can Gold Surge Past $3100?🚀Published by MMFlowTrading on 20 March 2025
📊 Market Snapshot
Gold (XAU/USD) is riding a strong uptrend on the H1 chart, moving within a clear ascending channel 📈. After breaking the $3000 psychological barrier, bullish momentum remains intact 💪. However, with key resistance ahead and US economic data on the horizon, volatility could spike. Let’s break down the setup for today’s trading session! 🧠
🔍 Technical Analysis
Ascending Channel:
Gold is trading in a well-defined ascending channel (highlighted in orange on the chart) 📉📈. The price has respected both the upper and lower boundaries, confirming a solid uptrend. It’s currently testing the upper channel resistance at $3070.612 🚧
Key Resistance Levels:
Immediate resistance at $3070.612, a high-volume area (VPOC) where sellers may step in 🛑
A break above could target $3081.053, then $3097.774, with $3100 as the next psychological level 🎯
Key Support Levels:
Nearest support at $3031.774, aligning with the channel’s lower boundary and a prior VPOC 🛡️.
A deeper pullback might test $3024.254 or $3017.197, where buyers previously defended (marked by yellow circles) 📍
Additional Levels to Watch:
Resistance: $3054 - $3061 - $3070 🚧
Support: $3044 - $3038 - $3031 - $3026 🛡️
🌍 Fundamental Insights
US Dollar Dynamics:
Gold often moves inversely to the USD 💱. Today, 20 March 2025, markets are focused on the US Jobless Claims data (due at 13:30 GMT) and Fed speeches, which could sway the Dollar 📅. A weaker-than-expected US report may weaken the USD, boosting Gold towards $3100 🚀.
Safe-Haven Demand:
Geopolitical tensions (e.g., Middle East unrest, US-China trade talks) continue to support Gold as a safe-haven asset 🛡️. This underpins the bullish outlook for now.
Interest Rate Environment:
The Fed’s dovish tone in early 2025 has lowered the opportunity cost of holding Gold, supporting its upward trajectory 📉. Meanwhile, keep an eye on UK inflation data this week, as it could impact GBP and indirectly influence Gold.
📝 Trading Plan
Buy Opportunity (Buy Zone: $3032 - $3030) 🟢
Stop Loss (SL): $3026 ⛔
Take Profit (TP): $3038 - $3042 - $3046 - $3050 - $3060 💵
Sell Opportunity (Sell Zone: $3069 - $3071) 🔴
Stop Loss (SL): $3075 ⛔
Take Profit (TP): $3065 - $3060 - $3055 - $3050 💵
⚠️ Market Alert
Gold has been hitting all-time highs following the FOMC meeting earlier today 🌪️. With US data due during the London session, expect volatility—stick to your TP/SL to safeguard your account! 🛡️💡

Fundamental Market Analysis for March 20, 2025 USDJPYThe Japanese yen (JPY) attracted buyers for the second consecutive day and strengthened to a new one-week high against its US counterpart during the Asian session on Thursday. Expectations that strong wage growth could boost consumer spending and contribute to higher inflation give the Bank of Japan (BoJ) room to raise interest rates further. This has led to a recent sharp narrowing of the rate differential between Japan and other countries, which continues to support the low-yielding yen.
In addition, uncertainty over US President Donald Trump's trade policy and its impact on the global economy, as well as geopolitical risks and the political crisis in Turkey, are contributing to inflows into the Yen. The US Dollar (USD), on the other hand, is struggling to gain meaningful momentum amid increased economic uncertainty amid US President Donald Trump's trade tariffs. This, in turn, is weighing on the USD/JPY pair and contributing to the intraday decline.
However, interest rate differentials, the Bank of Japan's loose monetary policy, the trade balance differential and global market sentiment put pressure on the Japanese yen. The further direction of the USD/JPY pair lies on the upside.
Trading recommendation: BUY 148.400, SL 147.600, TP 150.100

Gold 30-minute chart, target achieved with news...This is a Gold (XAU/USD) 30-minute chart, showing a bullish setup.
Key Points:
1. Uptrend Continuation
Price is trending upwards inside a rising channel.
Blue trendline indicates recent bullish momentum.
2. Resistance Target
The price is approaching $3,055.64, which is a resistance zone.
If broken, gold may push higher.
3. Previous Rejection Zone
The orange circle highlights a past rejection around this level.
A breakout above would confirm further bullish strength.
Conclusion:
Gold is in a bullish trend, targeting resistance at $3,055.64. A breakout could lead to higher prices, but rejection may cause a pullback.

#XLM #XLMUSDT #Stellar #Analysis #Eddy#XLM #XLMUSDT #Stellar #Analysis #Eddy
Everything is clear on the chart, I didn't have enough time to explain further. From the supply area, with or without the area hunt, it can fall to the demand area. Then you can invest in your style by getting the necessary confirmations when the high-time divergence is completed, which is probably the third collision on the lines marked in the demand area.
This analysis is only to show important areas.
It is never too late to buy and invest. Do not rush and do not be fooled by the positive movements and reactions of the market. Wait for the price to reach its valuable areas. In the analysis of the Atom currency, as you can see, there is a strong demand area that is intact. Be patient until the price falls from the decision or extreme flips to the green area of the important demand area. Be sure to check this currency in your monthly time frame and draw the areas. Then refer to the weekly, daily and four-hour time frames and draw the lower time areas and look for confirmation for volatility.
Do not rush to invest and buy spot and let the price reach the support area.
Important areas are drawn and labeled so you can make informed decisions.
Good luck.

Sharp reversal in US marketsAmid market volatility and uncertainty, US stock indices experienced a sharp decline last week. The Dow Jones Index (#DJI30) fell by 3.5%, the S&P 500 (#SP500) dropped by 4.1%, and the Nasdaq-100 (#NQ100) lost 5.5%.
Investors reacted nervously to new economic data, including rising inflation and expectations of interest rate hikes, leading to a sell-off in stocks and a decline in key indices. The drop was particularly significant in the technology and consumer sectors, where companies like Apple and Tesla lost around 6-7% of their value.
However, starting March 13, 2025, the indices began to recover: #DJI30 gained 2.3%, #SP500 rose by 2.5%, and #NQ100 increased by 3.1%.
The recent rebound in US stock indices has been driven by several factors that restored investor confidence. Let’s take a closer look at the main reasons:
• Improvement in unemployment data: Labor market statistics played a crucial role in the market recovery. The US unemployment rate fell to 3.4% in February 2025, marking a record low in recent decades. This indicates strong employment levels and economic resilience, boosting investor optimism and supporting stock market growth.
• Stabilization of inflation and interest rate expectations: Although inflation in the US remains high, recent data showed a slowdown in its growth. Reduced inflationary pressure gave investors hope that the Federal Reserve (Fed) might slow down the pace of interest rate hikes. This was perceived as a sign of potential economic stabilization, positively impacting stock indices.
• Growth in consumer spending: One of the key drivers of the recent market recovery has been the increase in consumer spending. In Q1 2025, consumer demand in the US showed strong performance, serving as an essential indicator of economic activity. Increased spending on goods and services supports business stability and enhances corporate revenues, which, in turn, stimulates stock growth.
• Absence of new geopolitical risks: In recent weeks, there have been no major geopolitical crises or new threats on the international stage. This helped financial markets stabilize, as investors could focus on economic data and corporate earnings reports, contributing to stock index growth.
• Positive corporate earnings reports:
• #Microsoft (MSFT): Microsoft shares rose by 4.2% after reporting strong quarterly results, driven by growth in cloud services and software revenue.
• #Google (GOOGL): Alphabet’s stock increased by 3.7% due to higher advertising revenue and improved forecasts for upcoming quarters.
• #Apple (AAPL): Apple shares climbed 2.9%, supported by strong sales of new products and rising revenue from services.
• #Tesla (TSLA): Tesla stock surged 5.6%, fueled by strong electric vehicle sales growth and optimistic profit projections for the next quarter.
These companies demonstrated significant growth on the back of improved financial performance, strengthening investor confidence and aiding the stock market’s recovery amid volatility.
So despite last week’s market downturn, the current situation in the US stock market signals a potential recovery and a more positive trend in the coming weeks.

XAU/USD 1H – Bullish Continuation from Demand Zone?📊 XAU/USD (Gold) 1H Analysis – Bullish Continuation Setup
🔹 Market Structure: Gold has been in a strong uptrend, with price currently consolidating near a key demand zone.
🔹 Key Levels:
🔴 Resistance: $3,050 - $3,060 (Potential target)
🟣 Demand Zone: $3,030 - $3,035 (Support area)
🟠 Deeper Support: $3,025 (Break below weakens bullish bias)
📈 Potential Trade Setup:
1️⃣ A possible pullback into the demand zone could attract buyers.
2️⃣ Price may wick below liquidity before reversing.
3️⃣ If support holds, we anticipate a move toward $3,050+.
✅ Entry Zone: $3,030 - $3,035
🎯 Target: $3,050 - $3,060
🚨 Stop Loss: Below $3,025
⚠️ Watch for price action confirmation before entering. A strong bullish candle from support could signal entry. Let the market show its hand! 🚀✨

Bitcoin Correction & Accumulation Phase!#Bitcoin is in a correction and accumulation phase, something we’ve seen multiple times in this cycle.
As long as we don’t see any bearish confirmation on the higher time frame, this remains a normal correction within the bull run
We’re near the range's lower bound, which could be a good spot for short-term long setups on lower timeframes.
The next bullish breakout requires a weekly close above $110,000 🚀
History repeats itself—stay patient, accumulate smartly
What’s your strategy during these corrections? Let’s discuss it! 👇
DYOR, NFA

CAD/JPY Triangle (BoJ Interest Rate- Today) 19.03.2025The CAD/JPY pair on the M30 timeframe presents a Potential Buying Opportunity due to a recent Formation of a Triangle Pattern. This suggests a shift in momentum towards the upside and a higher likelihood of further advances in the coming hours.
Possible Long Trade:
Entry: Consider Entering A Long Position around Trendline Of The Pattern.
Target Levels:
1st Resistance – 105.50
2nd Resistance – 106.06
🎁 Please hit the like button and
🎁 Leave a comment to support for My Post !
Your likes and comments are incredibly motivating and will encourage me to share more analysis with you.
Best Regards, KABHI_TA_TRADING
Thank you.

NZD/JPY Trendline Breakout (19.3.2025)The NZD/JPY Pair on the M30 timeframe presents a Potential Selling Opportunity due to a recent Formation of a Trendline Breakout Pattern. This suggests a shift in momentum towards the downside in the coming hours.
Possible Short Trade:
Entry: Consider Entering A Short Position around Trendline Of The Pattern.
Target Levels:
1st Support – 85.83
2nd Support – 85.10
🎁 Please hit the like button and
🎁 Leave a comment to support for My Post !
Your likes and comments are incredibly motivating and will encourage me to share more analysis with you.
Best Regards, KABHI_TA_TRADING
Thank you.

BTCUSD 8H: Trendline Pressure and Key Support Test🔥 BTCUSD 8H Deep Dive
1️⃣ Trendline Pressure: Bears controlling the market with a strong descending trendline.
2️⃣ Support Zone Strength: $77,500-$80,000 is a key demand area. Previous bounce shows buyers stepping in.
3️⃣ Liquidity Hunt? Price might sweep the support zone before reversal.
4️⃣ Volume Check Needed: Low volume = fakeout risk. High volume = potential breakout.
🎯 Targets
Bullish Breakout: $85,000-$87,500
Bearish Breakdown: $77,500-$75,000
📍 Eyes on next 8H close.

NZDJPY 4h chart analysis: Key levels Trends SetupThe NZDJPY pair is showing slight bullish momentum but the key level to watch is 86.000 A breakout above this level could signal further upside. while rejection could lead to retest of lower support levels, Stay alert and trade with cautions.

GOLD - Price can correct to support area and then continue growHi guys, this is my overview for XAUUSD, feel free to check it and write your feedback in comments👊
A few moments ago price started to grow inside a rising channel, where it so long rose near support line and reached $2845 level.
Then Gold broke this level, exited from channel and started to trades inside flat, where it at once made retest.
After this movement, Gold started to grow and later grew to top part of flat, which coincided with $2955 level.
Price some time traded near this level and then corrected to support area, after which started to grow.
Gold rose to $2955 level and broke it, thereby exiting from flat too and then it continued to move up next.
Possibly, Gold can fall to the support area, correcting, and then continue to rise to $3040
If this post is useful to you, you can support me with like/boost and advice in comments❤️

EURO - Price can bounce from support line of wedge to $1.1045Hi guys, this is my overview for EURUSD, feel free to check it and write your feedback in comments👊
Some time ago, the price declined to the $1.0475 level and broke it, after which it declined to $1.0360 points.
Then price turned around and started to grow inside the wedge, where it soon reached $1.0475 level and broke it again.
Next, Euro made a retest, after breakout and then continued to move up, and later it reached $1.0835 level.
Price has some time traded below this level, and then it broke it and reached the resistance line of wedge.
After this, EUR long time traded near $1.0835 level and not long time ago it bounced and started to grow.
In my mind, Euro can bounce from the support line and then rise to $1.1045 resistance line of the wedge pattern.
If this post is useful to you, you can support me with like/boost and advice in comments❤️

HelenP. I Bitcoin can drop of resistance line of wedge to $77800Hi folks today I'm prepared for you Bitcoin analytics. A few days ago, the price surged to 99000 before pulling back to the resistance level, which aligned with the resistance zone. Then, BTC broke through the 89500 level, traded below it for a while, and continued its decline toward the support level, which coincided with the support zone. Following this move, Bitcoin started trading inside a wedge pattern and quickly made a strong upward impulse from the support zone, reaching 94900 and breaking the resistance level once again. However, it soon corrected, dropping back below this level, and after attempting to recover, it failed. BTC then began to decline and, in a short time, fell to the support zone, where it reached the trend line. After bouncing off this level, it started to rise again, eventually making a correction to the support level before continuing its upward movement inside the wedge. At this point, I expect BTCUSDT to reach the resistance line of the wedge before reversing and dropping to the trend line, breaking the support level. Based on this, my goal is set at 77800, which coincides with the trend line. If you like my analytics you may support me with your like/comment ❤️

XAUUSD- Gold will continue the Bullish upward (Read caption) XAU/USD is expected to maintain its bullish momentum in the upcoming week, driven by sustained investor demand, a weakening U.S. dollar, and ongoing geopolitical uncertainties that continue to support safe-haven assets. Technical indicators suggest that gold may test key resistance levels, with buyers looking to push prices higher amid strong market sentiment. Traders should keep an eye on economic data releases and Federal Reserve commentary, as any dovish signals could further fuel the rally. As long as gold remains above crucial support zones, the bullish trend is likely to persist, with the potential for new highs in the near term.
