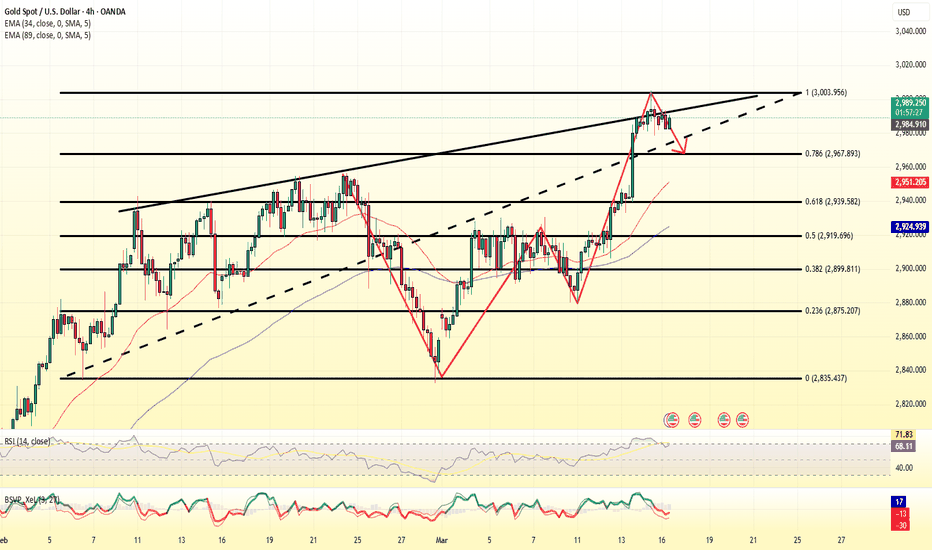
WELCOME 3000 GOLD WILL GOLD MARK NEW ATH AGAIN!🔥 Attention Traders! 🔥
XAUUSD is heating up! Here's the latest analysis:
🔻 Bearish Setup: Watch for a potential decline if the price breaks below 2979-3003. Key targets: 2960 & 2945.
🔺 Bullish Setup: A breakout above 2911 could signal buying opportunities! Keep an eye on these targets: 3015 & 3030.
📉 Risk Management: Always protect your capital by setting stop-losses and adjusting position sizes based on your risk tolerance. Trading with discipline is key to success!
📊 Stay Engaged: Share your thoughts and strategies as we navigate through this volatile market. Let’s aim for new highs while managing risk effectively! 💵🚀
Analysis
Fundamental Market Analysis for March 18, 2025 EURUSDThe escalating trade war with further tariffs on European Union goods by US President Donald Trump is having a negative impact on the Euro (EUR).
The US has imposed tariffs on steel and aluminium, the EU has drawn up plans to retaliate, and Trump has promised to impose retaliatory 200% tariffs on European wines and spirits. Any signs of an escalation in the tariff war between the US and EU could put pressure on the euro.
German Chancellor Friedrich Merz has agreed to a €500bn infrastructure fund and radical changes to borrowing rules, or stretching the so-called ‘debt brake’. That should ensure the package is approved in Germany's lower house of parliament on Tuesday and in the upper house on Friday. This, in turn, could boost the common currency against the US dollar (USD) in the near term.
In addition, weaker-than-expected US retail sales data has heightened concerns about a slowdown in consumer spending. This report could put pressure on the USD and serve as a tailwind for the major pair. US retail sales rose 0.2% month-on-month in February, compared to a 1.2% drop (revised from -0.9%) in January, the US Census Bureau reported on Monday. The figure was weaker than market expectations, which had expected a 0.7% rise. On a year-over-year basis, retail sales rose 3.1% compared to 3.9% (revised from 4.2%) previously.
Trade recommendation: BUY 1.0920, SL 1.0840, TP 1.1040
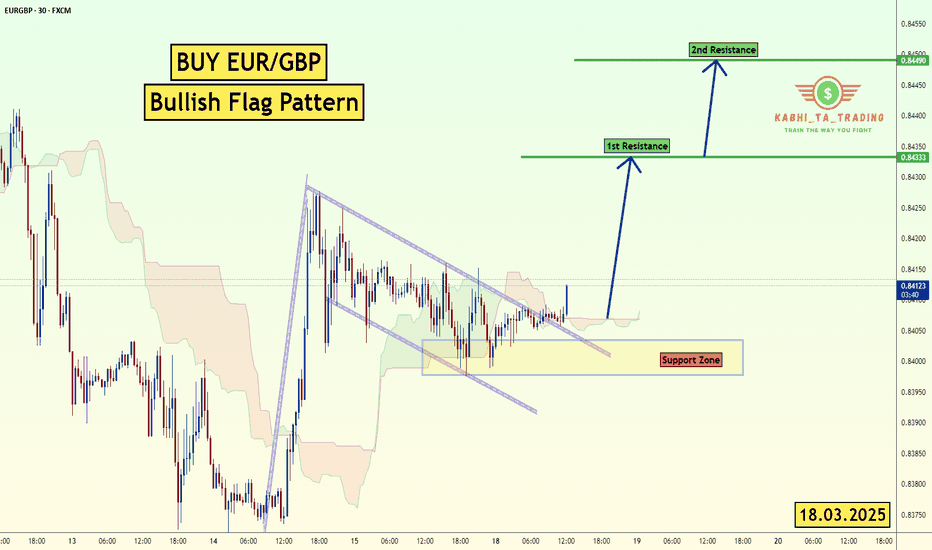
EUR/GBP Bullish Flag (18.3.25)The EUR/GBP pair on the M30 timeframe presents a Potential Buying Opportunity due to a recent Formation of a Bullish Flag Pattern. This suggests a shift in momentum towards the upside and a higher likelihood of further advances in the coming hours.
Possible Long Trade:
Entry: Consider Entering A Long Position around Trendline Of The Pattern.
Target Levels:
1st Resistance – 0.8433
2nd Resistance – 0.8448
🎁 Please hit the like button and
🎁 Leave a comment to support for My Post !
Your likes and comments are incredibly motivating and will encourage me to share more analysis with you.
Best Regards, KABHI_TA_TRADING
Thank you.
Total 2 Marketcap - Is this cycle repeating the last two cycles?In this analysis, we are discussing the possible repetition of the last two cycles by the total 2 (Crypto Total Market Cap Excluding BTC) on the monthly timeframe. By comparing this cycle in conjunction with the RSI and the Stochastic RSI with the previous two cycles we could make a statement that the market might follow the same bearish signals.
What did we see in the previous two cycles with regard to the price action and RSI
In both bullmarket cycles we saw the total 2 making highers highs and higher lows. In both instances the RSI made a lower high while the price action made a higher how consulting in a bearish divergence on the monthly timeframe.
What did we see in the previous two cycles with regard to the price action and Stochastic RSI
In the last two bullmarkets we saw the Stochastic RSI (momentum indicator) rising to levels above 80 on the indicator, overbought territory. This means that the momentum to the upside in the Crypto market is immense. However, in both instances the Stochastic RSI was in overbought territory during the first top. After the first top the momentum weakened and thus resulting in bearish momentum below level 80.
However, the momentum weakening, both cycles made a new higher high. By making a new higher high the Stochastic RSI made a bullish cross around the 40/50 level. Nevertheless, after making a new higher high and a new Stochastic RSI cross up the price fell, resulting in another bearish Stochastic RSI cross down.
What we can conclude is that in both previous cycles the Stochastic RSI made a cross down below the 80 level at the first top and made a second cross down around the 40/50 level during the final top.
How does the previous cycles relate to this current cycle
In this current bullmarket we see the Total 2 Marketcap rising and making higher highs and higher lows. However, this cycle looks alike the past two cycles in comparison with the price action, RSI and Stochastic RSI.
This Cycle the price action made higher highs and the RSI made a lower high. Thus, resulting in a bearish divergence.
Also, in this cycle the first peak occurred with the Stochastic RSI above the 80 level and breaking down at a later moment, resulting in bearish momentum. However, this cycle did the same as the previous two. With the bearish momentum the Total 2 Marketcap made a new high with a second Stochastic RSI cross down at the 40/50 level.
Conclusion
This cycle looks a lot like the past two cycles in comparison with the RSI and Stochastic and thus suggesting that there is a possibility that we go in to a new bearmarket and repeat the last two cycles. The current evidence shows that the market might follow the similar path again.
What is a bearish divergence
A bearish divergence signify potential downtrends when prices rally to a new high while the indicator (RSI) refuses to reach a new high and thus making a lower high.
Thanks for your support!
Drop a like and leave a comment to have a conversation about this topic. Make sure to follow me so you don’t miss out on the next analysis.
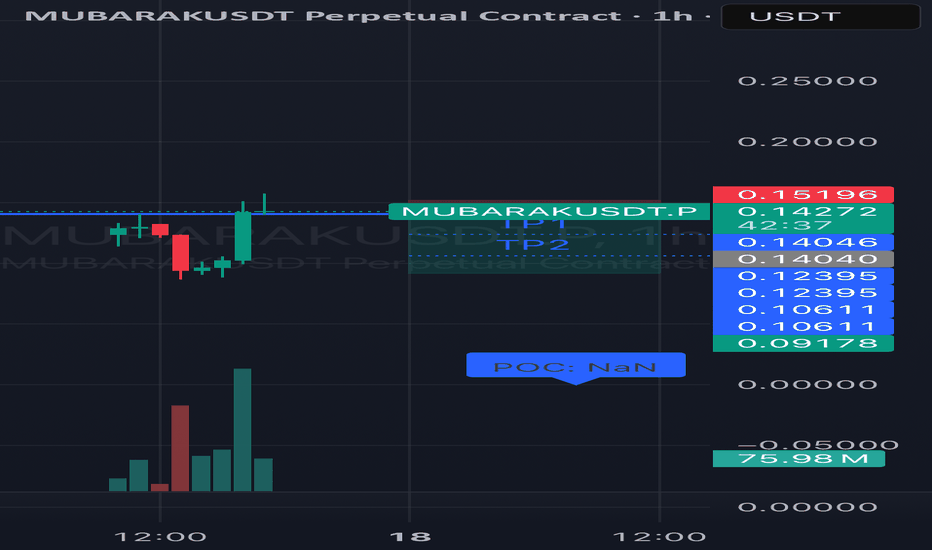
#MUBARAKUSDT continues its downtrend📉 Short BYBIT:MUBARAKUSDT.P from $0,14040
🛡 Stop loss $0,15196
🕒 1H Timeframe
⚡️ Overview:
➡️ The main POC (Point of Control) is Nan
🎯 TP Targets:
💎 TP 1: $0,12395
💎 TP 2: $0,10611
💎 TP 3: $0,09178
📢 Monitor key levels before entering the trade!
BYBIT:MUBARAKUSDT.P continues its downtrend — watching for further movement!
XAG/USD Breakout (17.3.2025)The XAG/USD pair on the M30 timeframe presents a Potential Buying Opportunity due to a recent Formation of a Breakout Pattern. This suggests a shift in momentum towards the upside and a higher likelihood of further advances in the coming hours.
Possible Long Trade:
Entry: Consider Entering A Long Position around Trendline Of The Pattern.
Target Levels:
1st Resistance – 34.31
2nd Resistance – 34.66
🎁 Please hit the like button and
🎁 Leave a comment to support for My Post !
Your likes and comments are incredibly motivating and will encourage me to share more analysis with you.
Best Regards, KABHI_TA_TRADING
Thank you.
GOLD hit 3000$ The first notable event is the Bank of Japan (BOJ) monetary policy meeting on Tuesday, followed by the US Federal Reserve (FED) interest rate decision on Wednesday. The Swiss National Bank (SNB) and the Bank of England (BOE) will announce their interest rate policies on Thursday.
These moves can directly affect the strength of the USD and capital flows into gold. This expert believes that if the FED maintains a "hawkish" stance and takes a cautious view on cutting interest rates, the USD may continue to strengthen, putting pressure on gold prices. On the contrary, if the signals from the FED are more easing, the precious metal may maintain its upward momentum.
Commodity experts at Macquarie have raised their gold price forecast to $3,500 an ounce by the third quarter of 2025. They had previously targeted $3,000 for mid-year, but gold prices have hit that mark earlier than expected.
Fundamental Market Analysis for March 17, 2025 USDJPYThe Japanese yen (JPY) fluctuated between moderate gains and minor losses against its US counterpart during Monday's Asian session amid mixed fundamentals. Optimism driven by China's stimulus measures announced over the weekend is evident in the overall positive tone in Asian stock markets. This, in turn, is seen as a key factor undermining the safe-haven yen.
Nevertheless, a significant yen depreciation remains elusive amid diverging policy expectations between the Federal Reserve (Fed) and the Bank of Japan (BoJ). In addition, geopolitical risks and concerns over the economic impact of US President Donald Trump's tariffs are supporting the yen. In addition, bearish sentiment around the US Dollar (USD) should restrain the USD/JPY pair.
Traders may also refrain from aggressive directional bets and prefer to step aside ahead of this week's key central bank events - the Bank of Japan and Fed decisions on Wednesday. This calls for caution from the yen bears and positioning for a continuation of the recent rebound in the USD/JPY pair from the multi-month low around 146.550-146.500 reached last Tuesday.
Trading recommendation: BUY 148.900, SL 148.400, TP 150.100
AUD/USD Forex Analysis – Trading Update for March 2025The AUD/USD pair has been exhibiting interesting price action over the past week. Following a strong bullish movement that took place on March 4th, 2025, the pair has entered a wedge formation. This bullish push was triggered by the announcement of tariffs, effective starting on March 3rd, 2025.
Key Price Action:
The high of the bullish move was marked at 0.63640, after which the price retraced to test a previous key support level at 0.62730. This level proved to be significant, as it was tested five separate times.
During the retest, the market formed lower lows and lower highs, indicating a shift in market structure. To visualize this, a bearish trendline was drawn, capturing the declining momentum.
Break and Retest:
The move we were anticipating was a break of the bearish trendline, followed by a retest of this trendline. This occurred on March 13-14, 2025, confirming the bearish structure.
After this retest, the weekly close showed a bullish push back to the 1-hour previous high at 0.63286, indicating some bullish interest around this price level.
Current Market Structure:
The pair is now trading within a defined range:
Low: 0.62582
High: 0.63288
We are monitoring the 0.63000 level closely, as it is a critical point of interest. A breakout above or below one of the boundaries of this range will provide further confirmation on the pair's next move.
Next Steps:
If the market respects the 0.63000 level and remains within the range, we will continue to observe price action for any further setups. A break above 0.63288 or below 0.62582 will offer more clarity on the pair’s next directional move.
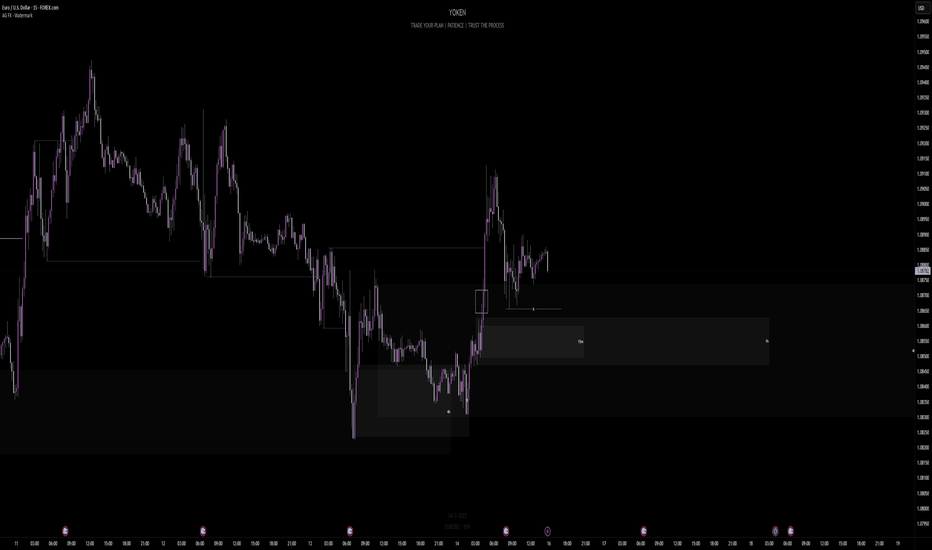
Week of 3/16/25: EURUSD Analysis FIRST VIDEO PUBLISH!First video publish, testing out my recording but also giving my insights for the week ahead. The candle color looks a bit off but hopefully it can be fixed for the next publish.
Pardon the background noise in the first few seconds of the video.
Let me know how the quality and your thoughts/analysis as well!
Happy trading and have a great week traders, let's win.
XRP: The Calm Before the ExplosionXRP has been in strong 100-day accumulation, with a few deviations along the way. Many altcoins have formed reversal patterns, and XRP is setting up for a sharp move upwards. Expecting a breakout from this consolidation phase, potentially propelling XRP to #2 in market cap. The stage is set for a major run!
Entry: NOW
TP: 4
BNB: 380 Days of Accumulation – Big Move Ahead?For over a year, BNB has been in a steady accumulation phase, holding strong while most alts dropped 80-90%. Its resilience in bear markets signals strength and stability, making it a solid contender for the next bull run. A breakout from this range could bring significant upside.
Entry: NOW
TP: 2000
Why DCA Does Not Work For Short-Term TradersIn this video I go through why DCA (Dollar Cost Averaging) does not work for short-term traders and is more suitable for investors. I go through the pitfalls than come through such techniques, as well as explain how trading should really be approached. Which at it's cost should be based on having a positive edge and using the power of compounding to grow your wealth.
I hope this video was insightful, and gives hope to those trying to make it as a trader. Believe me, it's possible.
- R2F Trading
My take on XRP for Vecino Peache.XRP is currently testing the 50 EMA on the daily time frame, a strong resistance level. Throughout February, it made multiple attempts to break above but failed. This suggests a possible correction. A confirmed break below the 200 EMA on the daily chart would further validate this bearish outlook.
My take; I have an OTZ (Optimal Trade Zone) on the 4-hour time frame, which acts as a strong support level. If price breaks below this zone, it signals a potential shift in market direction. As long as XRP respects this support, I will trade it conservatively.
Let me know what are your thoughts on my take.
#ATOM #ATOMUSDT #COSMOS #Analysis #Eddy#ATOM #ATOMUSDT #COSMOS #Analysis #Eddy
It is never too late to buy and invest. Do not rush and do not be fooled by the positive movements and reactions of the market. Wait for the price to reach its valuable areas. In the analysis of the Atom currency, as you can see, there is a strong demand area that is intact. Be patient until the price falls from the decision or extreme flips to the green area of the important demand area. Be sure to check this currency in your monthly time frame and draw the areas. Then refer to the weekly, daily and four-hour time frames and draw the lower time areas and look for confirmation for volatility.
Do not rush to invest and buy spot and let the price reach the support area.
Important areas are drawn and labeled so you can make informed decisions.
Good luck.
XAU/USD Bullish Outlook: Wyckoff Accumulation & Breakout PotentXAU/USD (Gold) - 2H Chart Analysis 🏆📈
🔹 Wyckoff Structure Insight
The chart shows signs of a Wyckoff Accumulation phase.
UTAD (Upthrust After Distribution) at the previous highs suggests a liquidity grab.
Test of the resistance level before a strong rejection downward.
SOW (Sign of Weakness) was observed, but buyers regained control.
🔹 Key Technical Levels
Fair Value Range marked below, showing a potential area of demand.
Unfilled Imbalance (EMB unfilled) signals an area where price might revisit before continuing upward.
Gap below indicates a previous liquidity sweep before the bullish reversal.
🔹 Trend & Price Action
The 200 EMA (red line) is holding as dynamic support.
Current price action is showing higher lows and bullish structure development.
Projected bullish move 📈 is expected to test the $2,940+ region.
🔹 Trading Bias: Bullish ✅
A retracement to the EMA or minor pullback could offer re-entry opportunities.
Invalidation level: Below $2,900, where momentum could shift bearish.
🚀 Gold remains strong; watch for breakouts above $2,940!
Silver Is Eyeing 34-35 Area; Intraday Elliott Wave AnalysisSilver made a three-wave abc correction in wave 4 which can now extend the rally for wave 5 within a new five-wave bullish cycle towards 34-35 area. After recent five-wave impulse into wave "i", followed by an abc corrective setback in wave "ii", it formed a nice intraday bullish setup. Seems like it's now ready for a bullish resumption within wave "iii", so more upside is expected, especially if breaks above trendline and 32.66 level, just watch out on short-term pullbacks.
Fundamental Market Analysis for March 14, 2025 GBPUSDThe GBP/USD pair continues to decline for the second consecutive session, trading near 1.29400 during the Asian session on Friday. The pair faces challenges as the Pound Sterling (GBP) struggles amid weakening risk sentiment, exacerbated by concerns over global trade after US President Donald Trump threatened to impose 200% tariffs on European wines and champagne, which worried markets.
Traders are now awaiting the UK's monthly gross domestic product (GDP) and factory data for January, which will be released on Friday. Investors will be keeping a close eye on the UK GDP data as the Bank of England (BoE) has expressed concerns about the outlook for the economy. At its February meeting, the Bank of England revised its GDP growth forecast for the year to 0.75%, up from the 1.5% projected in November.
The US Dollar (USD) is appreciating amid growing concerns about a slowdown in the global economy, with traders' attention focused on Friday's Michigan Consumer Sentiment Index data. The US Dollar Index (DXY), which tracks the dollar against six major currencies, strengthened after Thursday's positive jobless claims report and weaker-than-expected Producer Price Index (PPI) data. At the time of writing, the DXY is trading near 104.00.
U.S. initial jobless claims for the week ended March 7 came in at 220,000, below the 225,000 expected. Jobless claims fell to 1.87 million, below the forecast of 1.90 million, indicating a resilient U.S. labor market.
Inflationary pressures in the US showed signs of easing. The producer price index rose 3.2% year-on-year in February, down from 3.7% in January and below the market forecast of 3.3%. The core producer price index, which excludes food and energy, rose 3.4% on a year-over-year basis, up from 3.8% in January. On a monthly basis, the core price index was unchanged, while the underlying price index declined 0.1%.
Trading recommendation: SELL 1.29400, SL 1.29900, TP 1.28600
GBP/USD Channel Breakout (14.03.2025)The GBP/USD Pair on the M30 timeframe presents a Potential Selling Opportunity due to a recent Formation of a Channel Pattern. This suggests a shift in momentum towards the downside in the coming hours.
Possible Short Trade:
Entry: Consider Entering A Short Position around Trendline Of The Pattern.
Target Levels:
1st Support – 1.2890
2nd Support – 1.2862
🎁 Please hit the like button and
🎁 Leave a comment to support for My Post !
Your likes and comments are incredibly motivating and will encourage me to share more analysis with you.
Best Regards, KABHI_TA_TRADING
Thank you.
GBP/USD Trade Analysis**GBP/USD Trade Analysis**
📊 **Current Price:** 1.29300
📈 **Bullish Scenario:**
- **Buy above:** 1.29400
- **Target 1:** 1.29600
- **Target 2:** 1.29800
- **Stop Loss:** 1.29150
📉 **Bearish Scenario:**
- **Sell below:** 1.29150
- **Target 1:** 1.29000
- **Target 2:** 1.28800
- **Stop Loss:** 1.29400
📌 **Key Levels:**
- **Resistance:** 1.29450 - 1.29800
- **Support:** 1.29000 - 1.28600
📢 **Risk Management:** Keep SL in place and watch for volume confirmation. 🚀


