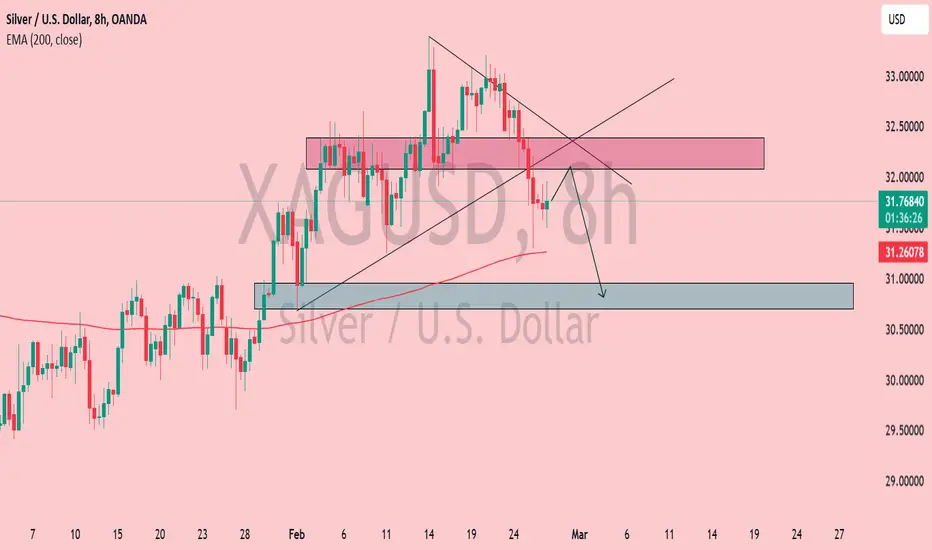
Silver (XAG/USD) Bearish Retest – Drop to $31 Incoming?Silver (XAG/USD) - 8H Chart Analysis
📉 Bearish Setup in Play
Breakout & Retest: Price broke down from a wedge pattern and is currently retesting the supply zone (highlighted in red).
EMA (200) Support: The 200 EMA (31.26) is acting as dynamic support. If price holds below, further downside is expected.
Bearish Target: A move towards the demand zone (30.80 - 31.00) (blue area) is anticipated.
Key Resistance: The rejected zone around 32.00 remains crucial for trend direction.
💡 Trade Idea:
If rejection is confirmed at the supply zone, short positions targeting 31.00 look promising.
A break above 32.00 could invalidate the bearish outlook.
🔥 Watch for confirmation! 🚀
Analysis
Fundamental Market Analysis for February 28, 2025 EURUSDEUR/USD remains under selling pressure near 1.0390 during Asian trading on Friday. The euro (EUR) is weakening against the US dollar (USD) amid risk-off sentiment. The US Personal Consumption Expenditure (PCE) price index will take centre stage later on Friday.
Late Thursday, US President Donald Trump said that 25 per cent duties on imports from Canada and Mexico will take effect on March 4, rather than April 2 as he had anticipated the day before. Trump also said goods from China would be subject to an additional 10 per cent duties. He also promised this week to impose 25 per cent tariffs on shipments from the European Union. Tariff uncertainty from Trump is likely to weigh on the common currency in the near term.
Cleveland Fed President Beth Hammack said on Thursday she expects the US central bank's interest rate policy to be put on hold for now amid a search for evidence that inflationary pressures are easing and returning to the 2 per cent target. Meanwhile, Atlanta FRB President Raphael Bostic said late Wednesday that the Fed should keep interest rates on hold, which continues to put downward pressure on inflation. The Fed's cautious stance could boost the US Dollar and serve as a headwind for EUR/USD.
Trade recommendation: SELL 1.0380, SL 1.0430, TP 1.0300

Buy EUR/CAD High Impact NewsThe EUR/CAD pair on the M15 timeframe presents a Potential Buying Opportunity due to a recent Formation of a Breakout Pattern. This suggests a shift in momentum towards the upside and a higher likelihood of further advances in the coming hours.
Possible Long Trade:
Entry: Consider Entering A Long Position around Trendline Of The Pattern.
Target Levels:
1st Resistance – 1.5086
2nd Resistance – 1.5124
🎁 Please hit the like button and
🎁 Leave a comment to support for My Post !
Your likes and comments are incredibly motivating and will encourage me to share more analysis with you.
Best Regards, KABHI_TA_TRADING
Thank you.

XAG/USD Bearish Flag (27.2.25)The XAG/USD Pair on the M30 timeframe presents a Potential Selling Opportunity due to a recent Formation of a Bearish Flag Pattern. This suggests a shift in momentum towards the downside in the coming hours.
Possible Short Trade:
Entry: Consider Entering A Short Position around Trendline Of The Pattern.
Target Levels:
1st Support – 31.06
2nd Support – 30.66
🎁 Please hit the like button and
🎁 Leave a comment to support for My Post !
Your likes and comments are incredibly motivating and will encourage me to share more analysis with you.
Best Regards, KABHI_TA_TRADING
Thank you.

NZD/CAD -H1 Chart - Wedge Breakout (27.02.2025)The NZD/CAD Pair on the H1 timeframe presents a Potential Selling Opportunity due to a recent Formation of a Wedge Breakout Pattern. This suggests a shift in momentum towards the downside in the coming hours.
Possible Short Trade:
Entry: Consider Entering A Short Position around Trendline Of The Pattern.
Target Levels:
1st Support – 0.8101
2nd Support – 0.8068
🎁 Please hit the like button and
🎁 Leave a comment to support for My Post !
Your likes and comments are incredibly motivating and will encourage me to share more analysis with you.
Best Regards, KABHI_TA_TRADING
Thank you.

#SHELLUSDT – Bullish Scenario, Expecting a Breakout📈 LONG BYBIT:SHELLUSDT.P from $0.7000
🛡 Stop Loss: $0.6671
⏱ 1H Timeframe
⚡ Trade Plan:
✅ The BYBIT:SHELLUSDT.P price is showing strong momentum after breaking out of a consolidation zone.
✅ The asset has broken above $0.6957 and is holding above this level, signaling a potential continuation of the uptrend.
✅ Increasing volume confirms buyer activity.
🎯 TP Targets:
💎 TP 1: $0.7350
🔥 TP 2: $0.7700
📢 Holding above $0.7000 would confirm further bullish movement.
📢 POC at $0.4671 is far below the current price, indicating a trend shift.
📢 Increasing volume supports the bullish case.
📢 Securing partial profits at TP1 ($0.7350) is a smart risk-management strategy.
🚀 BYBIT:SHELLUSDT.P remains in an uptrend – monitoring for continuation and securing profits at TP levels!

US PCE could be the catalyst for USDJPY to make a stronger moveMARKETSCOM:USDJPY is currently flirting with the area around the 149.00 hurdle. In order to shift our attention to some lower areas, a drop below the lowest point of December 2024 is needed. But what about the US PCEs? Let's dig in...
FX_IDC:USDJPY
What are your thoughts on this?
74.2% of retail investor accounts lose money when trading CFDs with this provider. You should consider whether you understand how CFDs work and whether you can afford to take the high risk of losing your money. Past performance is not necessarily indicative of future results. The value of investments may fall as well as rise and the investor may not get back the amount initially invested. This content is not intended for nor applicable to residents of the UK. Cryptocurrency CFDs and spread bets are restricted in the UK for all retail clients.

Key Liquidity Zone in Play – Sniper Bounce to ATH? (XAU/USD)Alright GTK Family! 🏆
Here are our key zones for today:
🔹 4H Bullish OB Holding… For Now – Price is currently respecting our 4H Bullish OB, but the chances of breaking through aren’t slim considering the extreme bearish momentum from market open. 📉
🔹 Liquidity Grab & Bounce? – If price breaks below the OB, I expect a sweep of liquidity at the Feb 10 Weekly Low, followed by a strong push back up towards ATH. 💧🚀
🔹 Bearish Scenario? – If price rejects upwards, the next key resistance is the 4H Bearish FVG, which could be a selling opportunity, but it would be a riskier trade. ⚠️
📍 Key Levels to Watch:
✅ 4H Bullish OB – Holding as support (for now) 🟢
✅ Feb 10 Weekly Low – Major liquidity zone 💧
❌ 4H Bearish FVG – Potential sell area, but risky 🔴
🎯 ATH Target – If bulls regain control 🚀

EUR/USD - H1- Chart - Ascending Triangle (27.02.2025) The EUR/USD Pair on the H1 timeframe presents a Potential Selling Opportunity due to a recent Formation of a Triangle Breakout Pattern. This suggests a shift in momentum towards the downside in the coming hours.
Possible Short Trade:
Entry: Consider Entering A Short Position around Trendline Of The Pattern.
Target Levels:
1st Support – 1.0433
2nd Support – 1.0405
🎁 Please hit the like button and
🎁 Leave a comment to support for My Post !
Your likes and comments are incredibly motivating and will encourage me to share more analysis with you.
Best Regards, KABHI_TA_TRADING
Thank you.

Fundamental Market Analysis for February 27, 2025 USDJPYThe Japanese yen (JPY) is declining against its US counterpart during the Asian session on Thursday, although it remains near the highest level since October 2024 reached earlier this week. Comments from Bank of Japan (BoJ) Governor Kazuo Ueda last week about a potential increase in regular bond purchases led to a further decline in Japanese government bond (JGB) yields. In addition, concerns over US President Donald Trump's tariff plans and a positive tone on risks proved to be key factors undermining the yen exchange rate.
However, a significant Yen depreciation still seems unlikely amid growing market confidence that the Bank of Japan will continue to raise interest rates this year amid rising inflation in Japan.
Nevertheless, Federal Reserve (Fed) Chairman Jerome Powell has made it clear that policymakers are in no hurry to cut interest rates. What's more, previously released U.S. consumer inflation data suggests that the Fed doesn't have much room to cut rates this year. This, in turn, pushed US Treasury bond yields up, widening the yield differential between the US and Japan and limiting the upside potential for the low-yielding Yen.
Trading recommendation: BUY 149.200, SL 148.800, TP 150.000

Bitcoin back to $75,000 from here?Seems like that guy Michael Saylor, the CEO of Strategy just wasted hundreds of millions of dollars by buying $1.99 billion worth of Bitcoin at an average price of $97,514 per bitcoin, right before the drop down below $80k to probable $75k area.
Rushing to buy at highs like that instead of being smart about it and loading much more at the dips is hard to understand.

Will DAX go for another all-time high?It seems that geopolitics are the key driving force of the MARKETSCOM:DE30 bulls. The current news on a possible end of the war in Ukraine is helping boost trader morale. Let's dig in!
XETR:DAX
What are your thoughts on this?
74.2% of retail investor accounts lose money when trading CFDs with this provider. You should consider whether you understand how CFDs work and whether you can afford to take the high risk of losing your money. Past performance is not necessarily indicative of future results. The value of investments may fall as well as rise and the investor may not get back the amount initially invested. This content is not intended for nor applicable to residents of the UK. Cryptocurrency CFDs and spread bets are restricted in the UK for all retail clients.

FFM Targeting 1.5??Hi dear trading lovers and FFM buyers...
PLEASE NOTE THAT THIS IS ONLY AN ANALYSIS AND COULD BE WRONG...
Chart and lines are explaining my idea...
SEEMS FFM is in a uptrend targeting 1.5 and finally 1.7...
Also note that:
"Macquarie has initiated coverage of FireFly Metals with an Outperform rating and set a price target of A$1.50"

XAUUSDLooking at that. I would say to buy gold. Because gold sweeps daily fvg, takes these lows. OI showing also that the bear is weak.

XAU/USD Pullback or Reversal? Key Support Zone in Focus!📊 Gold (XAU/USD) Daily Chart Analysis – Feb 16, 2025
🔹 Current Price: $2,882.48 (-1.57%)
🔻 Recent High: $2,939.98
🔻 Recent Low: $2,877.03
🔴 200 EMA: $2,562.04 (Long-term support)
🧐 Key Observations:
✅ Strong Uptrend: Price has been in a bullish trend since late 2024.
✅ Support Zone: A key demand zone around $2,850 - $2,870 (highlighted in blue).
✅ Trendline Retest: The price is testing the trendline, which could act as support.
📉 Possible Scenarios:
🔹 Bullish Case: If buyers step in at the support zone, we could see a bounce towards $2,950 - $3,000 🚀.
🔹 Bearish Case: A breakdown below $2,850 may trigger a deeper pullback to $2,800 - $2,750 ❄️.
🎯 Trading Plan:
📌 Buy Setup: Look for bullish confirmation (e.g., reversal candles) in the support zone before entering long.
📌 Sell Setup: If the price closes below $2,850, short positions could be considered with targets near $2,750.
🔥 Final Thoughts: Despite today’s pullback, gold remains bullish unless key support levels break. Watching price action around the blue zone will be crucial!
📢 Traders, what’s your take? Are we bouncing or breaking down? Let’s discuss! 👇💬 #Gold #XAUUSD

XAU/USD (Gold) Trendline Breakout (21.02.2025)The XAU/USD Pair on the M30 timeframe presents a Potential Selling Opportunity due to a recent Formation of a Trendline Breakout Pattern. This suggests a shift in momentum towards the downside in the coming hours.
Possible Short Trade:
Entry: Consider Entering A Short Position around Trendline Of The Pattern.
Target Levels:
1st Support – 2904
2nd Support – 2880
🎁 Please hit the like button and
🎁 Leave a comment to support for My Post !
Your likes and comments are incredibly motivating and will encourage me to share more analysis with you.
Best Regards, KABHI_TA_TRADING
Thank you.

Bitcoin's Unbalanced move with the US electionsThe overall trend is still bullish, but the market needs to rebalance at $86,686 before it can push to new highs. Right now, the price action is not respecting bullish structure and is moving sideways in a consolidation phase.
The market does not move in a straight line. Every strong move needs to be balanced before continuing. The price left behind inefficiencies during the last expansion, and the market seeks to correct these before the next leg up. Liquidity is key. Right now, there is an imbalance that needs to be filled, and resting liquidity below must be taken before the market can resume its upward trend.
Smart money is not buying at current levels. They need better pricing and the market naturally moves to levels where institutional interest is highest. That level is around eighty-six thousand six hundred eighty-six, where a large amount of liquidity is positioned. The market is likely to dip into this level, take out weak-handed buyers, and trap sellers before pushing higher.
A ten percent drop from here would bring the price into that area, where real accumulation can take place. Until then, any short-term rallies are likely to be liquidity grabs rather than true continuation.
Please do not forget that this is a daily chart and we can see more liquidity grabs before reaching the target. This is an idea and nothing in the future is certain. With unexpected news we can see unexpected moves.
COINBASE:BTCUSD INDEX:BTCUSD BINANCE:BTCUSD KRAKEN:BTCUSD BINANCE:BTCUSDT BINANCE:BTCUSDT28H2025

Fundamental Market Analysis for February 25, 2025 EURUSDThe rise in US inflation data last week triggered a new wave of risk aversion among investors. Now their attention is focused on the upcoming Personal Consumption Expenditure (PCE) inflation data, which is expected later this week. Traders are hoping that the rise in US core inflation will quickly fade early in the year and not lead to a new protracted battle with ‘transitory’ inflation that will be too high for the Federal Reserve (Fed) to go for a rate cut. Market participants expecting a faster pace of Fed rate cuts in 2025 are already feeling the pressure as US President Donald Trump tries to ignite a global trade war. In addition, another spike in inflation could extinguish any remaining hopes of a rate cut. On Monday, President Trump repeated his threats of imposing high tariffs on Canada and Mexico, warning that the tariffs were still due to take effect ‘next month’ after he recently caved in to tariff pressure and granted deferrals to nearly all countries he has targeted for import taxes on their citizens.
German consumer price index (CPI) data as well as retail sales activity figures are also due out on Friday. The German data, which is an indicator of EU-wide data, is likely to attract the attention of some traders on Friday, but the key factor influencing the market will be PCE inflation in the US.
Trade recommendation: SELL 1.0500, SL 1.0550, TP 1.0400

COQUSDT: The Market Squeeze—Reversal or Breakdown?COQUSDT at a Turning Point: Is the Bottom in?
COQUSDT is sitting at a critical juncture, hovering near $0.007427, a level that’s still 56% above its all-time low but nearly 89% off its peak. After weeks of sideways action, buy volumes have surged at key points, hinting at possible accumulation. But with RSI (14) at 35.6, are we witnessing the final stages of oversold conditions, or is there more downside ahead?
The 200-day MA looms at $0.010096, far above the current price, showing just how deeply this asset has been discounted. Momentum indicators suggest that COQUSDT is battling heavy resistance at $0.008245, a level that could determine the next leg of movement. The question is: Are bulls strong enough to flip this level into support, or will bears force a retest of the lower range?
With a mix of increased buy-side activity and lingering bearish pressure, the market is at a crucial decision point. Will we see a breakout to test the 100-day MA at $0.009132, or is another sell-off lurking around the corner? Buckle up—this could be the moment traders have been waiting for.
Roadmap: COQUSDT’s Recent Patterns – Are We Seeing a Reversal?
The market never lies—price action is the ultimate storyteller. Over the past few sessions, COQUSDT has been flashing some intriguing signals. Let's break down the key patterns that played out, separating the noise from the real moves.
February 21, 20:00 UTC – Buy Volumes Surge
A major Buy Volumes pattern kicked in as COQUSDT opened at $0.008589 and closed higher at $0.008975, testing resistance near $0.009193. The setup suggested an upward continuation, but was it enough?
February 21, 21:00 UTC – Confirmation of Strength
Bulls doubled down with another Increased Buy Volumes pattern, pushing the close up to $0.009475, hitting a session high of $0.009639. This confirmed the previous signal—buyers were stepping in aggressively.
February 22, 08:00 UTC – VSA Buy Pattern 4 Appears
The formation of a VSA Manipulation Buy Pattern 4th hinted at accumulation. The price action showed a minor retrace before stabilizing at $0.009158. However, the real test was ahead: Would buyers maintain control?
February 23, 13:00 UTC – A Battle at Resistance
A powerful VSA Manipulation Buy Pattern 3rd formed, keeping the buy-side momentum alive. The asset climbed further, closing at $0.009186—almost a direct follow-through from the prior pattern.
February 23, 16:00 UTC – Bears Strike Back
A major shift came as a Sell Volumes Max pattern emerged. The price reversed hard, closing down at $0.008515, marking the first sign of bearish dominance since the rally began.
February 24, 15:00 UTC – Sell Pressure Increases
Following the sell-off, the next candle confirmed more downside pressure with an Increased Sell Volumes pattern. The close at $0.007824 meant the bulls had officially lost their grip—momentum had shifted.
February 24, 16:00 UTC – Buyers Attempt a Comeback
Just when things looked bleak, a Buy Volumes Max pattern emerged. The asset rebounded slightly, closing at $0.007895, attempting to reclaim lost ground.
The takeaway? The buy-side momentum played out correctly up until February 23, proving that the earlier bullish patterns were accurate indicators of the rally. However, the sell signals on February 23-24 completely flipped the script, showing how fast sentiment can shift.
What’s Next? If buy volumes continue to build, we could see another attempt at breaking resistance around $0.008245. But if the sellers maintain control, expect further downside pressure. Stay sharp—this market is moving fast.
Technical & Price Action Analysis: Key Levels to Watch
Levels don’t lie—price respects structure, and smart money knows where liquidity is stacked. Here’s the real deal on support and resistance for COQUSDT. If a level doesn’t hold, expect it to flip into a new battlefield for bulls and bears.
Support Levels:
$0.005691 – First line of defense. If buyers don’t step in, we could see a deeper dive.
$0.00551 – The last standard support before things get ugly. A break below could open up a liquidity grab.
Resistance Levels:
$0.008245 – Immediate ceiling. Needs a strong push to flip bullish.
$0.009099 – A key decision point. Rejection here and sellers will pile in.
$0.010465 – A major pivot area. Break and hold above? We’re talking trend shift.
$0.011432 – Bulls need to own this level for sustained momentum.
$0.012347 – The breakout zone. If we see clean closes above, the game changes.
Powerful Support Levels:
$0.01302 – The fortress. If COQUSDT ever gets back above this, it’s game on for bulls.
Remember: If these supports fail, they become resistance. That’s how price action works—liquidity zones shift, and traders reposition. Watch the reactions, manage risk, and don’t get caught on the wrong side of the play.
Trading Strategies Using Fibonacci Rays
Understanding price action means reacting to movement, not predicting levels. My proprietary Fibonacci Rays method helps identify dynamic zones where price interacts before making its next big move. Each ray serves as a pivot, defining whether price rejects or continues.
These rays are already drawn on your chart, intersecting with VSA patterns and Moving Averages, giving you a structured roadmap for trades. Let’s break down the possible scenarios:
Optimistic Scenario: Breakout & Trend Continuation
If COQUSDT interacts with a key ray and confirms bullish movement, we ride the trend from one ray to the next, securing targets along the way.
Long Entry: Above $0.008245 (First Resistance)
Target 1: $0.009099
Target 2: $0.010465
Target 3: $0.011432 (Major trend shift)
Invalidation: Below $0.008000 (Rejection from ray)
Aggressive Long: If price reclaims MA50 ($0.008452)
Target 1: $0.009132 (MA100)
Target 2: $0.010096 (MA200)
Invalidation: Close below MA50 with volume spike
Pessimistic Scenario: Rejection & Trend Weakness
If price interacts with a ray but fails to confirm strength, we look for short opportunities targeting the next dynamic level.
Short Entry: Below $0.008245 (Failed breakout)
Target 1: $0.007427 (Current support)
Target 2: $0.005691 (Deeper correction zone)
Invalidation: Close above $0.008500 with strong momentum
Breakdown Short: If price loses MA50 and MA100 together
Target 1: $0.00551 (Final major support)
Invalidation: Price reclaims MA100 & MA50 with buy volume
💡 Key Takeaway: Positions should be taken only after price interacts with a ray and confirms movement. No blind entries—wait for market structure to guide you. Every ray crossover is a checkpoint, where price moves from one level to the next, giving traders a clear trade flow.
What’s Next? Let’s Talk Strategy!
Trading is all about understanding key reaction zones—that’s why I lay everything out before price makes its move. If you found this breakdown useful, make sure to Boost this idea and save it—check back later and see how price respects the levels. That’s how you sharpen your edge in the market.
Got questions? Drop them in the comments! I always check and reply when I can. Let’s discuss setups, levels, or anything that needs clarification.
My Fibonacci Rays indicator does all the heavy lifting—mapping levels and rays automatically. It’s Private, but if you’re interested in using it, shoot me a DM.
Want a breakdown for your favorite asset? I can analyze any chart—some ideas I post for free, while others we can discuss privately. If you have something specific in mind, let’s talk!
And remember—these rays work on ANY asset. If you want me to chart a specific one, hit Boost and drop a comment—I’ll get to it when I can.
If you’re not following me yet, now’s the time. Stay ahead of the market with my latest updates right here on TradingView. 🚀

Title: PEIPEI’s 91% Crash – Rebound or Freefall?Is the Market Preparing for a Turnaround?
PEIPEI (BYBIT-1000000PEIPEIUSDT.P) is at a critical juncture, trading at $0.03381, down a staggering 91% from its all-time high of $0.3987. With RSI at 27.91, the asset is deep in oversold territory, signaling a potential setup for a bounce. However, a surge in sell volumes raises the question—will buyers step in, or is there another leg down?
The resistance at $0.03697 is the first test for bulls, while the $0.02977 support level could determine whether this is a buy-the-dip moment or a breakdown waiting to happen. The battle between VSA buy patterns and sell volume dominance is heating up, setting the stage for a decisive move.
Are traders ready for a sharp reversal, or is this just another stop on the way down? Time is running out—PEIPEI is on the edge.
Roadmap: PEIPEI’s Recent Pattern Evolution – What’s Next?
Tracking PEIPEI’s price action over the last few days, we’ve seen a series of buy and sell dominance patterns battling for control. Some have hit their marks perfectly, confirming expected movements, while others failed to trigger, leading to unexpected reversals. Here’s the key roadmap of what unfolded and what traders should watch for next:
February 22, 07:00 UTC – Increased Buy Volumes
A strong push saw PEIPEI climbing from $0.04001 to $0.0419, confirming buy-side momentum. This setup followed a classic VSA Buy Pattern, hinting at sustained upside pressure.
February 22, 08:00 UTC – Buy Volumes Take Over (Sell Reversal Fails)
Instead of holding the gains, PEIPEI saw an aggressive reversal with a close at $0.03969, undercutting previous lows. This was a failed bullish continuation, showing early signs of weakness.
February 22, 23:00 UTC – Sell Volumes Max – Bears Take Over
The real shift came when the increased sell volumes kicked in, dropping PEIPEI from $0.04134 to $0.0389. This was the first real test of bearish strength, confirming a shift in sentiment.
February 23, 13:00 UTC – Increased Sell Volumes – Momentum Confirmed
With PEIPEI closing at $0.03909, the downtrend gained serious traction. This was a strong signal that any rebounds were short-lived—sellers were in control.
February 23, 14:00-15:00 UTC – VSA Buy Patterns Attempt a Comeback
Two consecutive VSA Buy Patterns formed, but failed to hold ground above $0.04032, proving that bulls lacked conviction.
February 24, 06:00 UTC – Buy Volumes Take Over (But Sellers Strike Back)
Another brief bullish surge saw PEIPEI push toward $0.03836, only to close weaker at $0.03804. This was another case of a fake breakout, reinforcing bearish momentum.
February 24, 22:00 UTC – Sell Volumes Spike Again
This was the final confirmation—PEIPEI dropped from $0.03651 to $0.03358, closing near its lowest levels. At this stage, bears completely dominated the market, signaling potential for even lower prices.
Key Takeaways for Traders:
The roadmap is clear—bearish pressure has been unrelenting. Every bullish attempt has been met with strong resistance, with failed buy patterns reinforcing short-term downside bias. With PEIPEI trading at $0.03381, traders should keep an eye on $0.03697 resistance—a break above it could be the first sign of a real comeback. Until then, this remains a sell-the-rally environment.
Technical & Price Action Analysis – Key Levels to Watch
PEIPEI is at a make-or-break zone, and every trader should have these key levels on their radar. If these supports don’t hold, expect them to flip into resistance—trading is all about adapting to the tape.
Support Levels:
$0.02977 – First line of defense. If buyers don’t show up here, expect this to act as resistance on any weak bounces.
Resistance Levels:
$0.03697 – Immediate barrier. A strong close above signals momentum, otherwise it’s a bull trap.
$0.04004 – The last short-term lid before bigger breakouts. Rejection here = more downside.
$0.04921 – A serious level. Any push toward this zone needs real volume behind it.
$0.05701 – Psychological battle zone. If price reaches here, momentum traders will pile in.
$0.06098 – Major inflection point. If we see exhaustion here, expect a hard rejection.
Powerful Support Levels:
$0.08812 – If we ever get back here, it’s either a full reversal or a massive fakeout. A close below? Lights out for bulls.
Right now, sellers are in control, but levels are made to be broken. Trade the confirmation, not the emotion.
Trading Strategies Based on Rays – Optimistic & Pessimistic Scenarios
The VSA Rays on the chart provide the foundation for trade setups. These rays, built on Fibonacci-based angles, define key interaction zones where price either bounces or breaks through, signaling the next directional move. Positions should be taken only after confirmation, meaning interaction with the ray and the first impulse in the expected direction. The movement will continue from one ray to the next, making them the core framework for entries and exits.
Optimistic Scenario – Bulls Take Control
Entry: On confirmation above $0.03697, the first resistance ray.
Target 1: $0.04004 – If volume supports the move, this level is the first checkpoint.
Target 2: $0.04921 – Breakout above will trigger FOMO buying.
Target 3: $0.05701 - $0.06098 – Final target if bulls maintain control, where major profit-taking is expected.
Stop Loss: Below $0.03697, as failure to hold means the breakout is invalid.
📌 Dynamic Factors to Watch:
– MA50 (0.03797) & MA100 (0.03869) → If price breaks above and holds, this strengthens bullish momentum.
– RSI moving above 50 → Signals increased buying strength.
Pessimistic Scenario – Bears Regain Dominance
Entry: On rejection at $0.03697, confirming resistance.
Target 1: $0.02977 – Key support where a short trade can take partial profits.
Target 2: $0.02448 – The lowest price in recent history, where liquidity may spike.
Stop Loss: Above $0.03697, as a breakout would invalidate the short setup.
📌 Bearish Confirmation Factors:
– Price rejection at MA50/MA100 → Means upside momentum is weakening.
– RSI failing to break 40 → Confirms continued downside pressure.
Potential Trade Setups Based on Key Levels & Rays
Breakout Buy: If price closes above $0.03697, enter long with targets at $0.04004 and $0.04921.
Support Bounce Buy: If $0.02977 holds with a strong bounce and volume, enter long targeting $0.03697.
Short Rejection Trade: If price rejects $0.03697 with no bullish confirmation, enter short with $0.02977 as target.
Breakdown Short: If price loses $0.02977, short targeting $0.02448, the last major low.
The key takeaway? Price moves from ray to ray. Wait for confirmation, trade with the trend, and let the market show its hand before committing. 🚀
Let’s Talk – Drop Your Questions Below!
Trading is all about understanding levels and tracking price movement in real time—so don’t just read this and scroll past. Hit Boost, save this post, and come back later to see how price reacts to my mapped-out levels. Spoiler: it usually does.
Got questions? Drop them in the comments—whether it’s about this setup or another asset you’re watching. If you want a personal breakdown of your favorite coin, stock, or commodity, I can do that too. Some analyses I share publicly, others I can do privately—just reach out and we’ll figure it out.
For those asking about my auto-drawn Rays & Levels system—it’s private, but if you’re interested, send me a message, and we’ll talk. The best part? These levels work on every asset.
🚀 Want a custom markup on your asset? Boost this post, comment below, and I’ll cover as many as I can! And if you’re not following me yet—well, now’s the time. See you in the next update! 👇

GOLD Bullish Bias! Buy!
Hello,Traders!
GOLD is making a bullish
Rebound from the support
Cluster of rising and horizontal
Support levels so as Gold is
Trading in an uptrend we are bullish
Biased and we will be expecting
A further bullish move up
Buy!
Comment and subscribe to help us grow!
Check out other forecasts below too!

HAG Long: A trade based on the current geopolitical climateHENSOLDT AG ( HAG ) continues to respect its long-term ascending channel, with price action now testing multi-year resistance. Heightened geopolitical tensions, particularly between the US, EU, and Russia, coincide with recent upward momentum. Historically, international conflicts have bolstered defence equities, and the current macro backdrop remains consistent with that theme.
A sustained breakout above resistance could signal a shift in market expectations, while the underlying trend reflects the broader geopolitical landscape. Ironically, the chart represents the doomsday clock better than the clock itself. The irony doesn't end there, for global peace lies below the support for this stock. As soon as supporters of this stock take their hands off the wheel, peace inches closer. Bears on defence stocks bring peace. 🏝️
For now, it's time to be a bull. Probably.

Bitcoin Holds Strong: $100K Breakout or Pullback Ahead?#Bitcoin Update
Bitcoin remains in a tight consolidation phase after rebounding from key support.
Support at $93,700 Holding: BTC has successfully defended the ascending trendline and 200 EMA, showing strong buyer interest around this level.
Range-bound movement: The price continues to hover between the ATH resistance and the lower support, forming a key accumulation zone.
Breakout Watch: A daily close above the $100,000 resistance could lead to a breakout, while a failure to hold support may trigger a correction.
Traders should keep an eye on BTC’s next move, as volatility could increase soon.
DYOR, NFA
#BTC #Crypto
